Is the Land Boom Fizzling?
August 1, 1974
PAER-1974-1
Authors: J. H. Atkinson, Professor; James Pratt, Temporary Instructor
![]()
![]()
![]()
![]()
![]()
Farm land values in Indiana may decline between the spring and fall of this year. This conclusion is based on a mid-June survey of over 100 appraisers, brokers, farm managers and lenders. If correct, this may mean the end of the big land boom which began in late 1972.
The Federal Reserve Bank of Chicago estimated a 24 percent increase in Indiana land values for the year ending January 1, 1974; the USDA estimate was 28 percent from November to November. Prices continued strong during the winter and early spring. Federal Reserve figures show a whopping 16 percent increase from January to April. Although the USDA index of farm land values indicated only about a 6 percent increase in Indiana from November 1973 to March 1974, increases in other corn belt states were from 12 to 15 percent.
Recent Land Prices
The recently completed Indiana survey asked for estimates of land values by three classes of farm land and for land moving in – to non-farm uses (transitional land). Respondents gave their estimates of corn yields and land values for top, average and low-quality land. These replies were sorted into 5 geographic areas (Figure 1).
Average farm land values for the West Central and Central areas were higher than for other areas. This may be caused, in part, by the greater importance of grain farming relative to livestock in the West Central and Central areas. Also, corn yield estimates tended to be higher in these areas, an exception being the relatively high yield estimates in top and average quality land in the Northeast.
Top land values in the West Central and Central areas in the spring of this year averaged around $1,200 per acre, in contrast to about $1, 000 per acre in the North and Northeast and just under $900 in the South (Table 1). This same regional difference held for lower quality land. For example, the value of average quality land in the West Central and Central areas was reported to be a little over $ 900, about $ 750 in the North and Northeast, and under $700 in the South.
Transitional land values in the North and Central (both areas with major urban centers) were reported to be around $2,300 per acre. Average values in other areas were some $400 to $650 lower.
Big Price Increases, Fall ’73 to Spring ’74
For all areas except the South, per acre price increases by land quality were about as follows (fall 1973 to spring 1974):
- Top quality land – – up $200 to $300 per acre.
- Average quality land — up $150 to $200 per acre.
- Poor quality land — up $100 to $125 per acre.
In the South, these increases were less – -$126, $110 and $80 per acre for top, average and poor land.
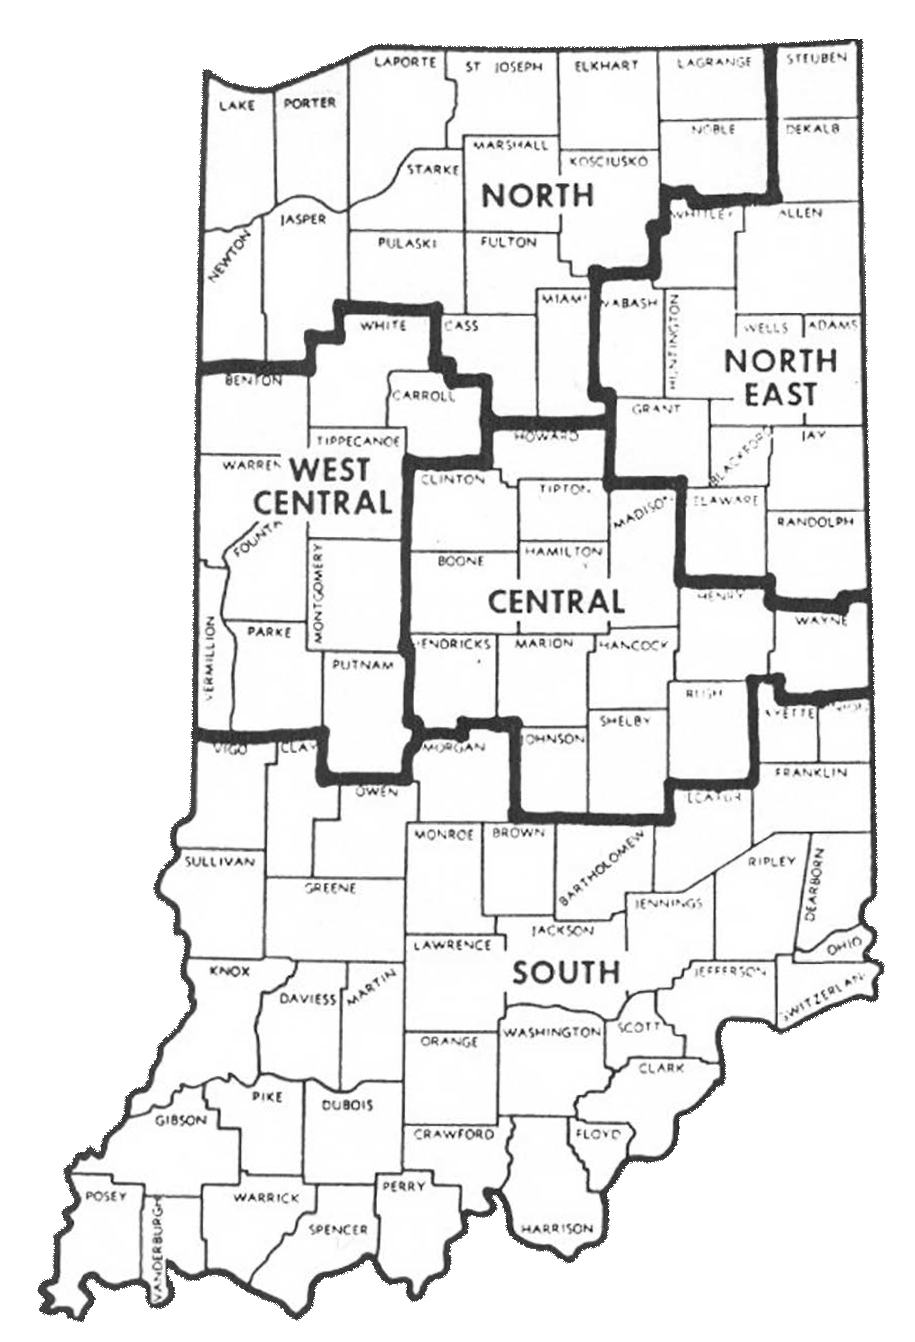
Figure 1. Geographic Areas Used in Purdue Land Values Survey, June, 1974.
In percentage terms, these big increases were equally impressive. In 11 of 15 area quality groups of farm land, this 6-month increase averaged between 22 and 31 percent (Table 2). Average and poor-quality land in Central Indiana was reported to have increased by 20 and 18 percent respectively. In the South, increases for top and average land were 17 and 19 percent. Except in the South, the estimated change in top land values from last fall to spring was close in all areas ranging from 27 to 31 percent.
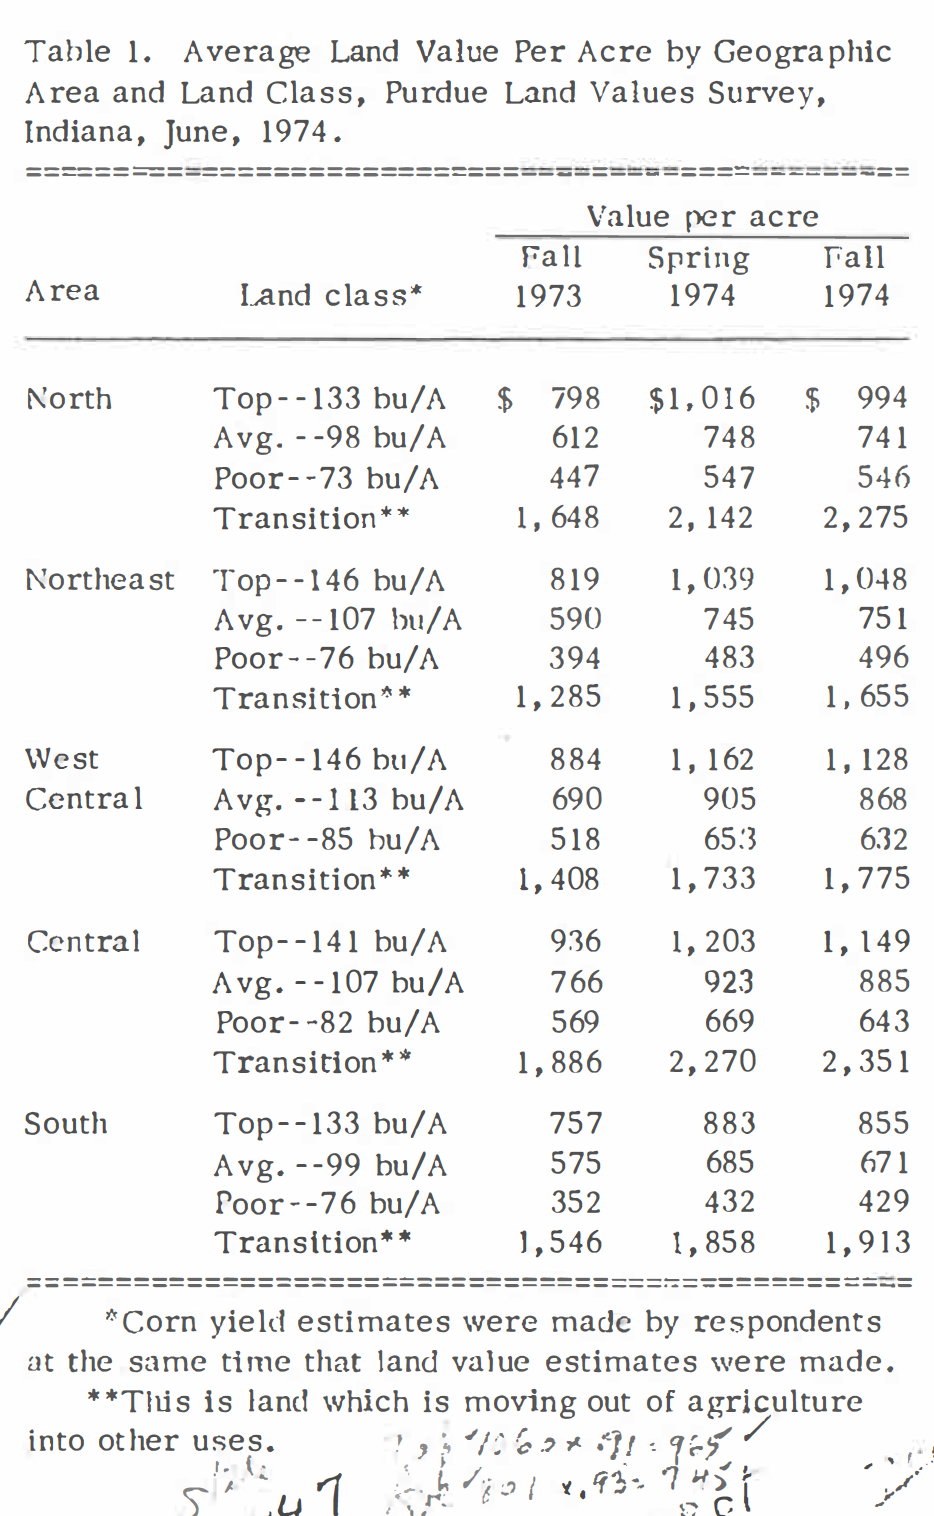
Table 1. Average Land Value Per Acre by Geographic Area and Land Class, Purdue Land Values Survey, Indiana, June, 1974.
*Corn yield estimates were made by respondents at the same time that land value estimates were made.
**This is land which is moving out of agriculture into other uses.
What’s Ahead in the Short Term?
The big increases in land values last winter followed record and near -record prices for farm products, generally good crops and ideal harvesting weather. In contrast, by June of this year cattle and hog prices were low, grain prices had fallen from spring peaks, land was unplanted in many areas and it was still raining!
Perhaps these conditions contributed to the bearishness of the respondents with regard to changes from spring (February March) to fall (October-December) of this year. This is a prediction, yet we already are into the period of time over which the change will occur. Only in the Northeast are average farm land values expected to increase, and these by less than 3 percent. In all other areas and for all classes except land in transition, the average of expected
land prices showed declines of 4 1/2 percent or less.
Although the average of expected land prices this fall indicated a leveling off or decline, about one out of four respondents expected continued increases. The other three fourths were about equally divided between those who expected declines and those who thought farm land values from spring to fall would be stable. Thus, those who expected increasing values were definitely in the minority. Expectations were more bullish for transitional land — less than 10 percent expected any decline by fall.
There are scattered reports that very little land is selling at the present time (early July). Value estimates are hard to make in such a situation. Yet responses from over 100 appraisers, managers, brokers and lenders clearly indicate that they expect an early end to the upward spiral in land values of the last 18 months.
They may not be right. The size of the corn and bean crops is highly uncertain. Prices for these crops had strengthened as· of early July. The demand for these crops is uncertain. Thus, the “right” set of circumstances could not only result in higher fall prices and incomes than had been expected but also brighten the outlook for 1975.
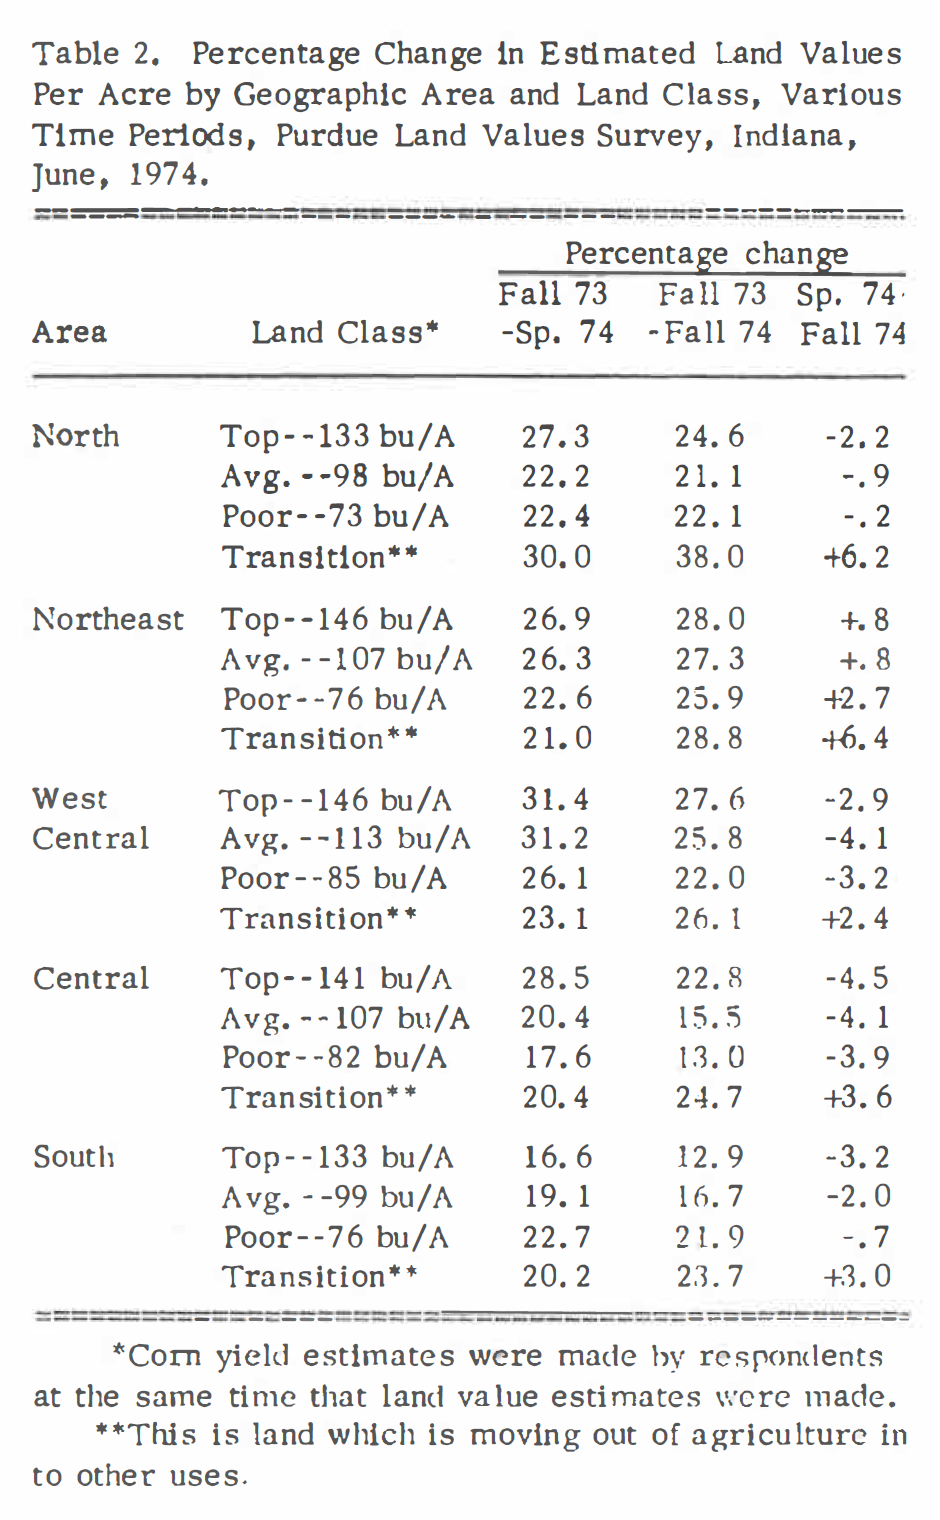
Table 2. Percentage Change in Estimated Land Values Per Acre by Geographic Area and Land Class, Various Time Periods, Purdue Land Values Survey, Indiana, June, 1974.
*Corn yield estimates were made by respondents at the same time that land value estimates were made.
**This is land which is moving out of agriculture into other uses.
What About the Longer-Term Picture?
In response to the question, “From current levels, where do you expect land prices to be in December, 19757”, the following replies were received:
- 42 percent predicted an increase.
- 29 percent predicted a decrease.
- 29 percent predicted no change.
The fact that nearly 3 out of 5 respondents expect stable to lower prices by the end of 1975 may be taken to mean that this group not only expects near-term weakness ln land values but they also are cautious with respect to the longer run. It should be remembered that opinions will be divided in a large group of people. Even last year, there likely were some of this group who would have predicted stable or lower prices but probably fewer than 3 out of 5.
Respondents were also asked to give their estimates of the annual average on farm corn price for the period 1975-80. The average for the entire group was $2. 19 per bushel. There was not much variation by areas, except that the Northeast was lower. Even at this level of expected corn prices, there is a strong feeling among this group of professionals that land values will level off or decline in the short run. Furthermore, a majority see this as a prospect for the period ending in December, 1975.
Implications
Not everyone will agree with the observations and judgment of this group. There is not full agreement within the group. Yet their professional workplaces them in close contact with the land market. Their judgment is telling us to exercise caution with regard to land investment.
Without large storage stocks of grain such as we had during the 60’s, we can expect greater fluctuations in both grain and livestock prices and consequently in farm incomes. Is it also likely that land prices may fluctuate more than they have in the past? The consequences of these greater fluctuations on liquidity, incomes and cash flows need careful analysis, especially by the purchaser of land who expects to make maximum use of credit.
Later Comments on the Above Article
Although it has been less than a month since the above report was written, we have had dramatic increases in prices of beans and corn. Crop prospects have worsened to the point that the situation can be viewed as serious in various areas of the state and nation. Even with immediate rains, production has been cut from earlier estimates. What is the impact on land prices of higher grain prices resulting from reduced production?
Given the tendency of a small crop to sell for more total money than a larger crop, we might expect land prices to be stronger than they otherwise would have been. On the other hand, the weather already has served to remind us of the cruel differences between expectation and realization. Many farmers are more weather conscious now than they have been since the fall of 1972 and may thus be looking more conservatively to the future than they did last fall and winter.
We must also consider the effects of uneven distribution of farm incomes. There are areas and individual farmers whose incomes will suffer. Some of these farmers may face cash flow problems, perhaps aggravated by payments on recent land purchases. Other areas and farmers who have reasonably good yields will realize exceptional returns. We may thus expect land price changes to be related to the geography of rainfall. Land values may be relatively strong this fall in areas where yields are fairly good but weak, maybe even declining, in other areas where yields are poor.
Grain price expectations for 1975 also will affect land prices, but it may be harvest time before reasonably firm expectations can be formulated. If, at that time, there appears a reasonable probability that the 1975 corn crop will sell around $3. 00 per bushel and beans at $7. 00, then land prices in the winter and spring could rise an average of 10 percent or more above present
(mid-summer) levels.
![]()
![]()
![]()
![]()
![]()
