Just How Important is the Food and Agricultural System in Indiana?
August 18, 1996
PAER-1996-3
David Broomhall, Extension Economist
![]()
![]()
![]()
![]()
![]()
Indiana has a long and rich heritage as a major food producing state. While technological change has improved yields and reduced the need for farm labor, consumers are demanding that more processing be done post-farm gate. These changes have had an impact on the structure of the food industry, as jobs and income generation have shifted from farming to food processing. These changes also have geo-graphic consequences, as food processors typically locate in urban areas while farm production remains in rural areas.
The purpose of this report is to measure the impact of the food system on the economy of Indiana, and particularly on rural counties. The report examines all levels of the food system from farm inputs to the grocery store shelf, including all spend-ing that is a direct or indirect result of the production of food. The report begins by looking at the manner in which income flows through an economy and is followed by a discussion of input-output models. The findings of an economic impact analysis of the food and agricultural system in Indiana are then presented.
The Multiplier Effect
Measuring the economic impact of the food industry on the economy of Indiana is not a simple matter. Income generation and spending within an economy is a complex activity. There are three distinct effects that occur as money flows through an economy: direct; indirect; and induced. Direct effects are those that benefit a business when it creates value in some product. For example, the farm sector benefits in a direct way when a farmer earns income by growing corn.
There are also indirect effects as a result of an increase in business activity. The farmer purchases inputs of seed, fertilizer, equipment, and business services to produce a crop, and the purchase of these inputs contribute to the economy as well. Indirect effects also occur when the output of an industry is used as an input to another industry to add value to a product.
Individuals involved in the pro-duction of a good earn income for their efforts. The spending of their earned income on goods and services for consumption creates additional income for others. The generation of income as a result of this spending is called induced effects.
The direct, indirect, and induced effects are incorporated into the multiplier effect. The multiplier effect is defined as the relationship between some initial change in an economy and the succeeding economic activity that is generated as a result of that initial change. An economic impact analysis is based on the concept of the multiplier effect and traces the spending that occurs as a result of some initial activity, in this case food production and distribution, throughout the economy. These effects can be estimated using an input-output model.
Input-Output Models and the Food System
There are various types of input-out-put models. Input-output models contain sets of equations describing the relationships that link the output of one industry with all other industries in an economy. The U.S. Forest Service has developed a comprehensive input-output model called IMPLAN, which divides an economy into 528 separate industries (Lindall and Olson, 1993). IMPLAN includes data at the county level for all counties in the United States, and these counties can be combined to form regions in any manner desired.
The food system is difficult to define, especially the farm component, because it includes a preponderance of sole proprietors, family laborers, unpaid labor, dual occupational workers, seasonal labor, contract labor, home-consumed products, and government programs that affect income. Since the farm component is linked to other components of the food industry in a backward direction (through the purchase of inputs) and a forward direction (through the sale of products for processing and distribution), it is easy to double count some of the values used. For example, the value of the output of a food processor has the value of the raw farm product imbedded in it. Counting the value of the farm output along with the value of the output of the food processor would count the value of the raw farm output twice. To portray accurately the impact of the food industry it is important to avoid double counting, and this study has gone to great lengths to avoid this problem.
For the purposes of this study, the food system is defined as:
- all farm output of crops and live-stock, including farm management services, and government payments,
- processing of the above products, including food, tobacco products, and alcoholic beverages,
- distribution activities including transportation, wholesale, and retail sales of food products, and
- related input sectors, including all production of goods and serv-ices for the farm, processing, and distribution activities above.
This definition is a system-wide definition, which means that all activities which add value to farm products are included, regardless of where the raw products originate.* Hence, the processing industry includes the value added to food products purchased from out-of-state producers as well as those from Indi-ana. Likewise, the distribution industry includes value added to food products produced out-of-state but distributed to Indiana consumers. The value of the out-of-state products themselves is not included, nor is the value added to Indiana farm products processed by out-of-state processors considered in this analysis. It is important to under-stand that this definition of the food industry likely differs from definitions of similar studies in other states. For this reason, the reader is advised to consider carefully how the industry is defined before making comparisons with results from other studies.
The impact analysis is conducted for both the state and a rural subset of the state which includes only those counties considered as being rural** (Figure 1). This was done because the economies of rural counties are generally less developed than urban counties, and hence may be more vulnerable to economic downturns in a specific industry, including agriculture.
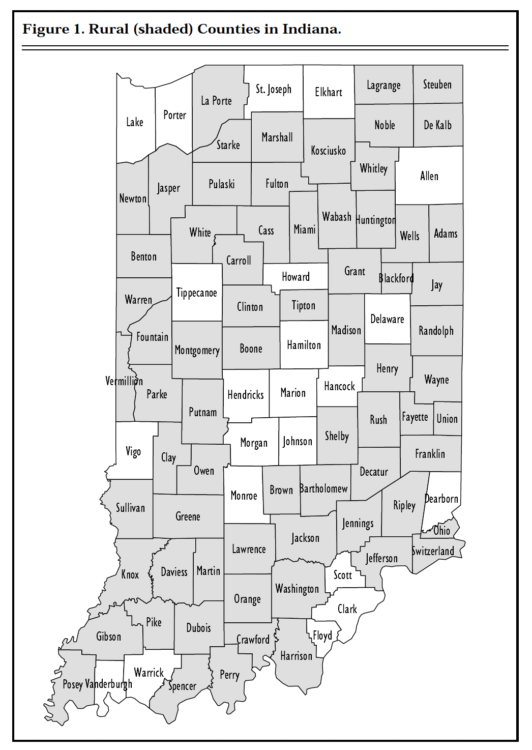
Figure 1. Rural (shaded) Counties in Indiana.
Impact Analysis of the Indiana Food System
IMPLAN divides the economy into 528 industries, but industries of similar characteristics can be aggregated to simplify the analysis and make presentation of the data and results clearer. The model used in this analysis divides the economy into 41 groups of industries. Table 1 list the impacts by sector. Sectors 1 through 9 are those related to agricultural production; sectors 10 through 15 represent the food processing industries; 16 and 17 represent grocery stores and places that serve prepared foods; 18 and 19 provide inputs primarily for agricultural production; and sectors 20 through 41 represent all other sec-tors in the economy. The results are presented in terms of value added, which refers to payments made by industries to workers, interest, prof-its, and indirect business taxes, and similar characteristics can be aggregated to simplify the analysis and make presentation of the data and results clearer. The model used in this analysis divides the economy into 41 groups of industries. Table 1 list the impacts by sector. Sectors 1 through 9 are those related to agricultural production; sectors 10 through 15 represent the food processing industries; 16 and 17 represent grocery stores and places that serve prepared foods; 18 and 19 provide inputs primarily for agricultural production; and sectors 20 through 41 represent all other sec-tors in the economy. The results are presented in terms of value added, which refers to payments made by industries to workers, interest, profits, and indirect business taxes, and employment.*** The estimates pro-vided by IMPLAN are considered conservative when compared to other input-output models (Johnson and Wade, 1994).
Table 1 shows the value added and employment effects for the entire state, and for the rural counties only. Seventy of the 92 counties in Indiana are considered rural. These 70 counties constitute 38 per-cent of the state’s population but 77 percent of the agricultural production. Urban areas have a larger share of value added in food processing, commanding 70 percent of the value added in those sectors combined. Hence it appears that rural areas produce the raw materials, but the processing tends to be in urban areas.
The entire food industry accounts for $16.7 billion in value added and over 548,000 jobs in Indiana. This translates to 13.3 percent of total value added to all goods and services in the state, and 17.3 percent of employment. In just the rural counties the agricultural and food system is somewhat more important, accounting for 16 percent of value added and 19.5 percent of employment. IMPLAN calculates employment as a proportion of income generated in an industry. Those industries which tend to have a greater portion of value added attributed to labor will have a higher jobs to value added ratio. For example, the portion of value added attributed to labor is particularly high in the Eating and Drinking Places industry. The ratio of employment to value added may be high in that industry because of a preponderance of low wage workers, which tends to reduce value added, and part-time workers, which tends to enlarge the employment figures. The farm pro-duction industries tend to have higher ratios of employment to value added, implying that much of the value added in agricultural production is attributed to labor. Service industries also typically derive a larger proportion of value from labor. In those industries which derive only a small portion of value added from labor, the ratio will be smaller. The Fats and Oils Processing industry, for example, is highly automated, using very little labor in the production process, and thus has a low ratio of employment to value added. Most manufacturing industries tend to have low ratios of employment to value added.
Summary
The results presented in this report show that, in 1992 dollars, the food and agricultural system contributes over $16.6 billion in income, or 13.3 percent of the state economy, and over 500,000 jobs, or 17.3 percent of total employment. Rural areas of the state are not that much more dependent on the food industry than the state as a whole, with 16.0 percent of value added and 19.5 percent of employment being attributed to the food and agricultural system. The primary difference between the food industry in rural and urban areas is that rural areas typically produce the raw agricultural product, while the processing and refining of these raw goods is performed in urban areas. Since agricultural commodity prices are generally determined by world markets, rural economies are likely to be more vulnerable to changes in world eco-nomic and crop conditions than urban economies. The value of the raw agricultural product represents only a portion of the value of the out-put of food processors, implying that changes in commodity prices will have less of an impact on prices in the food processing industry.
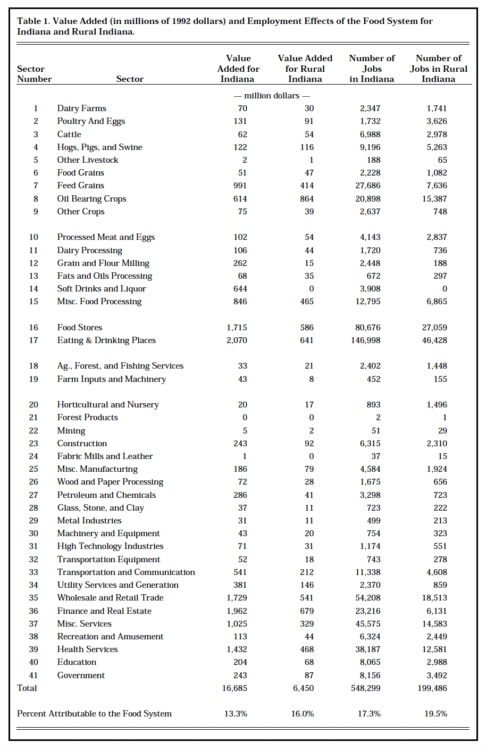
Table 1. Value Added (in millions of 1992 dollars) and Employment Effects of the Food System for Indiana and Rural Indiana.
The production of food has been, and continues to be, an important activity in the economy of Indiana. Changes in technology have allowed fewer and fewer people to produce more and more food, freeing up labor to participate in other sectors of the economy, fueling the economic growth that has occurred in the Indi-ana and U.S. economies for much of this century. It also helps provide American consumers with the lowest food prices of all industrialized countries, allowing us to use our income to purchase other goods and serv-ices, which raises our standard of living.
References
Indiana Agricultural Statistics Service. (1996) “Indiana Agricultural Statistics 1994-95.” Purdue University, West Lafayette, Indiana.
Johnson, Thomas G., and Ernest W. Wade. (1994) “The Economic Impact of the Agriculture Sector in Virginia.” Virginia Polytechnic Institute and State University, Blacksburg, Virginia.
Lindall, Scott, and Doug Olson. (1993) “Micro IMPLAN User’s Guide, Version 91-F.” Minnesota IMPLAN Group.
__________
* This definition excludes some industries such as gas stations that sell food items, school cafeteria workers, etc.
** The definition of “rural” and “urban” in this analysis differs from the terms
“metropolitan” and “nonmetropolitan” as used by the US. Census Bureau and the US Department of Agriculture. “Urban” in this analysis includes all counties with a population greater than 100,000, or those counties with a population greater than 50,000 and population density greater than 100 persons per square mile. Rural counties are defined as those counties that are not urban.
*** IMPLAN measures the number of jobs rather than full-time equivalency, which makes the employment figures in industries with higher proportions of part-time workers (e.g., food services) appear larger than in those with low proportions of part-time workers.
![]()
![]()
![]()
![]()
![]()
