Land Values and Cash Rents Decline
August 1, 1982
PAER-1982-1
Author: J.H. Atkinson, Professor of Agricultural Economics
![]()
![]()
![]()
![]()
![]()
Note: The charts in this article were taken from physical copy scans – as the original documents no longer exist. These versions are very blurry – we apologize in advance for the quality.
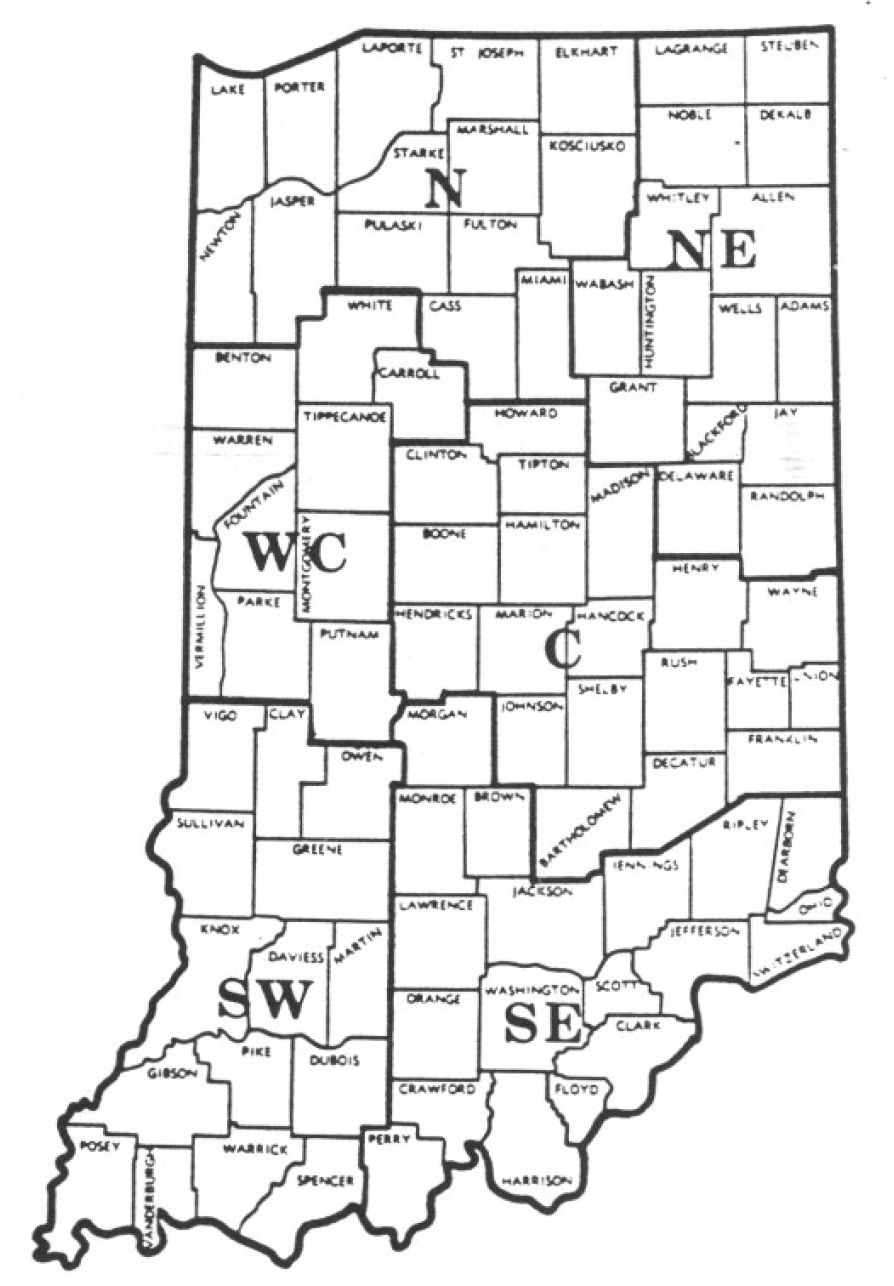
Figure I. Geographic areas used in the 1982 land value survey, Purdue University, July 1982.
The title of this article will not surprise most people concerned with Indiana agriculture. The fact that land values were declining became obvious early in the year and was confirmed in January by the Federal Reserve Bank of Chicago in a report indicating that Indiana land values dropped 5 percent from January 1981 to January 1982. Later in the spring, the USDA reported that Indiana land values had declined 13 percent from February 1, 1981 to April 1, 1982. The Purdue survey indicates that average land dropped 18 percent in the year ending June 1, 1982. The most recent Federal Reserve report shows Indiana land down 19.5 percent for the year ending July 1 (the report covers approximately the northern two-thirds of the state).
The 1982 land values survey was made possible by the cooperation of about 275 persons who are knowledgeable about land values and cash rents-operating and professional farm managers, appraisers. real estate agents and agricultural lenders representing banks, PCAs. the Federal Land Bank, FmHA and insurance companies. They reported on all but five counties in Indiana, giving their estimates of cash rent and market value for top, average. and poor tillable bare land. They also estimated the corn yield which they were expecting over the next several years for each class of land. In addition to farmland. the value of transition land-land moving into nonfarm use such as factory locations. housing and shopping centers-was also estimated.
The state was divided into six areas (Figure 1) based roughly on general soil associations. Within any area, land values in a specific county may vary considerably from the area average. For example. several counties in the northeastern part of the state suffered more yield reduction from last year’s wet spring than did other counties. It would not be surprising that, as a consequence, land values declined more in those counties than in others. Thus, in using estimates from the survey (especially dollar figures per acre) potential buyers and sellers should remember that nothing substitutes for good judgement and knowledge of one’s own local land market.
The report figures are useful guidelines. but the value of a specific farm must still be adjusted for buildings, non-tillable land, fertility, drainage, location, etc.
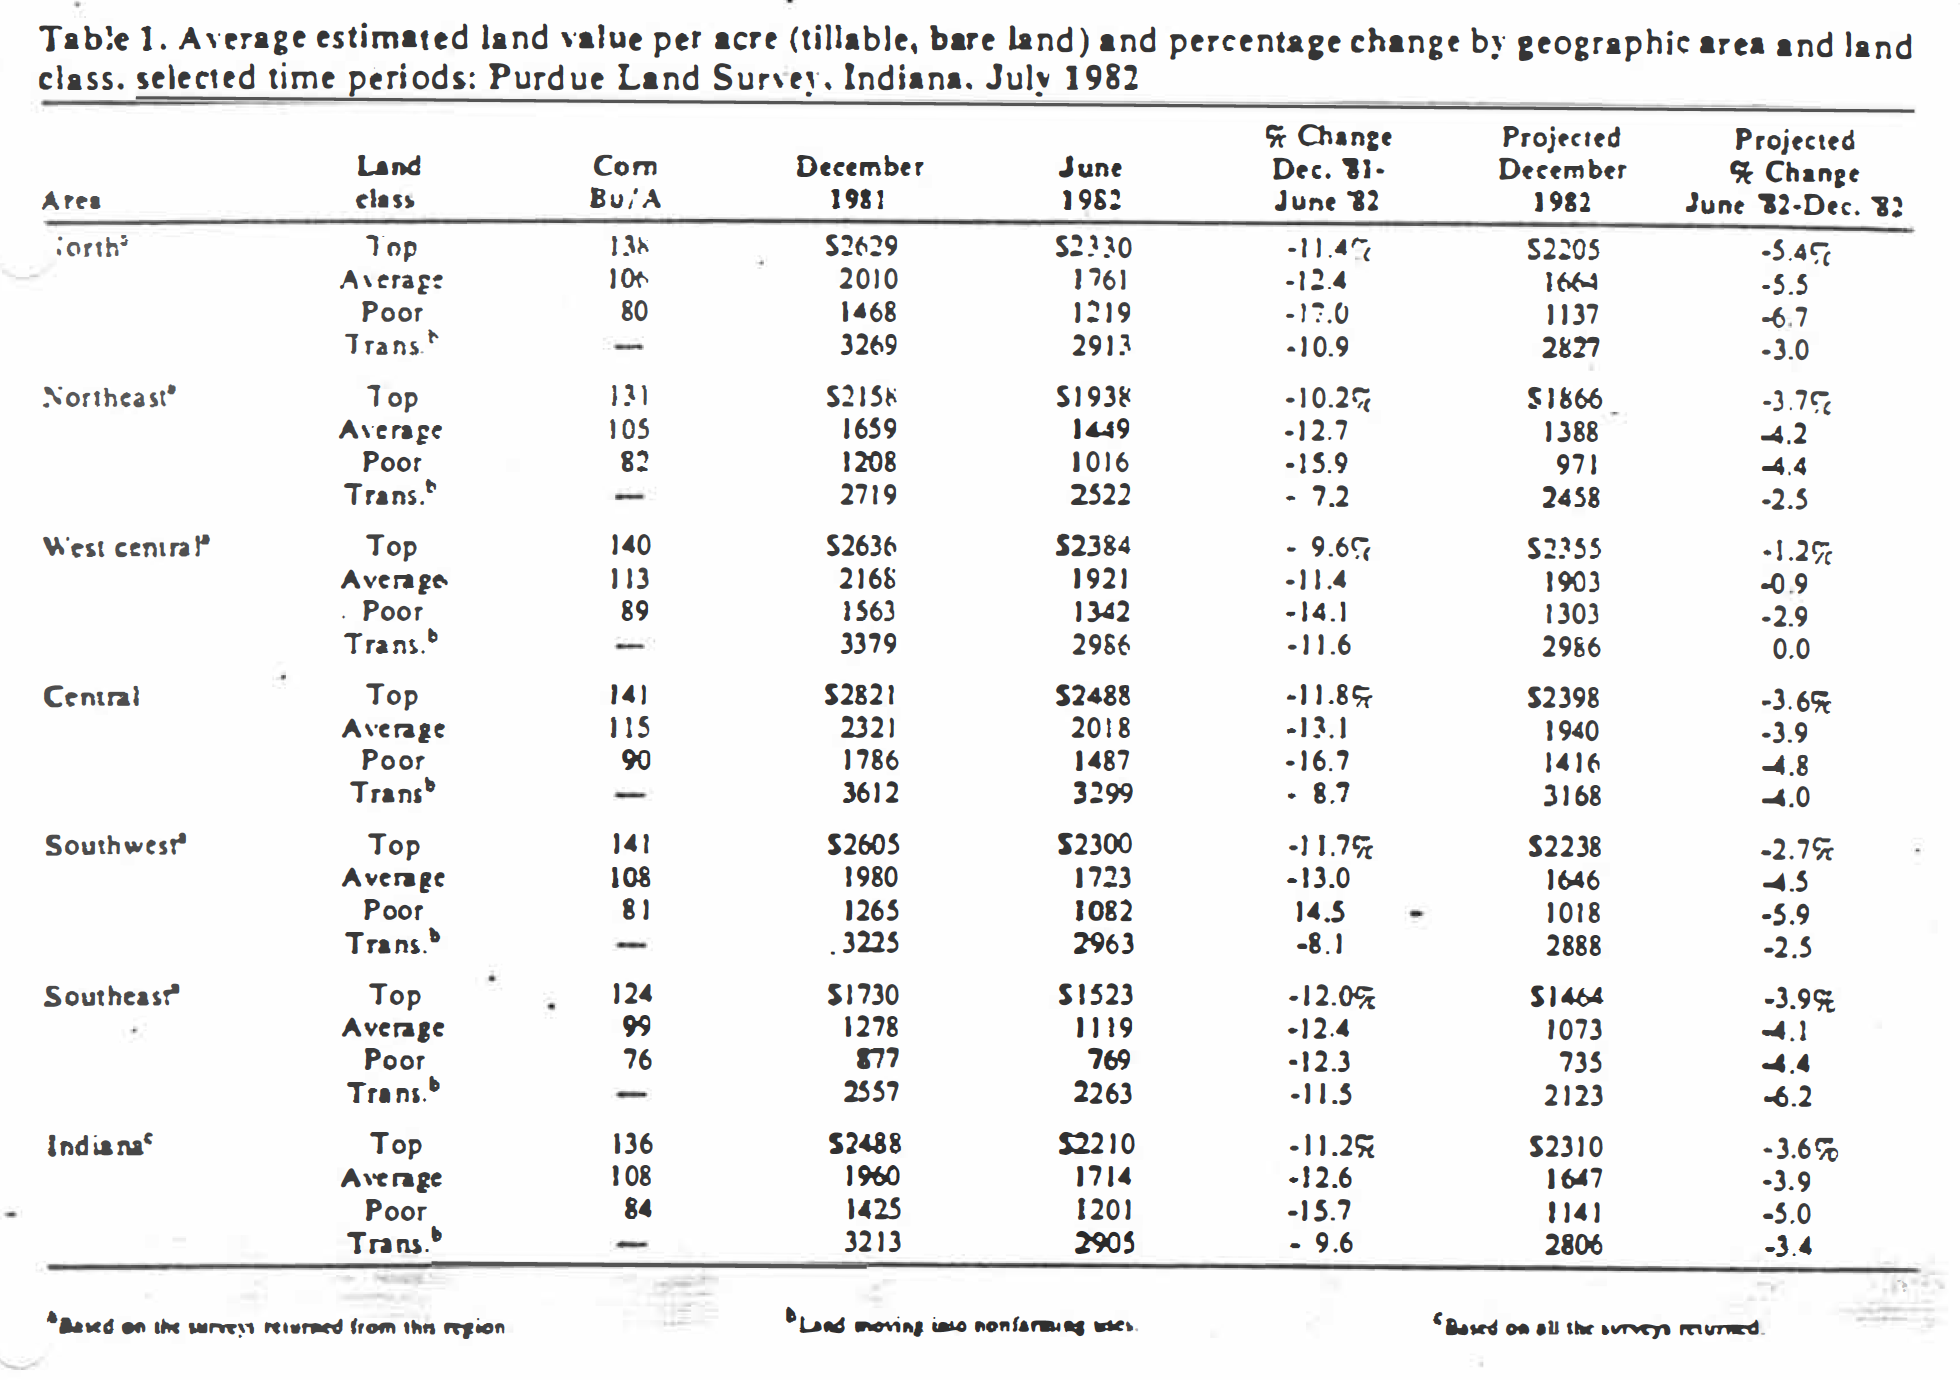
Table 1. Average estimated land value per acre (tillable, bare land) and percentage change by geographic area and land class, selected time periods; Purdue Land Survey, Indiana, July 1982
The Purdue survey provides estimates of changes in bare land values from December 1981 to June 1982, as well as the change for the year ending in June. Highlights of this year’s survey are as follows:
- Land values declined in every area of the state from December ’81 to June ‘82 (Table 1). Declines were about the same in all regions for top and average land (generally in the range of 10 to 13 percent). Statewide, the decline in average land was 12.6 percent. with an estimated value per acre of $1,714. The April USDA report estimated the value of Indiana’s farmland at $1,715 (land and buildings).
- Highest values per acre were in the central and west central areas, with top land reported at an average of nearly $2,500 per acre, down from around $2,900-$3,000 last year. Top land was valued at around $2,300 in the north and south west. ln all four of these areas. estimated yield potential was in the average range of 138-141 bushels. Top land in the northeast (131 bu/ A) and south east (124 bu/ A) was valued at $1,938 and $1,523 respectively.
- The drop in land values from December to June increased as land quality decreased in all areas except the southeast where the decline for all three land classes was about 12 percent.
- Declines for the year ending in June varied by areas of the state (Table 2). The northeast showed a whopping 25 percent decline in top land, 22 and 20 percent respectively for average and poor land. Spotty crop yields in this area may be the reason for this large decline; some fields were not even planted, and yields were low on others. In contrast, land values in the southeast declined relatively little, year-to-year; average land dropped less than 1 percent. In this area, as well as in the southwest, land values rose from June ’81 to December ’81, then declined. The declines in the southwest were only a little over half of the declines in areas to the north-10 to 11 percent. Declines in the north, west central and central areas were similar 15 to 19 percent on top land, 16 to 20 percent on average land and 20 to 26 percent on poor ground.
- Land values per bushel of average or typical corn yields (nor last year’s yield) dropped from last year high of $20 to $21 to $17 to $18. In the north. central and west central areas these per bushel figures on top and average land ranged from $16.61 to $17.65; in the northeast and southwest, roughly from $14 to $16; and $11 and $12 in the southeast. There was only about $1 difference between top and average land in the NE and SE and virtually no difference in the other areas (Table 3). In view of the fact that labor and machinery costs are about the same per acre: regardless of land quality, we conclude that greater differences in value per bushel could be justified economically. When land values were rising, the tendency may have been to think that top land was underpriced, but in these times of weak land prices, perhaps it is more appropriate to suggest that average land is overpriced! In any event, land buyers who have a choice of buying land of different yield potential should figure carefully with the objective of getting the best buy.
The survey also included questions on 1982 cash rent for bare land summarized as follows:
- Cash rents declined in the northern two-thirds of the state from 6.7 percent to 12.9 percent, depending on area and land quality, but actually increased in the two southern areas by around 5 to 6.5 percent on top and average land. Declines in the northeast and central areas on top and average were highest – about 11 percent to 13 percent (Table 4).
- Highest rents per acre of top land were in the west central area ($142), central ($135) and north ($127). Average per acre rent or top land in the northeast and southwest was the same $115 even though yield estimates were 131 bushels in the northeast and 141 in the southwest. In the southeast, the average rent on 124-bushel land was $96.
- In areas where rents declined, top land rent dropped slightly more than average land. Declines on poor land were sometimes higher and sometimes lower than the better land.
- Rent per bushel of estimated yield dropped from last year’s highs of around $1 to $1.10 to 90 cents to $1,00. In the southwest, the high was 82 cents and the southeast, 77 cents (Table 4) .
- In no area of the state was the difference between top and average land in rent per bushel more than 4 cents. In view of the fact that labor and field machinery costs are not much higher on higher yielding land than lower, a much greater difference could be justified economically-easily 10 cents or more. When farming profits were reasonably good and rents increasing, the tendency was to think that rents were too low on top land, but with present farming conditions, perhaps the rent on average and poor land is too high!
- Cash rents as a percentage of June land value increased to 5 to 6 percent from 4 to 5 percent last year, reflecting the more rapid decline in land values than in rents.
The final set of questions in the survey had to do with the future:
- On a state-wide basis. respondents felt that land prices will decline from June ’82 to December by 3.6. 3.9, and 5 percent for top, average and poor land, respectively. Smaller declines (1-3 percent) were expected in the west central area and greater (5-7 percent) in the north.
- The average farm price through 1987 for beans was predicted to be $7.28 per bushel: for corn, the figure was $3.16.
- The group expectation for the average farm mortgage interest rate was 13.7 percent, and inflation was expected to average 7.8 percent.
- About 83 percent of the respondents expected land prices to be higher in 5 years than at present. The average increase (including those who thought there would be no change and those expecting declines) was 17.8 percent. This amounts to only about 3 percent per year – far less than half occurred in recent years and below most years since the depression.
In conclusion, here are some personal opinions and comments:
- Indiana land prices probably peaked last year between summer and fall and currently are down by about 20 percent from those levels. Declines are more in some areas (e.g., the northeast) less in others. Reports of land being off a fourth to a third probably are true on individual tracts but are offset by other sales which were off less.
- In the current tough times, buyers and renters of land should figure carefully so as not to pay “too much” for average and lower quality land. The current cost-price outlook calls for careful analysis on land renting for as much as $1 per bushel of average yield. Even on high yielding land, there may not be much left for labor and fixed machinery costs at $1 per bushel for rent.
- Owners of cash rented land may be forced to make concessions in rental rates. This will be due in part to rents catching up with economic conditions which developed early this year and partly due to the gloomy current outlook.
- The land market probably will continue in the doldrums for the rest of the year – few sales and flat or slightly declining prices. Beyond then, the direction of land prices will depend upon such factors as the health of the general economy, interest rates, trade relations with Russia, crop prospects in Latin America and changes in hog numbers-factors which are hard to predict.
- Finally, a few notes of optimism – Land is still the favored investment for many farm and nonfarm people. It is held, generally, in strong financial hands: thus, large acreages are not likely to be dumped on the market even if there is some increase in forced sales. In spite of concern over the present recession, there is optimism about longer run prospects for the general economy and agriculture. Bumper crops will be harvested this fall in Indiana partly off-setting lower price. Profits from hog production are good and so is the outlook for the rest of the year. And the long-awaited tum-around in the economy, with lower interest rates, may be underway. Thus, there seems some reasonable chance that land prices may level off the last few months of this year somewhat below current levels. The stage could then be set for a turnaround next fall! But remember, this is personal opinion, and each reader must form his own!
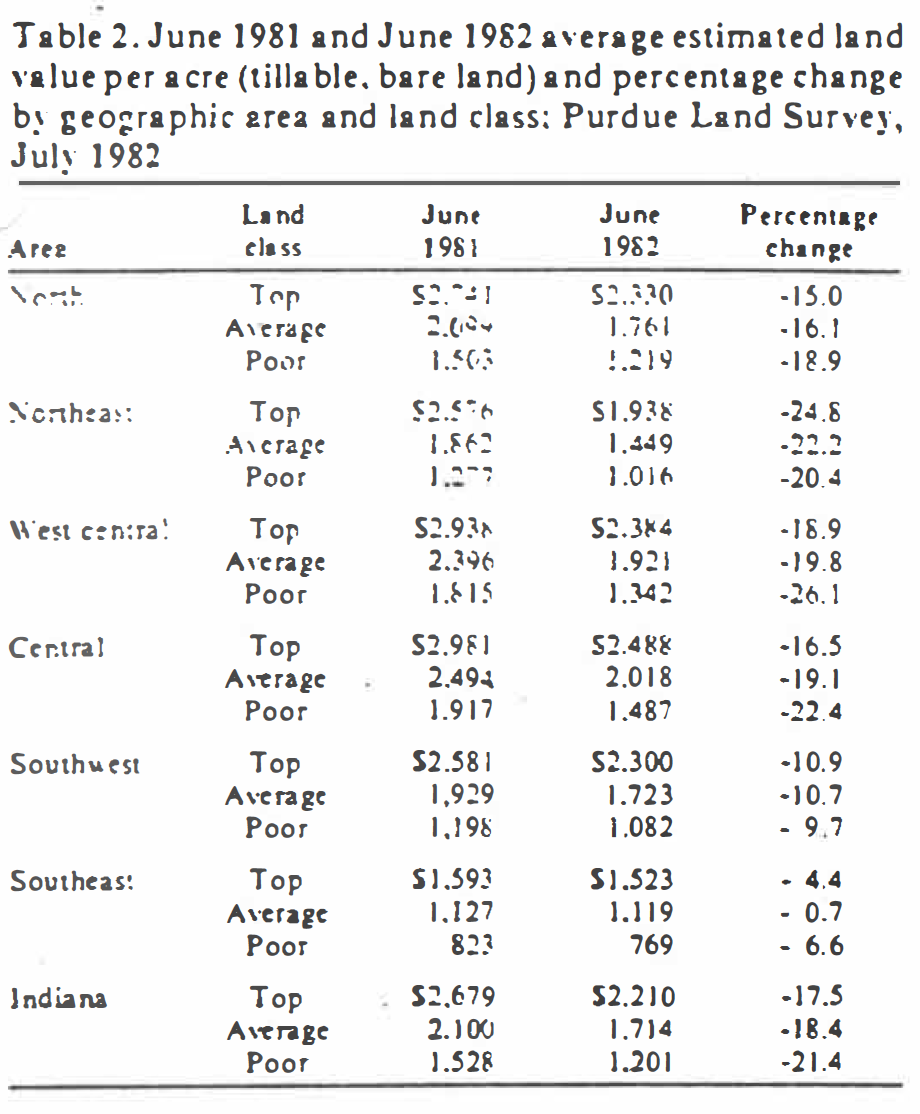
Table 2. June 1981 and June 1982 average estimated area land value per acre (tillable, bare land) and percentage change by geographic area and land class, Purdue Land Survey, July 1982
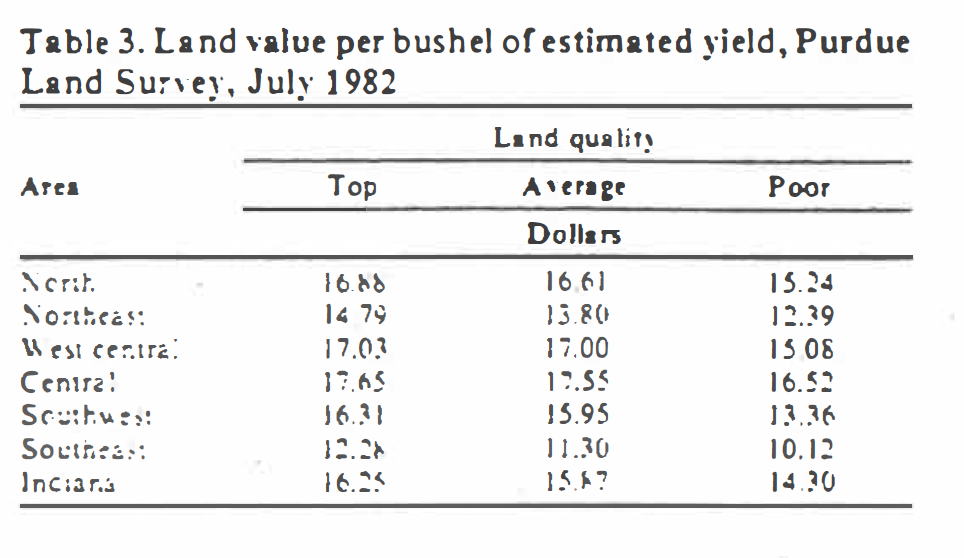
Table 3. Land value per bushel of estimated yield, Purdue Land Survey, 1982
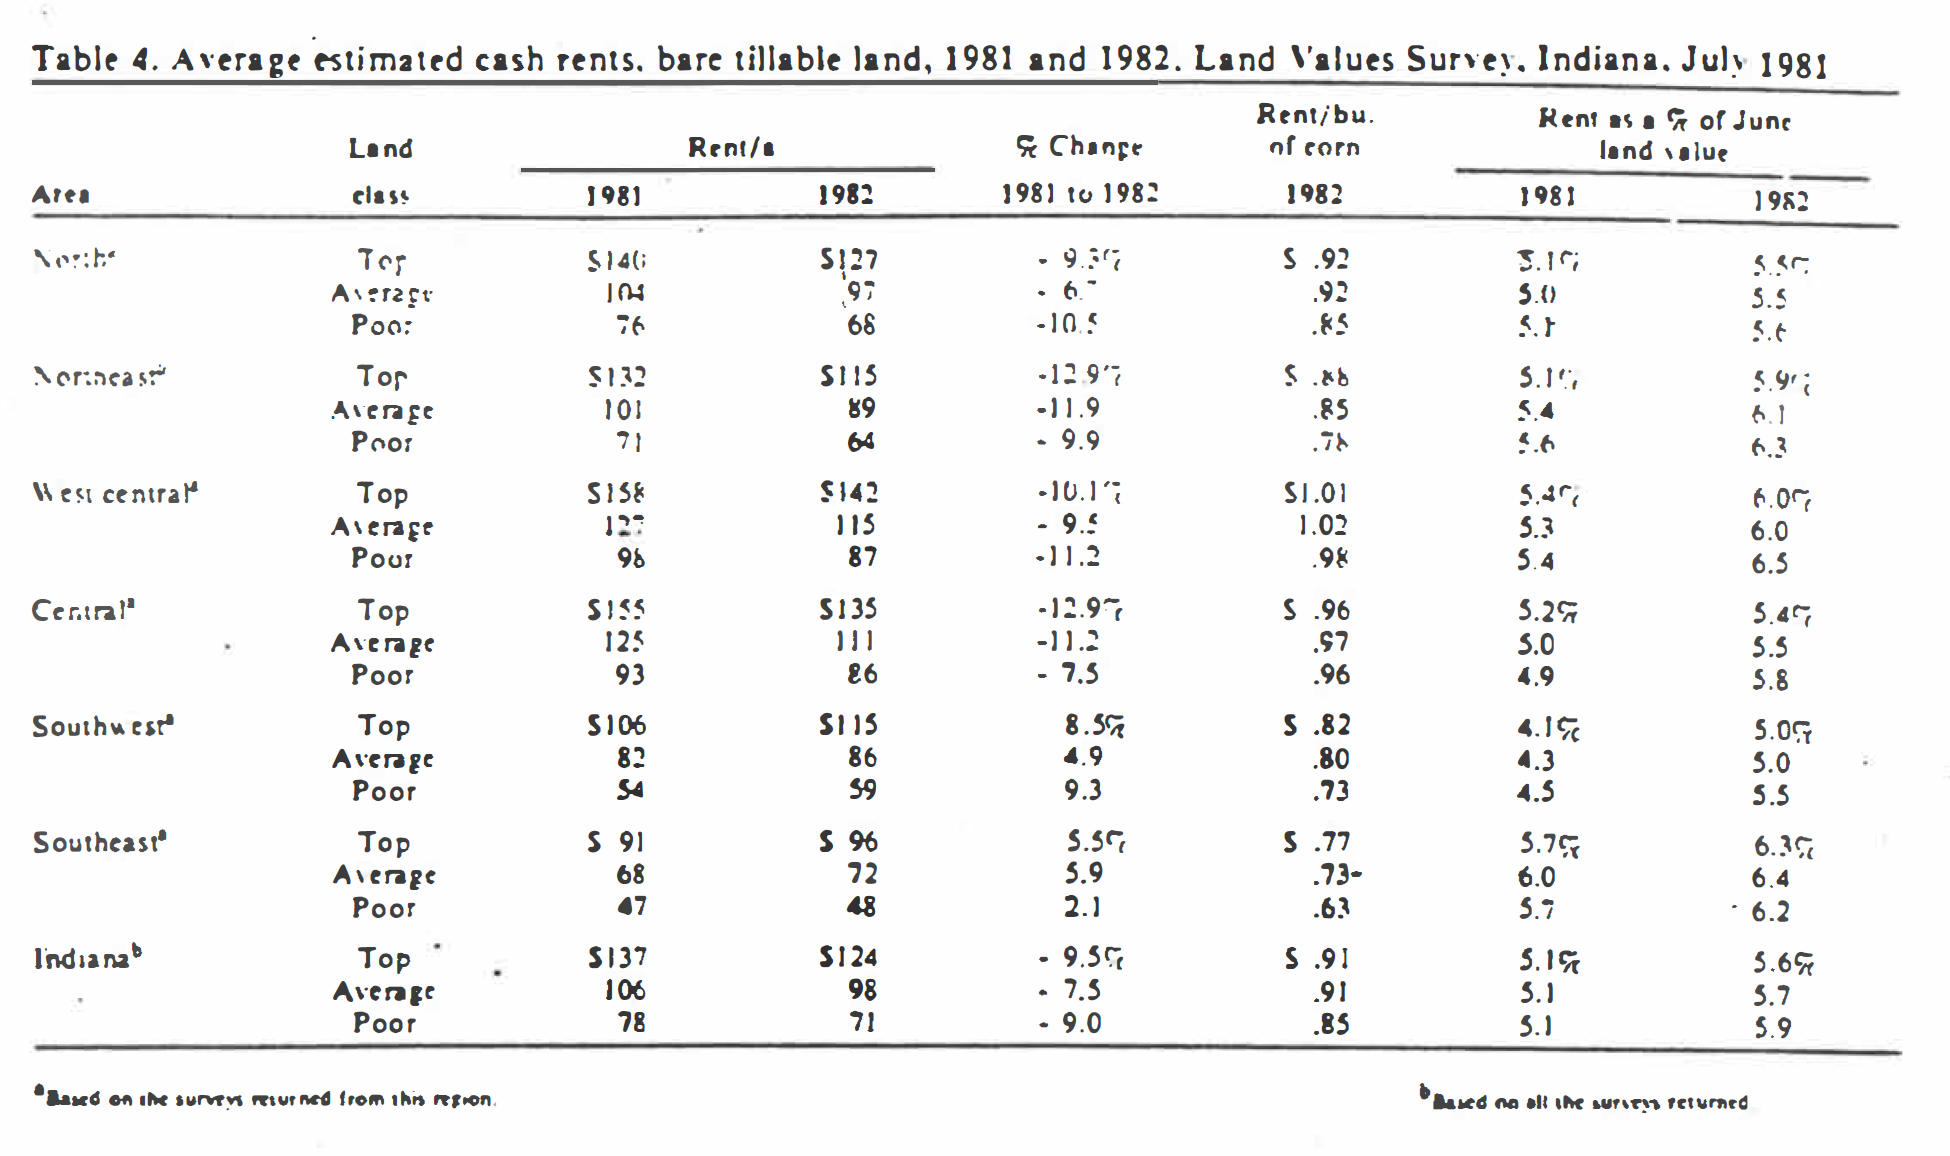
Table 4: Average estimated cash rents, bare tillable land, 1981 and 1982, Land Values Survey, Indiana, July 1982
![]()
![]()
![]()
![]()
![]()
