Land Values Continue to Increase
August 1, 1976
PAER-1976-1
Authors: J. H. Atkinson and Gary Van Hoozer, Agricultural Economics Department
![]()
![]()
![]()
![]()
![]()
For the fourth consecutive year, Indiana farm real estate values have increased sharply. This is according to estimates of 12.5 farm managers, lenders, appraisers and broken who were involved last year in about 2,500 loans and contracts, 200 farm sales and nearly 3,000 appraisals.
Respondents reported estimates of per acre values of top, average and poor farm land and for land moving into non-farm uses (transitional land). They also gave their estimates of average corn yields for the three classes of farm land. Replies came from six geographic areas (Figure 1).
GENERAL LEVEL OF LAND VALUES
On a statewide basis, top quality land estimated to yield 132 bushels of corn was reported to be valued at about $1600 per acre in the spring of 1976 (April-June). Average land (102 bu./acre) carried an estimate of about $1225 per acre, with poor land (78 bu./acre) about $900.
Spring 1976 top land values in Central and West Central Indiana were reported to average over $1900, followed by over $1600 in the North and Northeast, $1856 in the Southwest and $1168 in the Southeast. Com yields on top quality land in the Northwest and Central were estimated at around 140 bushels, or 6 to 12 bushels more than other areas, except the southeast where the difference was nearly 20 bushels per acre (Table 1).
Average land was estimated to yield about 30 bushels per acre less than top quality land and carried value discounts of $400 to $500, except in the two southern areas where the difference was about $300.
Land moving into non-agricultural uses was valued at $2300 to $2400 per acre in most areas, or $400 to $600 more than top quality land, except in the south where the difference was $700 to $1000. The differential between the, transitional land and good farm land has narrowed over the past year or so.
The highest bare land value was in the West Central area ($1847) followed by the Central area ($1822). Top quality bare land values in both Northern areas were around $1500, the Southwest average was $1336, and the Southeast was $1068 (Table 2).
Estimates for building values were highest in the North, Northeast and Central areas, with average per acre values for top and average land ranging from about $100 to $150. These averages were roughly $50 to $100 in the West Central and Southeast areas and under $25 per acre in the Southwest.
For several years, land of equal com producing potential baa had lower value estimates in the south than in other areas of the state. And this year was no exception. For example, 133-bushel per acre bare land in the Southwest was reported to be worth S160 per acre less than 128-bushel land in the Northeast. The difference was over $400 between 121-bushel land in the Southeast and 11-bushel land in the Central area.
Part of the difference may be due to smaller fields of uniform land in the south and higher costs for fertilizer and weed control. But the value differences are great enough to suggest that there may be better land buys in the southern part of the state than in other areas.
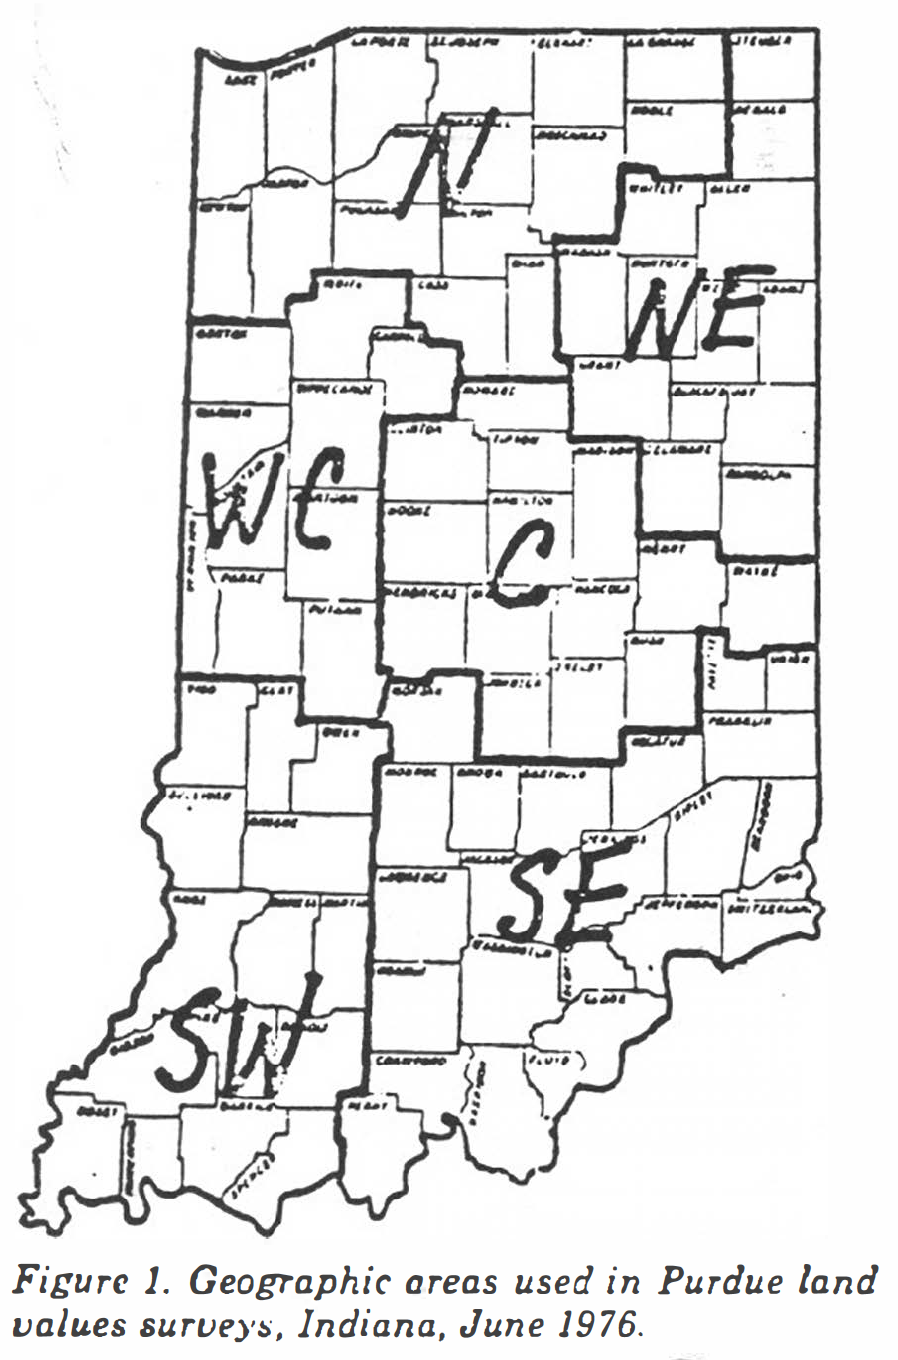
Figure 1. Geographic areas used in Purdue Land Values Surveys, Indiana, June 1976.
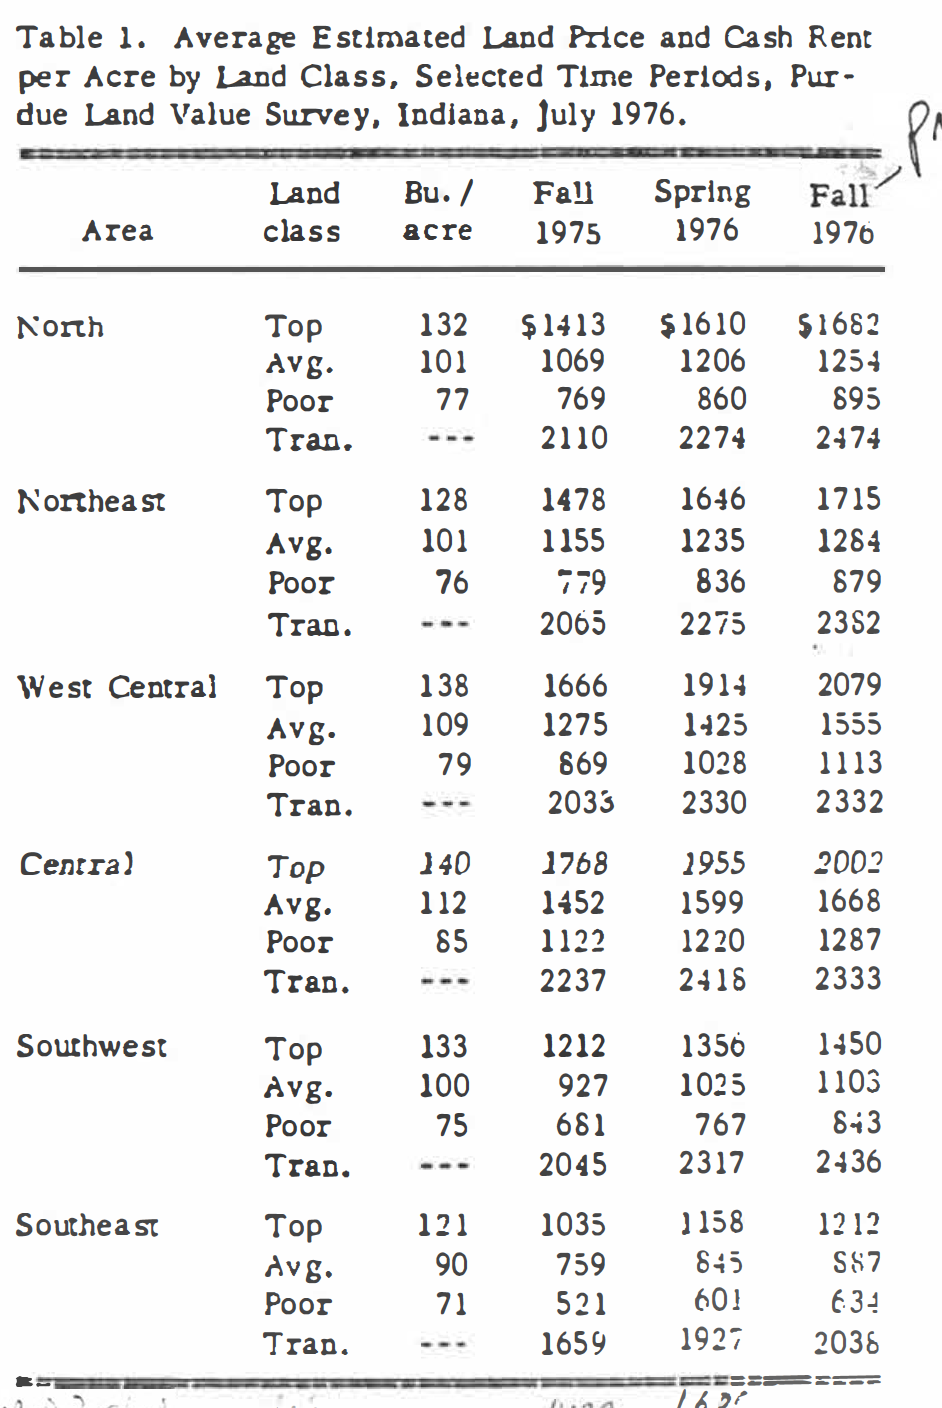
Table 1. Average Estimated Land Price and Cash Rent
per Acre by Land Class, Selected Time Periods, Purdue Land Value Survey, Indiana, July 1976.
PRICE INCREASES, FALL ‘75 TO SPRING ‘76
From last fall to the spring of 1976, the average increase in top land in Southwestern Indiana was reported to be $144, and in the Southeast $125 per acre. Good quality land in these areas went up by about $100 per acre. However, in the rest of the state, top quality land increased an average of around $200 per acre, and good land generally averaged an increase of $140-$150 per acre (Table 1).
In percentage terms, these average increases were generally in the range of 10 to 15 percent for all three classes of farm land in all areas of the state (Table 3). For the state as a whole, farm land values were reported to have increased an average of 12 or 13 percent from last fall to this spring.
By comparison, the Federal Reserve Bank of Chicago reported Indiana land value increases of
5 percent and 6 percent for the October-December and January-March quarters. USDA reported a 7 percent increase in Indiana farm real estate values for the quarter ending February 1. These figures are in line with the 6-month increase of 12· 13 percent reported by Indiana respondents – increases which are sharply higher than the 3-9 percent increases reported last year.
Transitional land averaged increases of 6 to 10 percent, well under the percentage increases for farm land.
These relatively large increases in land values followed a lull early last year in the upward spiral in land prices which started in late 1972. More money in the pockets of farmers probably was the single most important factor in this increase. Grain prices moved up sharply last summer
export because of western Corn Belt drouth and good export prospects. Hog prices and profits were generally good. Cattle prices were improved from previous low levels. Thus by Fall, Indiana farmers had realized good hog profits and harvested generally good crops, which sold for better prices than had been in prospect when they were planted.
Furthermore, many farmers had invested in new and bigger equipment capable of handing more acreage. In addition, there appeared to have been some increase in “nig money” (non-farm) interest in investment in farms, though this is hard to verify.
The net result of more available funds for investment by farmers and others, plus the push for farm enlargement was a substantial increase in land prices.
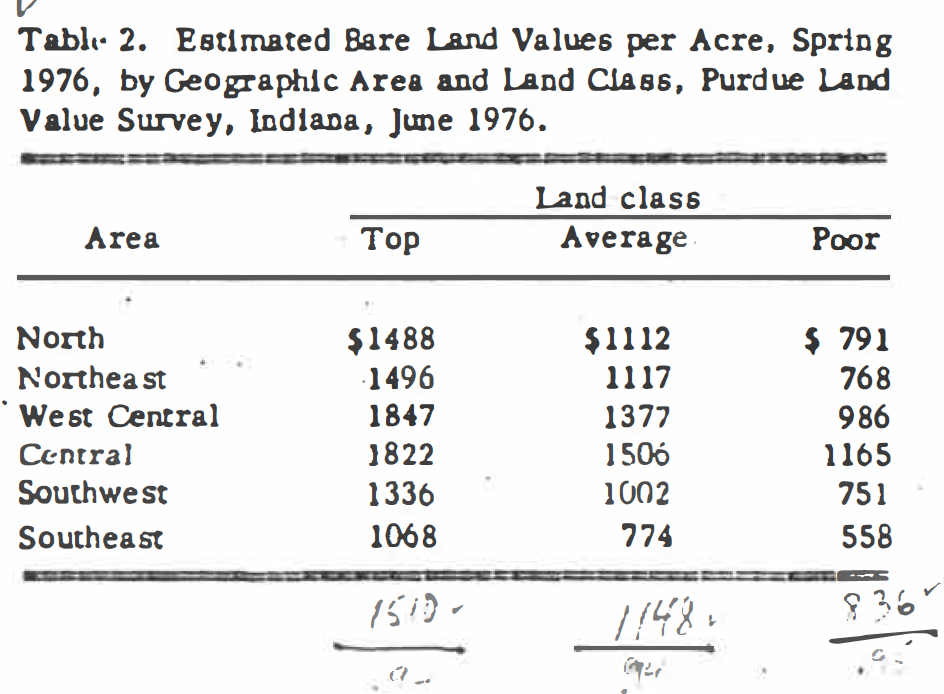
Table 2. Estimated Bare Land Values per Acre, Spring 1976, by Geographic Area and Land Class, Purdue Land Value Survey, Indiana, June 1976.
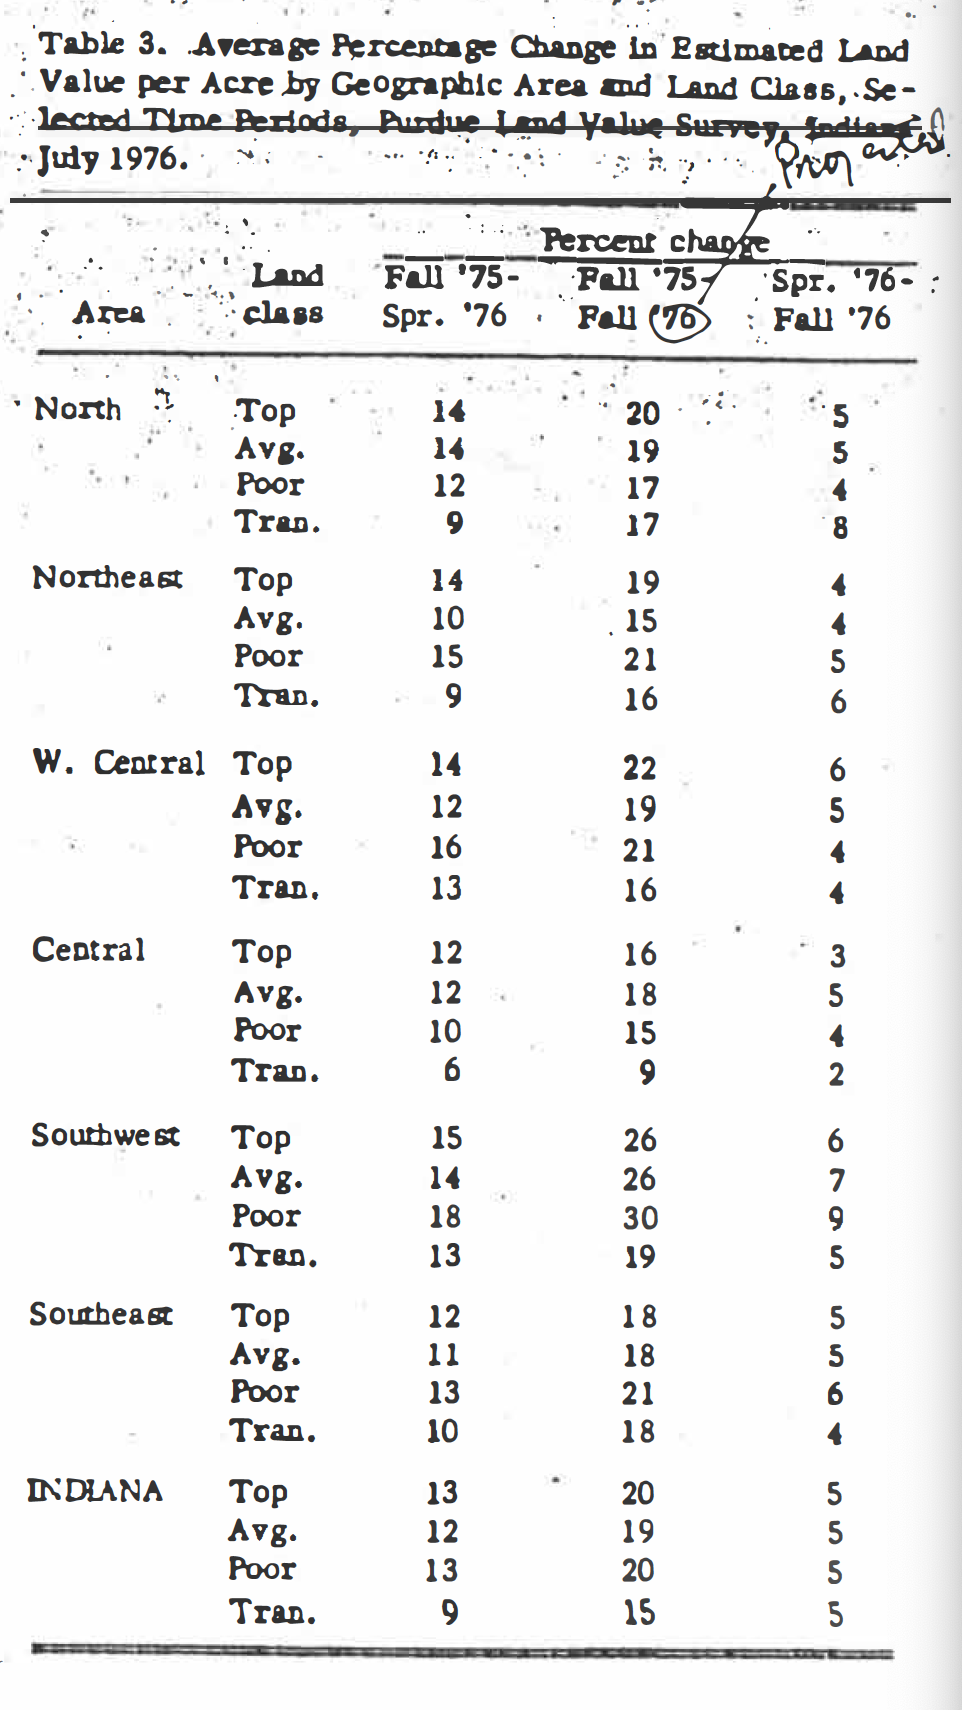
Table 3. Average percentage change in estimated land value per acre by geographic area and land class. Selected Time Periods, Purdue Land Value Survey, Indiana, June 1976.
WHERE DO THINGS GO FROM HERE?
At this time last year, it appeared the land boom might be fizzling out and this might have been the case had there been better weather conditions at home and abroad. In addition, the relatively low post harvest prices stimulated greater use of feed grains – a reminder that low prices are to some degree, self- corrective.
Again, we face the uncertainty of the size of crop to be harvested this fall, the magnitude of export demand and the 1trength of domestic demand. Changes in these factors could result in prices for the 1976 corn crop approaching $2 on the low side or being pushed toward the $3 level on the high side. Com prices of around $2 likely would dampen the enthusiasm of land buyers and halt or even reverse the upward trend in land prices, whereas $3 com probably would result in further gains in the price of land.
Survey respondents were asked to project land prices to the fall of this year. Statewide, they estimated a 5 percent increase from spring ’76 to fall ’76. By areas, the average estimates fell mostly in the 4-6 percent range.
This would mean nearly a $100-per-acre increase in the top land in the Central and West Central areas to a value of over $2,000. These estimates are more optimistic than they were last year when the average respondent looked for stable to slightly declining prices.
Looking further into the future, nearly all respondents expected land prices to be higher 5 years from now – by an average of 27 percent. This is less than a 5 percent per year compound increase and quite modest in contrast to increases since 1972. They are saying that they think it will take 5 years for land prices to increase about as much as they have in each of the past 3 years.
The annual average on-farm corn price expected by this group over the next 5 years was $2.69 per bushel, up from $2.49 last year and $2.19 in 1974.
WHAT DOES IT ALL MEAN?
Is land “too high”? lt does not appear to be if (a) long run com price expectations are for around $2.50 and (b) gradual increases in land prices are expected. Take $2000 per acre land yielding 140 bushels of com. Production costs under good management would be around $190 (excluding interest on land, but including $35 per acre for labor and management) and gross returns would be $350, leaving $160 per acre return to land. This would be 8 percent or somewhat less than the farm mortgage interest rate-pretty much in line with what has been the historical relationship between returns to land and mortgage interest rates.
Cash rents have run 6-8 percent of land values, and estimates obtained in this survey indicated 1976 cash rents averaged about 7.3 percent of fall 1975 top and average land values (except in the southeast where the figure was a little over 9 percent.) The implication is that returns to land, either to the owner-operator or to the cash rent landowner, are pretty much in line with what has occurred in the past.
There is much agreement among people interested in land that long run prices likely will trend upward, perhaps at a rate of around 5 percent per year. But even if this occurs, both buyers and sellers need to keep in mind that there may be year-to-year variations in the rate at which land prices increase.
One possibility is this: assume that the 1976 grain crop is in line with current expectations and that 1977 is an average or better crop year. By the end of 1977, grain prices could be well below current levels and profits from hog production much less favorable than at the present time. This likely would cause the bid price of land to fall, and volume of land sales probably would decrease. Land that had to be sold might bring less than it would have a year earlier.
The investor-buyer who plans to rent the land needs to budget carefully both average returns and cash flow. Returns likely will average less than the farm mortgage interest rate; therefore, the decision to purchase land may hinge on one’s expectations of long run increases in land values: If 70-80 percent of the purchase price is borrowed, there will be years when the landlord’s cash returns from the farm will not meet the payments.
Farm operators also need to budget carefully their expected returns and cash flow. As has been true for two decades or more, land for enlargement or as a base of operations often earns good returns. But for operators who have to borrow the maximum, this may be a 100d time to consider cash renting for a year or two to avoid the risk of cash flow problems.
Those in good financial condition or who have off-farm income are in a better position to weather a year of reduced farm income. If their longer run expectations are for gradually increasing land values, they probably should go ahead and purchase land of the type and location that fits their needs.
Clarification on the ”Land Values” Article in the August PFMR
by J. H. Atkinson and Gary Van Hoozer, Agricultural Economics Department
Several readers have called attention to the fact that the percentage changes in land values calculated from Table 1 of our August Purdue Farm Management Report on land values are not the same as the figures reported in Table 3. For example, West Central average land was
reported to be worth $1275 per acre in the fall of ? 9.75; and $1555 was the projected estimate for the fall of 1976, or an increase of 22 percent. But Table 3 reports a 19 percent change. Why the difference?
The figures in Table 3 were obtained by calculating the percentage change in land values as reported by each person, then averaging these changes. Not all respondents reported values for all time periods, but any estimates they made were included in the averages in Table 1. Thus, there might have been 25 persons who reported both fall ’75 and ’76 values, and 28 who reported spring but not fall estimates.
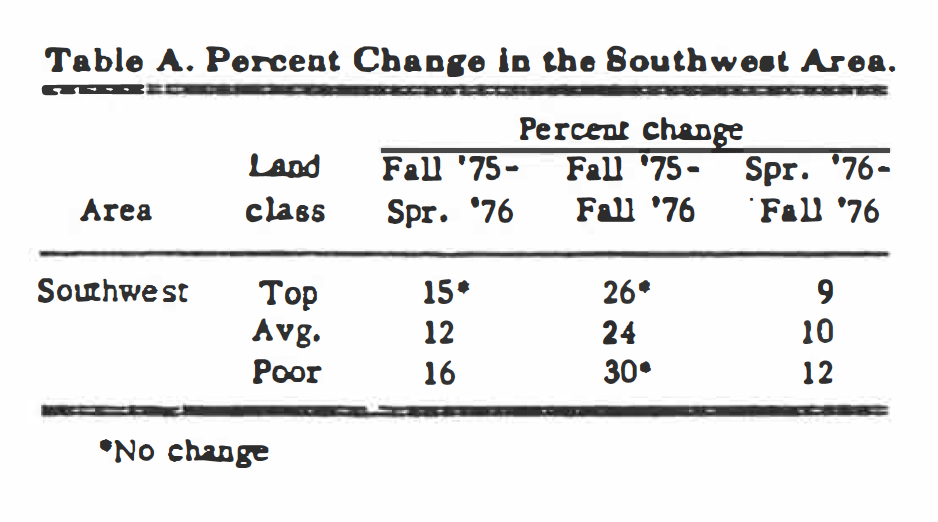
Table A. Percent change in the southwest area.
In addition, a lot of variation in the estimates from the Southwest area resulted in the percentage changes shown in Table A.
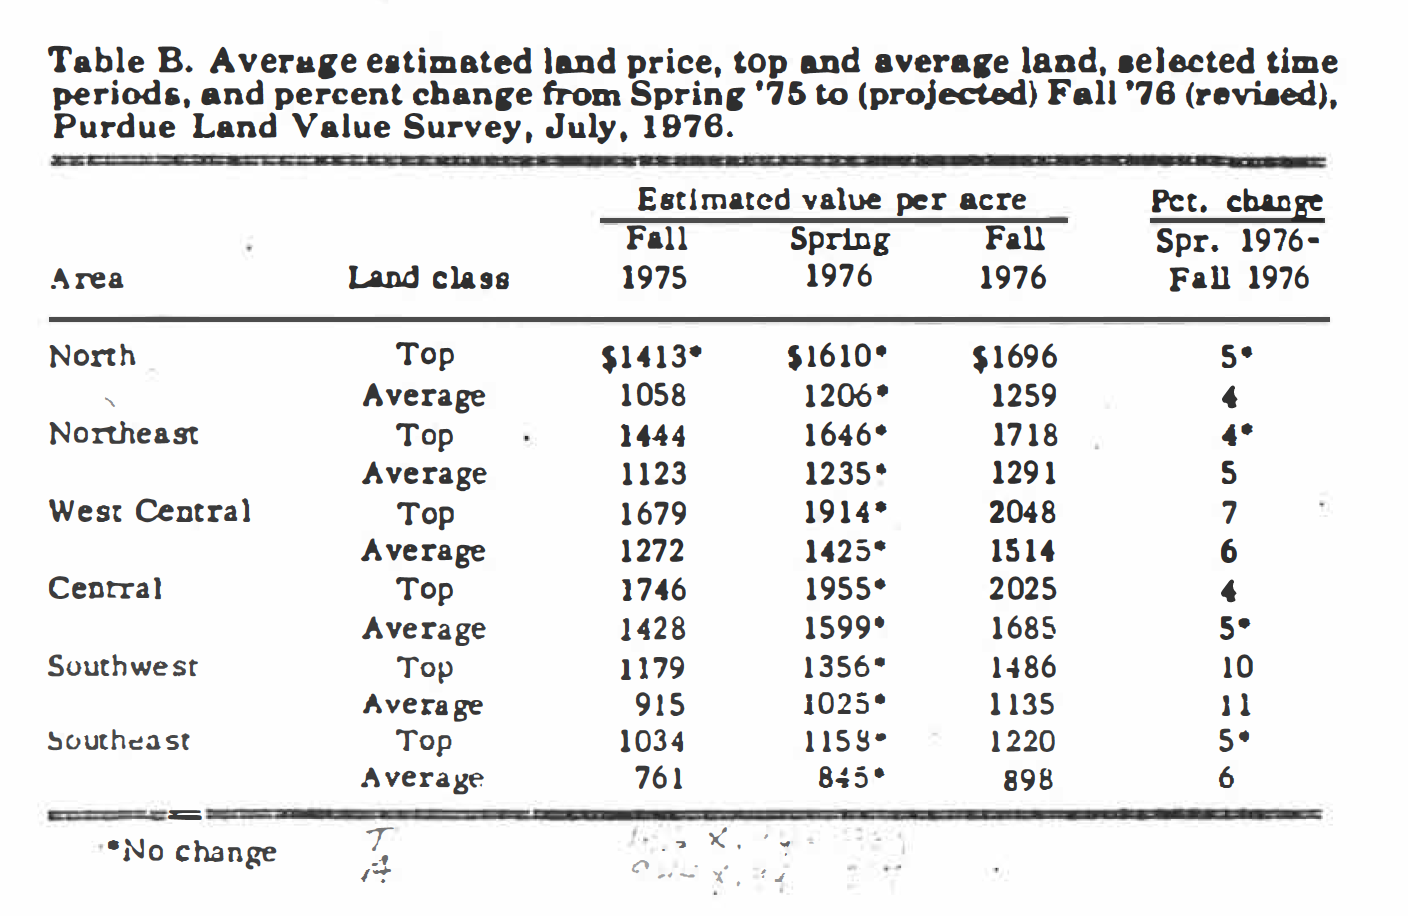
Table B. Average estimated land price, top and average land, selected time periods, and percent change from Spring ’76 to (projected) Fall ’76 (revised), Purdue Land Value Survey, July, 1976.
In order to make Tables 1 and 3 in the August Article approximately comparable, estimates of values for top and average were re-calculated and are presented in Table B here. (Due to wide variability and relatively small numbers of responses, we suggest you use estimates for poor and transitional land only as general guides).
The re-calculations were made adjusting the spring ’76 estimates back to fall ’76 by using the fall-to-spring percentage change shown in Table 3 of the original article. The fall ’75 estimate was then increased by the fall-to-fall percentage change (Table 3).
The results differed slightly from the figures in Table l of the August article – less than $15 per acre for half of the estimate, and a maximum of $41 per acre. Some of the percentage changes from 1pring ’76 to fall ’76 also changed by 1 percentage point as shown in the last column of the accompanying table.
![]()
![]()
![]()
![]()
![]()
