Land Values Increase, But at Slower Pace
August 1, 1990
PAER-1990-5
Authors: J.H. Atkinson, Professor and Kim Cook, Research Associate
![]()
![]()
![]()
![]()
![]()
Indiana cropland values peaked in 1981, according to the Purdue Land Values Survey, and by 1987 had declined by about 55 percent. The statewide estimate for the value of top land was about $2700 in 1981 and $1200 in 1987. Average quality land also peaked in 1981 at $2100 per acre and bottomed at $913 in 1987. Every year since then, land values have increased; however, the 6 percent increase the past year was only about half the increase from 1988 to 1989. Since 1987, Indiana land values have increased by about a third, according to the Purdue study.
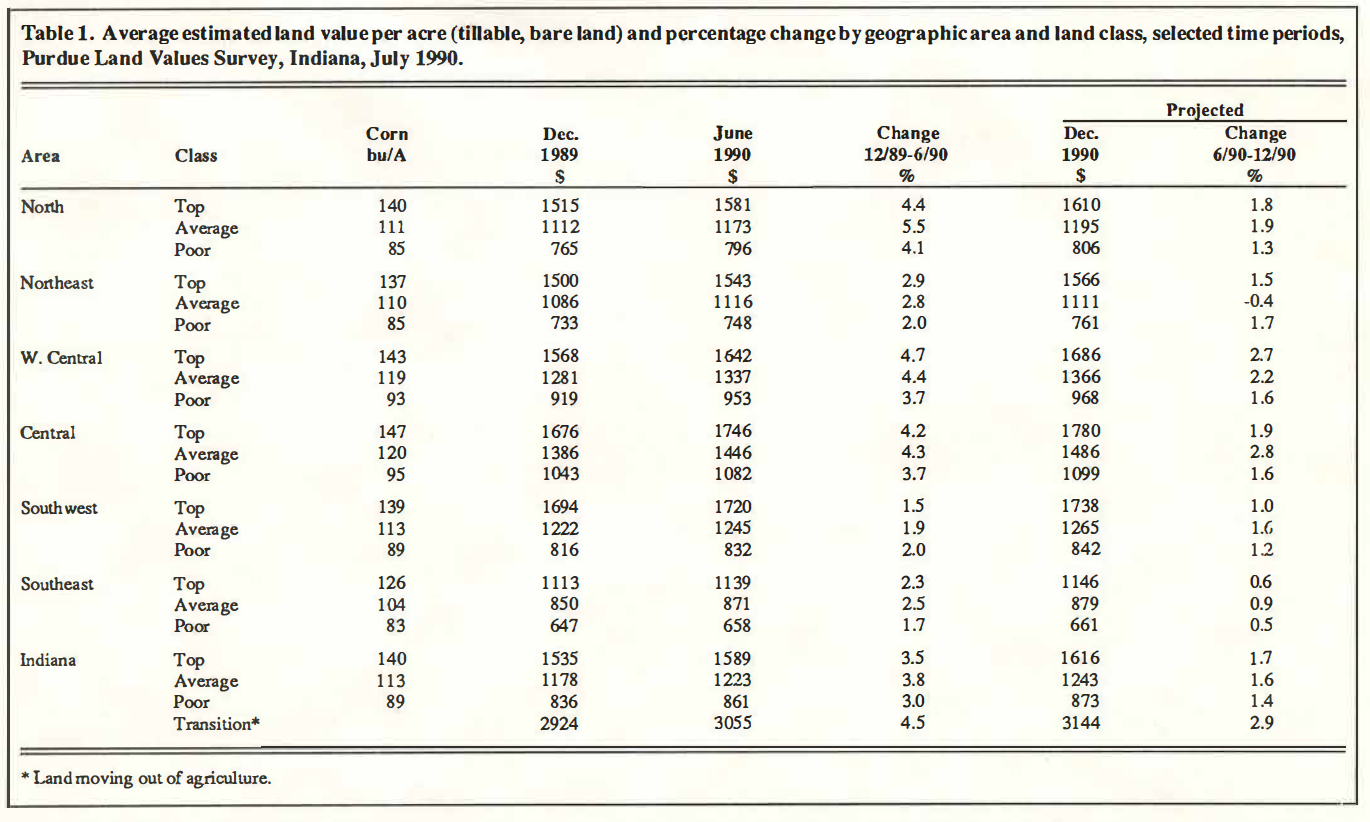
Table 1. Average estimated land value per acre (tillable, bare land) and percentage change by geographic area and land class, selected time periods, Purdue Land Values Survey, Indiana, July 1990.
Statewide Land Prices
The survey showed statewide average increases for the six months ending in June 1990 of 3.5 percent on top land, 3.8 percent on average land, and 3.0 percent on poor land (Table 1). These increases are less than were reported for the same period a year ago. Sixty-four percent of the respondents reported that most classes of land increased during the 6-month period, under 2 percent reported declines and about 34 percent felt there was no change in land values. Last year, a slightly higher percentage of the respondents indicated increases in land values and 30 percent thought they had been stable.
The statewide increase in value for the year ending in June 1990 was 4.7 percent on top land, 6 percent on average land, and 5.3 percent on poor land (Table 2). These increases are only about half the annual increases of the past two years.
Statewide, land with an estimated long term corn yield of 140 bushels per acre had an average estimated value of $1589 per acre (Table 1) or $11.35 per bushel (Table 3).
Average land (113 bushel yield) was valued at $1223 per acre, while the 89 bushel poor land was estimated to be worth $861 per acre. Land values per bushel of yield estimate were $10.82 on average land and $9.67 on poor land. These per bushel figures are $.43 higher than last year on top land, $.61 on average land and $.16 higher on poor land.
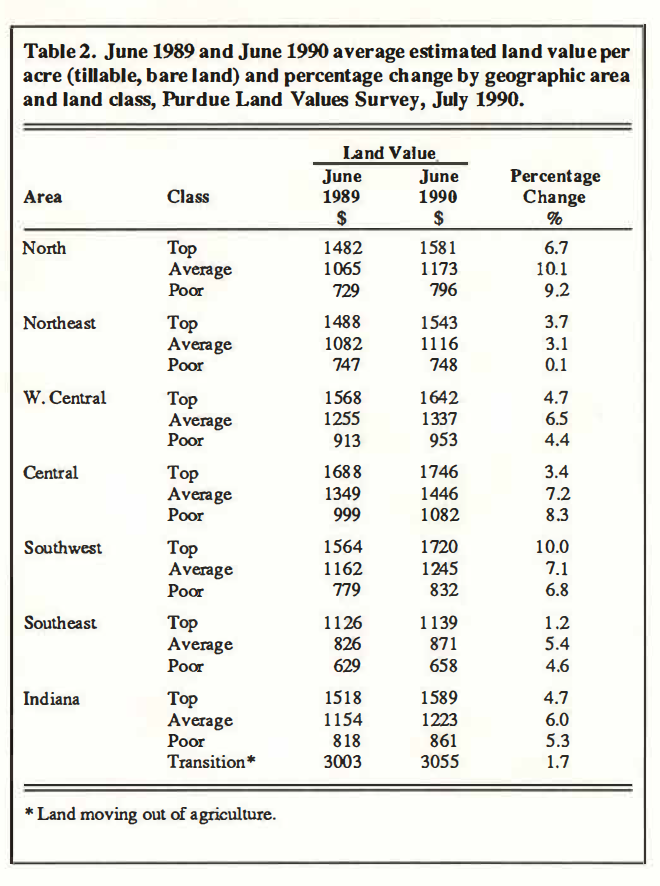
Table 2. June 1989 and June 1990 average estimated land value per acre (tillable, bare land) and percentage change by geographic area and land class, Purdue Land Values Survey, July 1990.
Transition land (that moving into nonfarm uses) was estimated to have a value of $3055 per acre in June 1990, up 4.5 percent for the six months ending in June (Table 1). The six-month change probably is a better indication of the strength in these land values than the 1.7 percent increase for the 12-month period (Table 2). Only 43 percent of the respondents report on transition land values, the range in estimates is quite wide and the reliability of the averages is not as good as with farmland.
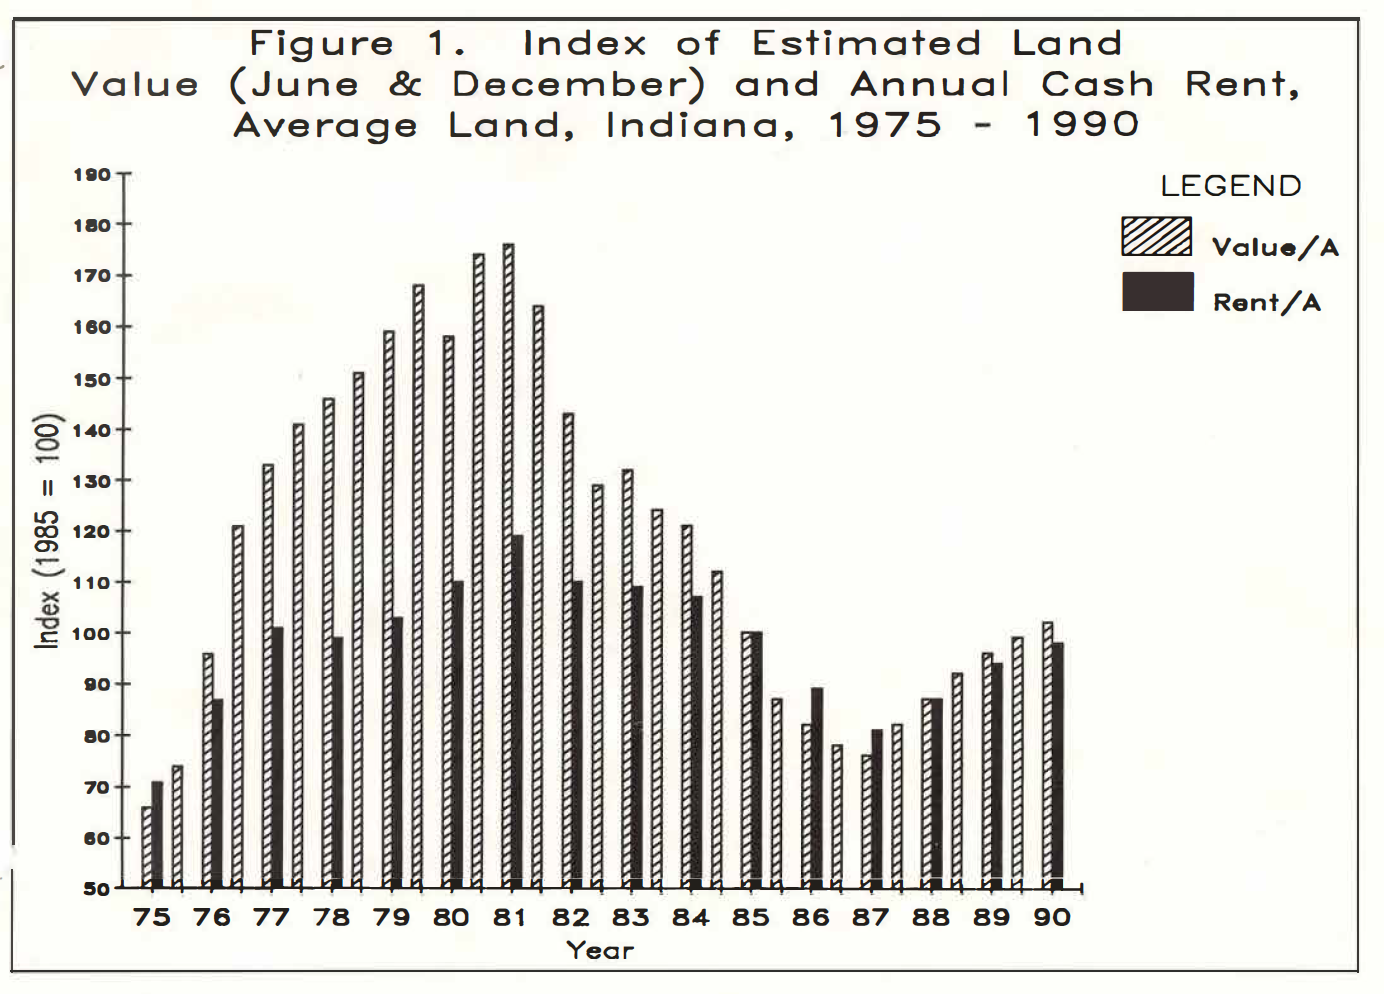
Figure 1. Index of Estimated Land Value (June & December) and Annual Cash Rent, Average Land, Indiana, 1975-1990
Statewide Rents Increase
Cash rents increased statewide from 1989 to 1990 by about 2 percent on top land, 3.6 percent on average land and a little over 3 percent on poor land (Table 4). The estimate for average land was $87 per acre, $3 more than last year’s estimate. Rent per bushel of estimated yield was $.77 for top and average land and $.04 per bushel less on poor land. Cash rent on average land in 1990 was 18 percent below 1981 level and nearly equal to the 1977 estimate (Figure 1).
Cash rent as a percent of estimated land value declined slightly for the third year in a row (Table 4). State average figures for 1990 are 6.8 percent for top land, 7.1 percent for average land, and 7.5 percent for poor quality land. Ten years ago, in 1979, following several years of big increases in land values the $88 rent reported for average cropland was only 4.8 percent of the estimated value of that quality land.
Area Estimates
Farmland value increases from December 1989 to June 1990 were mostly 4 percent to 5 percent in the north and the two central areas (Figure 2) and 2.9 percent or less in the northeast and the two southern areas (Table 1). These increases are slightly less than were reported for the December to June period last year.
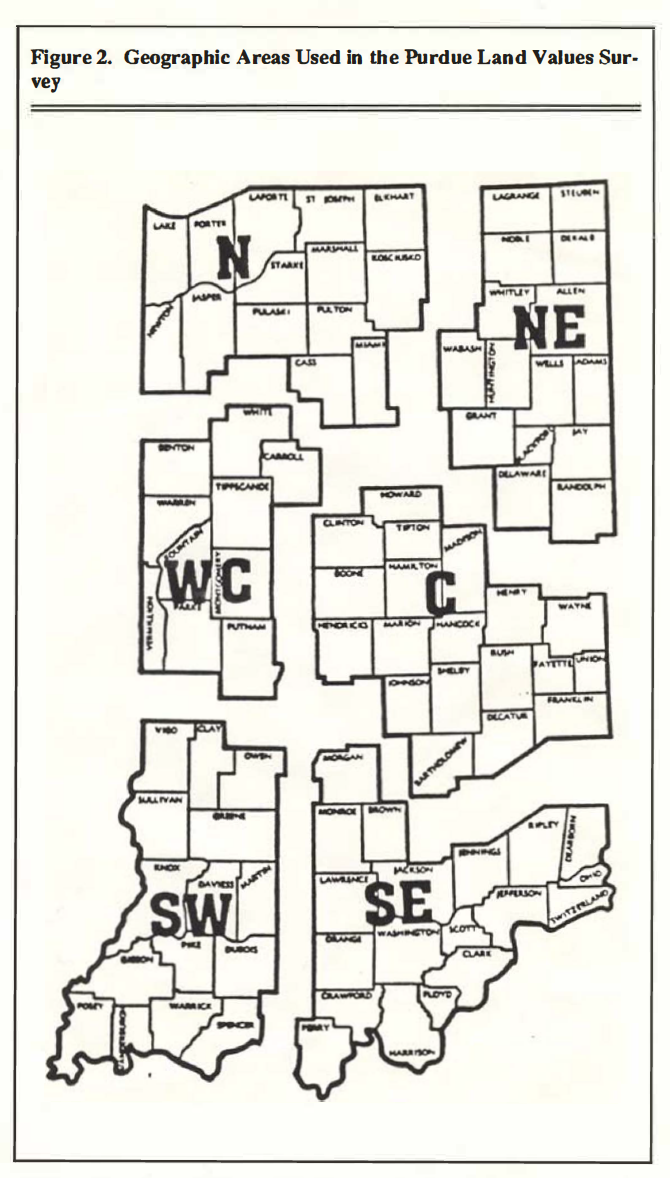
Figure 2. Geographic Areas Used in the Purdue Land Values Survey
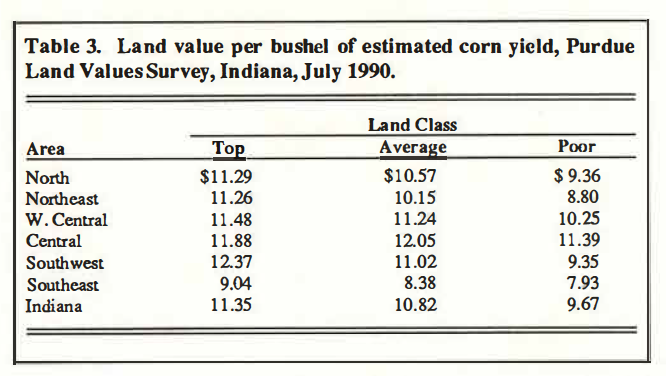
Table 3. Land value per bushel of estimated corn yield, Purdue Land Values Survey, Indiana, July 1990.
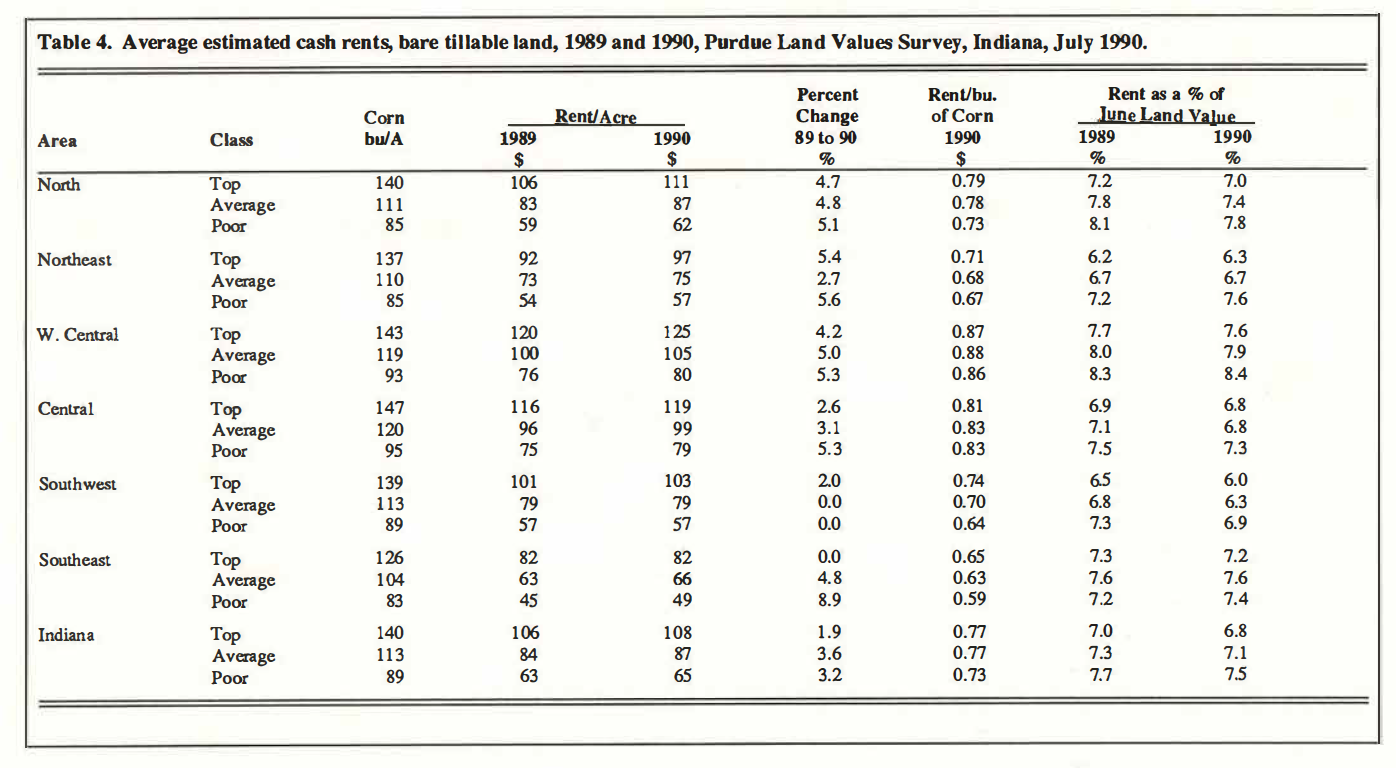
Table 4. Average estimated cash rents, bare tillable land, 1989 and 1990, Purdue Land Values Survey, Indiana, July 1990.
For the year ending June 1990, average land in the north was estimated to have increased 10.1 percent (Table 2). The smallest increase in average land, 3.1 percent, was in the northeast while increases averaged between 5 .4 percent and 7.2 percent in the other areas. Area increases for both top and poor land were more variable. Top land was up 10 percent for the year in the southwest and poor land increased 9 .2 percent in the northeast. Increases in other areas for these two classes of land ranged from under 1 percent to 8.3 percent.
The percentage increase from the low land values of 1987 has been greater in the southwest than in other areas, ranging from 42 percent to 45 percent for all classes of land. In the other areas, top land increased from 29 percent to 34 percent. This range, except the southwest, was greater for average land (29 percent to 37 percent) and poor land (30 percent to 40 percent) than for top land.
The central area, with an average of $1746 per acre for top land, again had the highest per acre values; however, values in the south west would be higher for land of the same yield potential. Top land value per bushel of estimated yield (Table 3) was $12.37 in the southwest and $11.88 in the central area. The southeast had the lowest value per bushel ($9 .04 for top land) as well as the lowest value per acre.
Because of the tendency for production costs per bushel to decline as land quality increases, it would be expected that land value per bushel would decrease as yield or land quality decreased. This was true except in the central area where the value per bushel for average land was slightly higher than for top land. The difference was slight in the west central area, suggesting that top quality land may, in many cases, be undervalued relative to lower quality land. Differences in costs per bushel by land quality were the greatest in the southwest.
Cash rents increased in all four of the central and northern areas of the state by $2 to $5 per acre or about 3 percent to 5.6 percent (Table 4). Average rents in the two southern areas were stable to higher.
Although land values were highest in the central area, cash rents were highest in the west central area, $125 per acre on top quality land or $.87 per bushel. In the north, west central and central areas rents on top and average land were $.78 to $.88. The range in other areas was $.63 to $.74 except for poor land in the southeast ($.59).
There was little difference in the rent per bushel on top and average land, although budget analysis indicates that a difference of $.10 per bushel or more could be justified in many situations between average and top quality land.
Cash rent as a percent of the value of top and average land tended to fall slightly in all areas except the northeast and southeast where there was a mixture of increases, decreases and no change. These area average percentages fell in the range of 6.0 percent to 8.4 percent with the higher figures being in the west central area and the lower ones in the southwest. For many years prior to the early 1970s, cash rent as a percent of Indiana land values generally fell in the range of 6 percent to 8 percent; however, by 1979 this percentage had fallen below five percent on a statewide basis. With falling land values, the percentage rose, peaking in 1986 with a state estimate of over 8 percent on average land. We are now back in the “thumb rule” range of 6 percent to 8 percent.
Outlook
There was little change from last year in expectations for short run increases in land values. About 62 percent expect some or all classes of land to increase, up from 58 percent last year. But the average amount of increase was smaller -1.6 percent for average land (Table 1) versus 2.7 percent last year. Only about 7 percent expected declines in some or all classes of land. Small increases of under 3 percent were expected in all areas of the state, with one exception: average land in the northeast was expected to decline, but by less than 1 percent.
Eighty-eight percent of the 1990 respondents expect land values to be higher five years hence. The group average change was 13 percent this year, down from 15 percent last year.
Respondents were asked to estimate annual average over the next five years for com and soybean prices, farm mortgage interest rates and the rate of inflation. The projections they made in each year since 1984 are shown below:
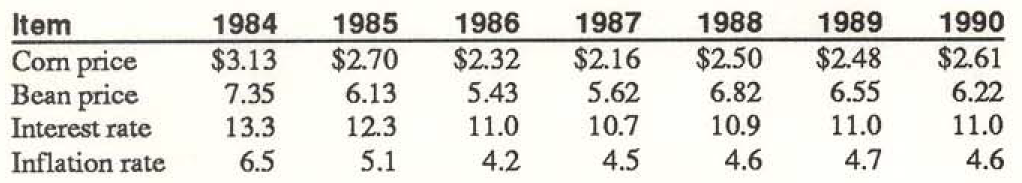
The expectations for higher com prices and lower bean prices probably were influenced by crop conditions in mid to late June. Interest rate expectations were the same as last year, breaking the slight upward trend of the previous two years. The three-year upward trend in inflation rate expectations was reversed.
Whether or not Indiana and other corn belt land values continue to increase the rest of this year and into 1991 depends upon such factors as the extent of crop losses in some areas due to excessive spring rains, and whether crop size and utilization projections indicate the likelihood of an increase in stocks to burdensome levels. The final form of the new farm bill could provide either a positive or negative effect on land values.
Over the longer run, positive influences include a growing world population, the relatively favorable ratio of debt to land assets, increasing demand for industrial uses of grain and the possibility of lower trade barriers. A cloud on the horizon is the possibility that little will be done about the Federal budget deficit with the result that interest rates will need to be kept high in order to finance the deficit. Land prices also would likely be influenced negatively if government farm program payments are reduced substantially or eliminated.
The land values survey was made possible by the cooperation of professional farm managers, appraisers, brokers, bankers, and persons representing the Farm Credit System, the Farmers Home Administration, ASCS county offices and insurance companies. Their daily work requires that they keep well-informed about land values and cash rent in Indiana. To these friends of Purdue and Indiana agriculture, sincere thanks are expressed. They provided more than 300 responses representing most of Indiana’s counties. Appreciation is also expressed to Julie Gable of the Department of Agricultural Economics for her help in conducting the survey and to Ag Econ professors Chris Hurt and Howard Doster for their review of this report and helpful suggestions.
![]()
![]()
![]()
![]()
![]()
