1994 Land Values Jump by 10 Percent
August 1, 1994
PAER-1994-05
H. Atkinson, Professor and Kim Cook, Research Assistant
![]()
![]()
![]()
![]()
![]()
After four years of hardly keeping up with inflation, Indiana cropland values jumped around 10% in the year ending in June 1994 according to the Purdue land values survey. The USDA reported a 7.8% increase for the year ending January 1. Likely causes of strength in the land market include low interest rates (affecting both borrowers and equity investors), generally good yields in Indiana in 1993, better than expected corn and soybean prices and institutional buying of land. Inflation concerns may also have caused additional buying.
According to the Purdue survey, this is the seventh consecutive year of increasing Indiana land values. Average quality land values are now 58% above the low levels of 1987 but still nearly a third below the high of 1981. The number of farmland transfers in the 6 months prior to June was estimated to be up by 41% of the respondents versus 30% last year. More land was thought to be on the market by 12% of the respondents compared to 7.5% last year. The com-bination of more transfers and slightly more land on the market tends to indicate that higher prices have pulled more land into the market.
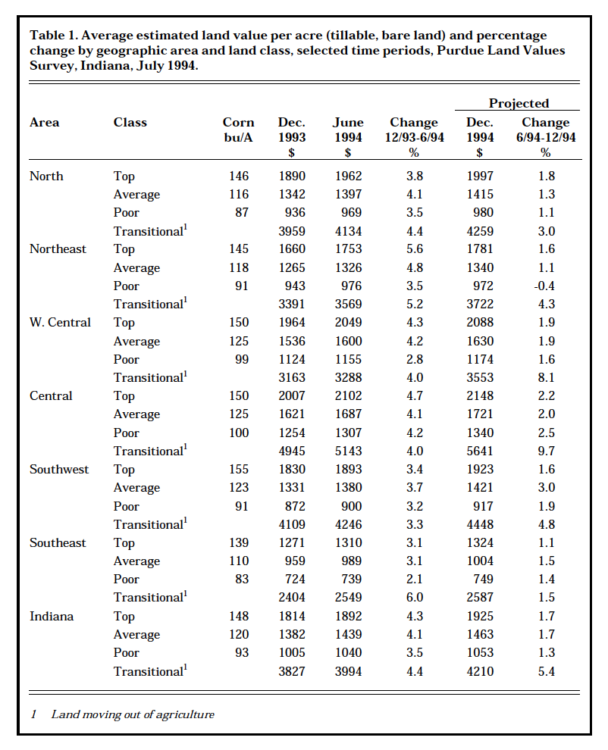
Table 1. Average estimated land value per acre (tillable, bare land) and percentage change by geographic area and land class, selected time periods, Purdue Land Values Survey, Indiana, July 1994
Statewide Land Prices
For the six months ending in June 1994, the value of average land was reported to have increased 4.1% -somewhat more for top land and a little less for poor quality land. Two-thirds of the respondents reported that some or all classes of land went up from December 1993 to June 1994, up from a little over half last year. Only seven people felt some or all classes of land fell during that period.
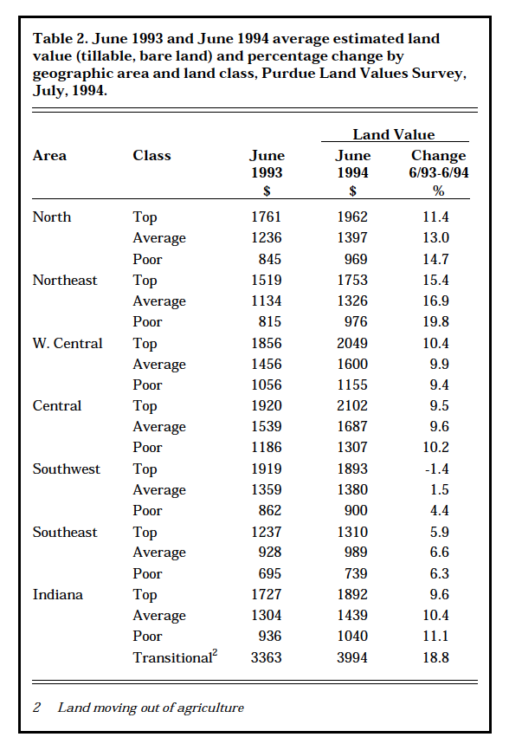
Table 2. June 1993 and June 1994 average estimated land value, (tillable, are land ) and percentage change by geographic area and land class, Purdue Land Values Survey, July 1994
Statewide 12 month increases in cropland values of 10 to 11% were more than double last year’s increases (Table 2). Land rated at 148 bushel corn yield was estimated to have a value of about $1900 per acre (Table 1) or around $13 per bushel. Average land (120 bushel corn yield rating) was valued at $1439 while the 93 bushel poor land was estimated to be worth $1040 per acre. Land values per bushel of yield rating were $12.78 on top land, $11.99 on average land, and $11.18 on poor land. These per-bushel figures are $.87 higher than last year on top land, $.95 higher on average land, and $.99 higher on poor land.
Transition land moving into non-farm uses increased 4.4% in the 6-month period ending in June to nearly $4000 per acre. This percent-age increase is about the same as reported for farmland but the 12-month increase, at 18.8%, was nearly double that of farmland (Table 2). Estimates for transitional land ranged from under $1000 to $17,000 per acre, thus the year-to-year change may not mean much. The 6 month change is based on estimates of the same persons, and therefore is likely to be more reliable.
Statewide Rents Rise 3 to 5 Percent
Cash rents increased statewide from 1993 to 1994 by $4 per acre on top land, $5 per acre on average land and $2 per acre on poor land (Table 4). These increases in percent-age terms represent increases of 3%to 5%. The estimated cash rent on aver-age land was $94 per acre, $118 on top land, and $71 on poor land. Rent per bushel of estimated yield was$.80 on top land, $.78 on average land, and $.76 on poor land. Cash rent on top land in 1994 was 14%below the record 1981 level.
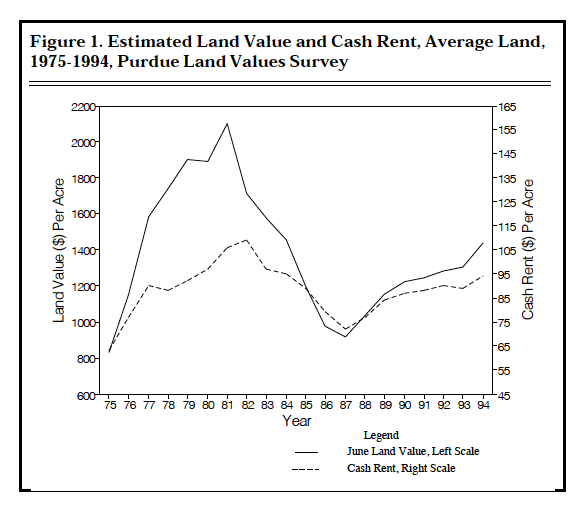
Figure 1. Estimated Land Value and Cash Rent, Average Land, 1975-1994, Purdue Land Values Survey
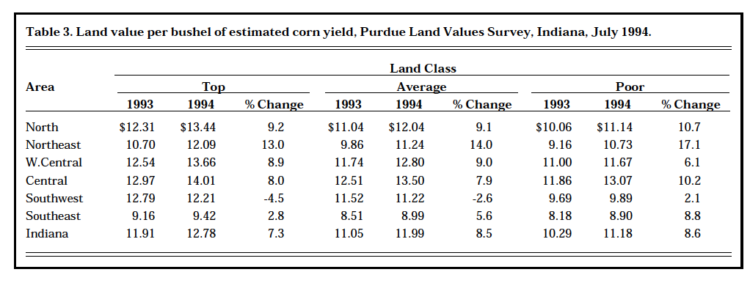
Table 3. Land value per bushel of estimated corn yield, Purdue Land Value Survey, Indiana, July 1994
Statewide, cash rent as a percentage of estimated land value declined a little for the second consecutive year. Average figures are 6.2% for top land 6.5% for average land, and 6.8% for poor-quality land (Table 4). These declining percentages are the result of greater increases in land values than in cash rents (Figure 1). This percentage on average land has varied over the past 20 years from 4.8 in 1979 to 8.1 in 1986. The recent tendency for land values to increase more than cash rents is not expected to continue.
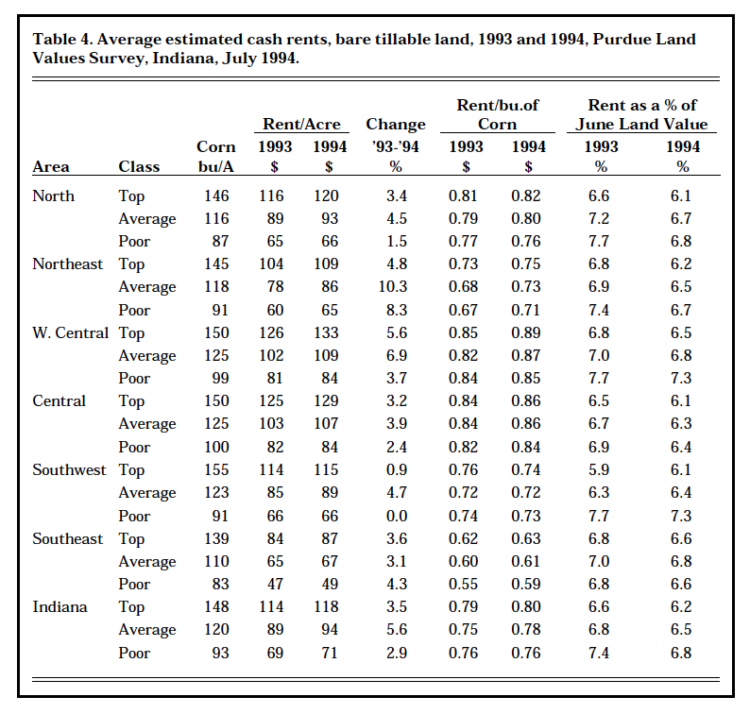
Table 4. Average estimated cash rents, bare tillable land, 1993 and 1994, Purdue Land Values Survey, Indiana, July 1994
Northern Areas had the Most Increase
Increases in the value of farmland by areas (Figure 2) from December 1993 to June 1994 generally fell in the narrow range of 3% to 5% (Table 1). Increases for poor land were less than for top and average land except in the central area. For the year ending in June 1994 the greatest increases in all classes of farmland were in the northeast (15% to 20%) followed by the north with 11% to 15% increases (Table 2). Increases of around 10% were reported in the central and west central areas. The only decline was on top land in the southwest, with small increases reported for top and average land in that area.
The highest valued top quality land was in the north, west central, central and southwest areas. These average estimates ranged from about $1900 to $2100 per acre although corn yield ratings ranged from 146 (north) to 155 bushels (southwest). Average quality values were similar in the central and west central areas ($1600 to $1687 per acre) but considerably lower in the north and southwest. Both of these areas have some land of excellent quality but in general land quality is lower than in the central and west central areas.
Land values per bushel of corn yield estimates (land value divided by bushels) on top land were in the range of about $13.50 to $14.00 in the north, west central and central areas (Table 3). Both top and average land values per bushel were similar in the northeast and south-west – a little over $12 on top land and $11.25 on land of average quality. Lowest values, around $9, were in the southeast. Land values per bushel tended to decline in all areas as land quality (corn yield estimates) declined. While these per bushel values have been increasing since 1987, they still are much lower than in 1981, the peak year of land values. For example, the per bushel estimate for average land in central Indi-ana was $21.50 in 1981, about $9.50 in 1987 and currently is about $13.50.
Except in the southeast and on top land in the southwest, cash rents increased by $4 to $8 per acre on top and average land and generally less on poor land (Table 4). The highest percentage increases were for aver-age land in the northeast (10.3%) and the west central area (6.9%).
Cash rents were highest in the west central and central areas – $133 per acre and $129 respectively for top land, $109 and $107 per acre for average land. Cash rent per bushel was also highest in these areas, ranging from 84¢ to 89¢. The per-bushel rent for top land was 82¢in the north, about 75¢ in the north-east and southwest, and 63¢ in the southeast. These rates declined by a few cents per bushel as land quality declined.
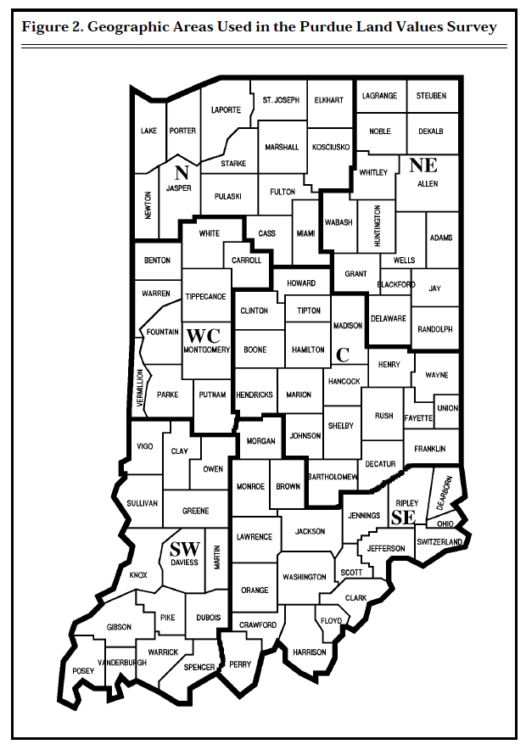
Figure 2. Geographic Areas Used in The Purdue Land Values Survey
Cash rent as a percentage of land value declined again except for a slight increase on top land in the southwest. This rate of return was mostly in the range of 6.1% to 6.9%in all areas. There was some tendency for the rate to increase as land quality declined.
Respondentsʼ Outlook
This is the third year in which respondents have become a little more optimistic that farmland values would rise by year-end. Fifty-two percent expect some or all classes of land to increase, up from 43% last year and a fourth in 1992. Only 6% of the respondents expect a decline in values while 40% expect no change. The average expected increase was small in all areas of the state – mostly under 2.5% (Table 1). If this rate of increase occurred and continued through the first half of 1995, the annual rate of increase would be only half of the 1993-94 rate.
Respondents were also more optimistic about the longer run (5 year) outlook for land values, with 88%expecting increases, up from 79%last year. Ten percent expected no change and 2% expected declines. The modest average increase of 9.5%over the five years compares with 7.4% last year.
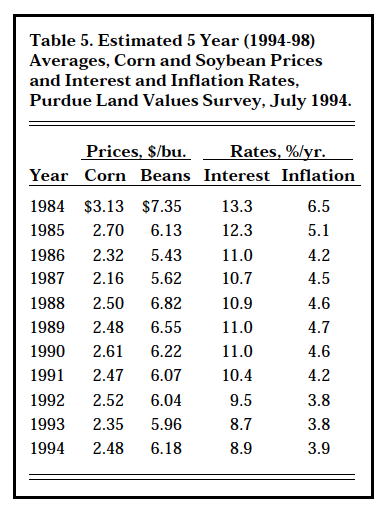
Table 5. Estimated 5 Year (1994-98) Averages, Corn and Soybean Prices and Interest and Inflation Rates, Purdue Land Values Survey, July 1994
Respondents were asked to estimate annual averages over the next five years for corn and soybean prices, the farm mortgage interest rate, and the rate of inflation. The five-year projections they made since 1984 are shown in Table 5.
Both corn and soybean price expectations rose, for beans, the first time in 6 years. Inflation and interest rate expectations also rose slightly, probably reflecting recent interest rate increases and more talk about possible increases in inflation. Ironically, application of the
“cure” for inflation (higher interest rates) well before any evidence that inflation is getting worse seems to have convinced the public that there is, indeed, greater probability of more inflation.
Two factors having a positive influence on land values have changed since mid-year 1993. First, interest rates have increased and are widely expected to rise even more. Second, crop prospects are better now than a year ago raising the prospect of increasing grain stocks in 1995 and beyond. The resultant pressure on corn and bean prices is aggravated by uncertainty about lower government support for farming in the 1995 farm bill. In the present setting, the following statement from last year’s report still seems appropriate: “We believe that there is more upside potential in land values than there is downside risk, even though, in the short run, slight decreases might occur.”
* * * * * * * *
The land values survey was made possible by the cooperation of professional farm managers, appraisers, brokers, bankers, county extension educators, and persons representing the Farm Credit System, the Farmers Home Administration, ASCS county offices, and insurance companies. Their daily work requires that they keep well-informed about land values and cash rent in Indiana. The authors express sincere thanks to these friends of Purdue and Indiana agriculture. They provided over 400 responses representing most of Indiana’s counties. We also express appreciation to Sandy Dottle of the Department of Agricultural Economics for her help in conducting the survey and to Professors Chris Hurt and Lee Schrader for their review of this report and helpful suggestions.
![]()
![]()
![]()
![]()
![]()
