Land Values May Stabilize
August 16, 1975
PAER-1975-1
Author: J. H. Atkinson, Professor, Agricultural Economics
More than 150 Indiana farm managers, lenders, appraisers and brokers recently responded to a questionnaire on land values. Each reply represents a number of land sales observed by the respondent. Thus, the opinion on land values which were reported were based on numerous sales.
General Level of Land Values
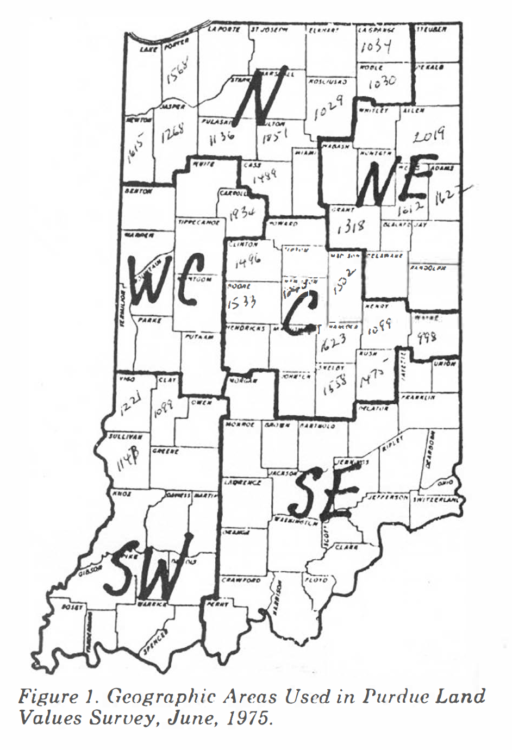
Respondents reported estimates of per acre values of top, average and poor farm land and for land moving into non-farm uses (transitional land). They also gave their estimates of average corn yields for the 3 classes of farm land. Replies came from 6 geographic areas (Figure 1).
Top land values in West Central Indiana this past spring were reported to average about $1400 per acre, $1267 in the Central region, over $1100 in the North and Northeast, over $1000 in the Southwest and $000 in the Southeast (Table 1). Similar regional difference’s held for average and poor land. Corn yields accounted for some of those differences. Average yield of 140 bushels on top quality land were reported in the Central and Central West-6 to 14 bushels more than in the other areas.
The value of average land in the spring of 1975 was in the general range of $800 to $1000 in all areas except the Southeast ($672) and Southwest ($753). This average land was estimate to produce 93 to 108 bushels of corn per acre.
This year, for the first time, estimates were obtained on building values and bare land values were calculated (Table 2). Building values were highest in the North, Northeast and Central areas with the averages ranging from $70 to $170. The range in averages in the Southeast and West Central areas was $30 to $100. Practically no building values were included in estimates from the Southwest.
The highest top bare land value was in the West Central area-nearly $1300 per acre. Averages for top land were around $1000 per acre in both Northern areas and the Southwest. The Central area figure was $1132 and for the Southeast it was $829.
Estimates from the survey, especially on top quality land, appear to be somewhat lower than value estimates which might be obtained in informal discussions with farmers. For example, land sales of over $2000 per acre have been reported in West Central Indiana, yet the average reported in this survey for top land was about $1400. There seems to be a kind of “trend psychology” which causes the casual observer to notice and talk about the land sales which emphasize current or expected trends. At any point in time, rather wide differences can be found in the price per acre of land of equal quality. Trend psychology causes us to tend to remember sales on the high side of the range if the trend is sharply upward, as it has been for over two years. If a down-trend is expected, the lower end of the range may be observed as evidence of declining prices.
Hopefully, the 150-plus respondents in this survey based their opinions on a cross-section of a number of sales which they know about and thus avoided most of the bias caused by trend psychology. If so, their estimates are more realistic than the “general feeling,” for example, that top quality land in West Central Indiana is selling for $1600 to $1800 per acre.
Transitional land-that moving into nonagricultural uses-was reported to be worth more than twice as much as top quality farm land in the two southern arras. In the other areas, transitional land values were /40 to 70 percent above top land values. Average values for this land moving into urban uses ranged from $1700 to $2100 per acre.
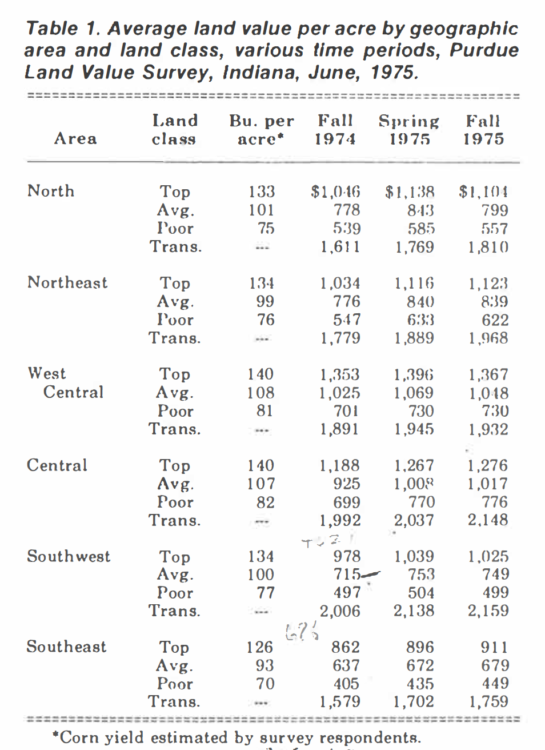
Table 1. Average land value per acre by geographic area and land class, various time periods, Purdue Land Value Survey, Indiana, June, 1975.
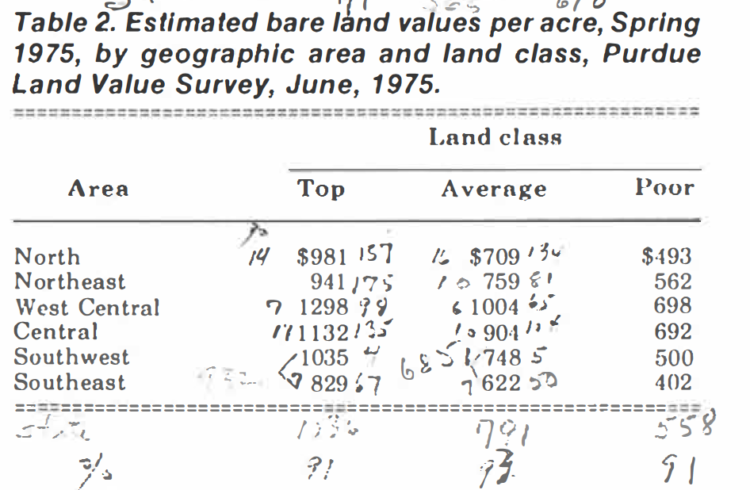
Table 2. Estimated bare land values per acre, Spring 1975, by geographic area and land class, Purdue
Land Value Survey, June, 1975.
Price Increases, Fall ’74 to Spring ’75
Percentage increases in farm land values from last fall to the spring of 1975 generally were in the range of 3-9 percent (Table 3). The two northern areas of the state showed the greatest strength with increases of 8-9 percent. The West Central area, hard hit by drought last year, showed increases of only 3-4 percent.
By way of comparison, the Federal Reserve Bank of Chicago reported a 6 percent increase in Indiana land values for the 6 month period ending April 1, 1975. The USDA index of land values indicated the same increase occurred in the 4 months ending March 1, a rate which, if extended to 6 months, would indicate a 9 percent increase.
In dollar terms, top quality land was reported to have gone up from around $75 to $150 per acre from last fall to spring. Figures for average land were on the order of $50 to $75 increases per acre.
Transitional land also increased in values over the six months ending last spring-from 2-10 percent. Small increases of 2-3 percent were reported in the Central and West Central areas.
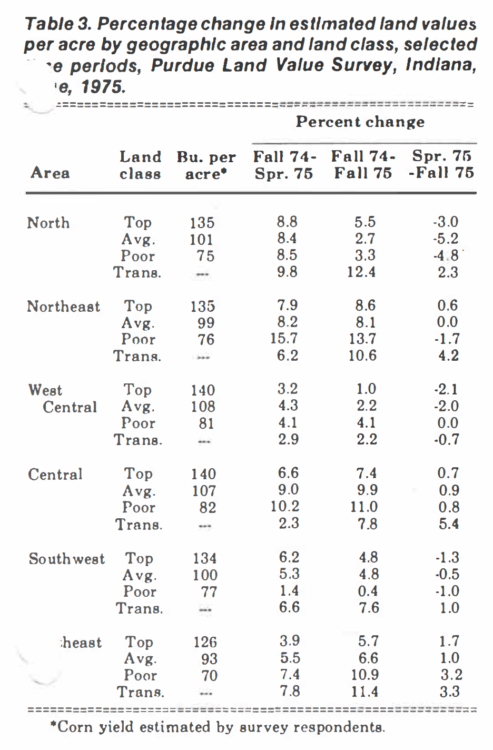
Table 3. Percentage change In estimated land values per acre by geographic area and land class, selected periods, Purdue Land Value Survey, Indiana, June, 1975.
Trends in Land Values
The 3-9 percent half-year increases reported in this survey are sharply lower than the 20-30 percent figures reported for the same period last year. This indicates considerable “winding down” of the land price boom which started in late 1972.
Indications of further slowing down of prices increases is seen in replies to the questions of where land prices will be this fall. In 3 of the 6 areas, the average respondent expected a decline of up to 5 percent from spring to fall of this year in land prices. In the other three areas no change to slight increases were expected, generally, 1 percent or less.
Over half of the respondents expected land prices to remain unchanged from spring to fall, 1975. The remainder were about equally divided between those who expected increases and those who thought prices would decline.
Thus there is a strong indication from this group of people who are close to the land market that we are in a period of stable land values-at least in the short run. This is similar to the position they took last year but the report on the survey warned, “They might not be right. The ‘right’ set of circumstances could not only result in higher fall prices and incomes than had been expected but also brighten the outlook for 1975”. This is exactly what happened, and we had another substantial increase in land values (15 percent for the year ending July 1, according to Federal Reserve Estimates).
There is again uncertainty regarding crop conditions (as of early August), exports and the influence of these factors on farm income. But increased costs of production in 1975 will mean less net income than 1974 even if corn and bean prices are as high this fall as last. There may have been enough improvement in grain prices since the survey was made to suggest that short term land price expectations might be changed from “stable” to “stable to slight increase.”
Looking further into the future, 54 percent of the respondents said they expected land prices to be higher in December, 1976 than in June, 1975- by an average of 8.5 percent. On the other hand, 30 percent thought there would be no change and 16 percent expected lower land prices. This indicates more optimism than was expressed a year ago when only 42 percent predicted an increase and 29 percent a decrease.
More optimism was expressed with regard to average on-farm corn prices for the period 1975-80. The figure this year was $2.49, up 13 percent from the $2.19 estimate of last year. While a five-year average of $2.19 may be reasonable (a good many ag economists would put it lower), we must remember that weather conditions caused grain price increases in both J 974 and 1975. In a year with weather as good as it was in 1972, on-farm corn prices very likely will be as low as $2.00.
Implications
For those whose plans call for selling land in the next few years, this period of high and likely stable land prices may be a good time to sell. Land that is being rented on a crop share basis likely will earn a rate of return less than the farm mortgage interest rate with corn prices around $2.00-a figure which is likely in a year of average to good corn belt weather. When that occurs, there could also be weakness in land prices. If land has to be sold in a year or so, this is the risk taken by not selling in the next 6 to 9 months.
Other persons are considering buying land. The investor buyer who plans to rent out the land needs to budget carefully both average returns and cash flow. Returns likely will not average much more than the farm mortgage interest rate; therefore, the decision to purchase land may hinge on one’s expectations of long run increases in land values. If 70-80 percent of the purchase price is borrowed, there will be years when the landlord’s cash returns from the farm will not meet the payments.
Farm operators need also to budget carefully their expected returns and cash flow. As has been true for two decades or more, land for enlargement or as a base of operations often earns good returns. But for operators who have to borrow the maximum, this may be a good time to consider cash renting for a year or two to avoid the risk of cash flow problems. Others who are in a better financial condition or who have off farm income are in a better position to weather a year of reduced farm income. If their longer run expectations are for gradually increasing land values, they probably should go ahead and purchase land of the type and location that fits their needs.
