Large-Scale Farmers’ Views of Sources and Responses to Risk
September 12, 1999
PAER-1999-13
George F. Patrick, Professor and Wesley N. Musser, Professor at University of Maryland (former visiting professor at Purdue University)
![]()
![]()
![]()
![]()
![]()
Farming is a dynamic industry. The sources of risk which producers face and responses which they make to manage risk in their farming operations change. For example, the
“Freedom to Farm Act” in 1996 eliminated the deficiency payment pro-gram and replaced it with declining and non-price-responsive production flexibility payments. The standing crop disaster assistance program was also eliminated, and major changes were introduced in crop insurance. New marketing tools, often involving multiple positions in the market, have been developed for farmers’ use. Participants in the Top Farmer Crop Workshop (TFCW) held at Purdue University have been surveyed about their perceptions of the sources of and responses to risk. This article compares the views and responses of the 1991, 1993, and 1997 TFCW participants. Although producers’ views of sources of and responses to risk have changed some, additional changes will be necessary to respond to evolving economic conditions, such as the current extended period of low prices.
The Sample
Participants in the TFCWs are not a representative sample of all farmers, but their views and opinions are considered typical of large-scale commercial farmers. There were no significant differences in the number of acres operated, age of respondents, or their educational level among the three survey years. The farms aver-aged about 1,900 acres of crops (primarily corn and soybeans), and all had gross farm receipts of over $100,000. The producers responding were about 40 years of age and had completed more than three years of education beyond high school. Typically, less than 20 percent of the respondents received more than 25 percent of their gross income from livestock. Participants were asked to rate, on a scale of one (low) to five (high), the importance of a number of sources of risk in their decision making. Participants were asked to use a similar scale to rate the importance of a number of responses to risk and also to indicate whether they used the response in their farm operation.
Sources of Risk
Table 1 summarizes the averages and standard deviations of eight of the most highly rated sources of risk from the 1991, 1993, and 1997 surveys. Not surprisingly for TFCW producers, crop price and crop yield variability were the most highly rated sources of risk in two of the three years studied. Injury, illness, or death of the operator was the top-rated source of risk in the 1993 survey and was third in the other two years. Because of changes in the government program as a result of the “Freedom to Farm Act,” it is commonly believed that crop prices may be more variable in the future. This view is consistent with producers’ ratings in Table 1. The 4.61 rating on the 5-point scale of importance for crop price variability in 1997 is significantly higher than the 4.30 for 1991 and 4.17 for 1993. At the same time, the 3.20 rating of importance given to the government commodity program in 1997 was significantly lower than the 3.83 in 1991 and 3.63 in 1993.
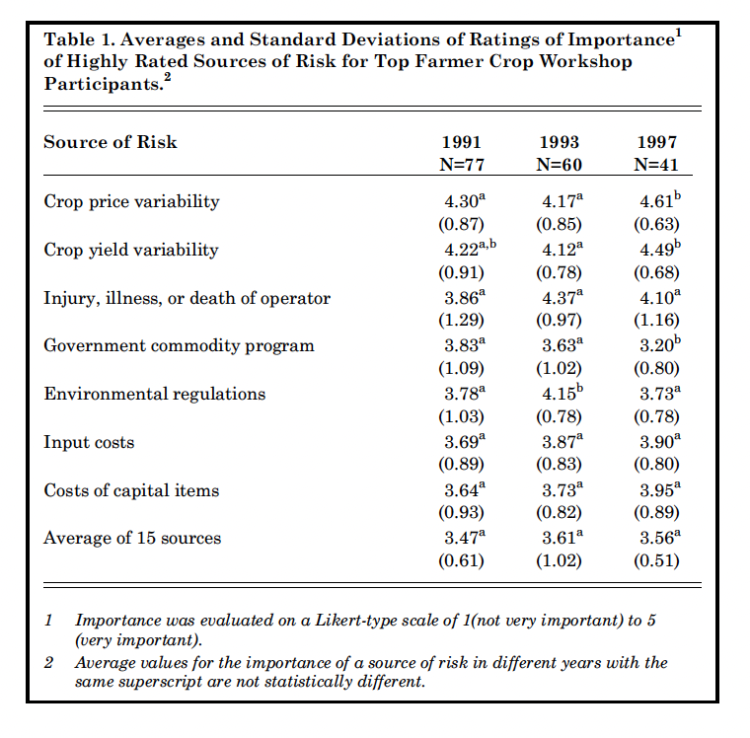
Table 1. Average and Standard Deviations of Ratings of Importance of Highly Rated Sources of Risk for Top Farmer Crop Workshop Participants
The importance rating associated with injury, illness, or death of the operator increased from 1991 to 1993 and then declined in 1997. However, because of the relatively large standard deviations (reflecting a wider range of responses of producers) these differences were not statistically significant. The importance of environmental regulations as a source of risk was significantly higher in 1993 than in other years. This probably reflects the concern about the need for conservation till-age and crop producers’ adjustments. If livestock had been of greater importance to these producers, the decline in the importance of environ-mental regulation between 1993 and 1997 might not have occurred.
In 1997, for the first time, the sur-vey questionnaire included changes in business arrangements with out-put purchasers and with input suppliers as sources of risk. Changes with respect to output purchasers rated 4.12 on the 5-point scale of importance. The 4.12 rating was third among the sources of risk in 1997 and rated above injury, illness, or death of the operator in importance. In contrast, changes in business arrangements with input suppliers rated 3.15, which was well below the average of 3.56 for all sources in 1997.
Input costs and the costs of capital items were among the highly rated sources of risk in all three years. The importance rating of both increased over the period, but the increases were not statistically significant. Overall, the average importance rating of the 15 sources of risk considered in all three surveys did not differ significantly.
Table 2 summarizes some of the lower rated sources of risk. Livestock price and yield variability received low ratings, 2.39 and 2.15, respectively, in 1997, reflecting the limited importance of livestock to TFCW participants, and they are excluded from the table. For 1997, land rents were the lowest rated source of risk, and the rating was significantly lower than in previous surveys. Although differences were not statistically significant, credit availability and interest rates increased steadily in importance as sources of risk from 1991 to 1997. With the exception of changes in technology, the standard deviations of the lowly rated sources of risk were larger than for the highly rated sources of risk. This indicates a greater range of producer responses with respect to the lowly rated sources of risk. Although some producers considered these sources of risk as very important in their farm operations, most producers rated them as relatively unimportant.
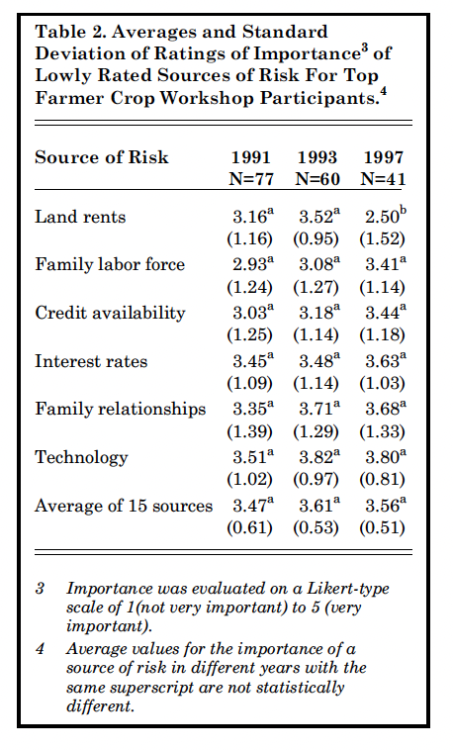
Table 2. Average and Standard Deviation of Ratings of Importance of Lowly Rated Sources of Risk For Top Farmer Crop Workshop Participants
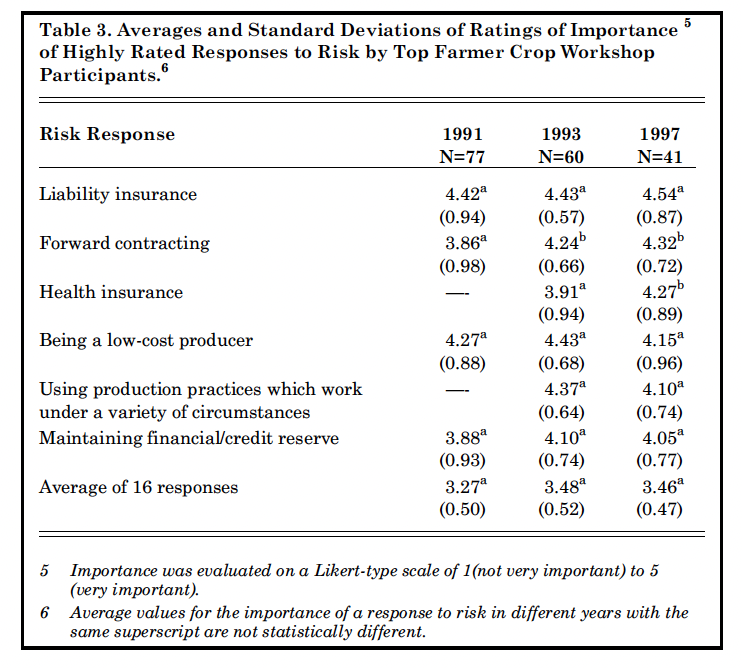
Table 3. Average and Standard Deviations of Ratings of Importance of Highly Rated Responses to Risk by top Farmer Crop Workshop Participants
Responses to Risk
Producers may make a variety of responses to manage risk. The 1991 survey considered 16 responses, while the 1997 survey considered 25. Table 3 summarizes the averages and standard deviations for all three surveys of the responses to risk rated at 4.0 or above in 1997. Liability insurance was the top-rated risk response in all three surveys. For-ward contracting of some commodities was the second-rated response in 1997, and there was a statistically significant increase in its rating between 1991 and the later surveys. Health insurance was the
third-rated response in 1997, and its 1997 rating was significantly higher than in 1993. Although liability insurance and forward contracting were the most highly rated responses to risk, only 78 percent of respondents indicated that they had liability insurance or used forward contracting, and 71 percent had health insurance. Levels of use by producers was consistently slightly lower in 1993, but the differences were not significant.
Being a low-cost producer, using production practices which work under a variety of conditions, and maintaining a financial/credit reserve were the next three highly ranked responses to risk. There were no statistically significant differences among years. In 1997, 68 per-cent of the TFCW participants indicated they used production practices which worked under a variety of conditions, 58 percent maintained financial/credit reserves, and 56 percent felt they were low-cost producers.
Table 4 provides the averages and standard deviations of the lowly rated responses to risk. The lowest rating of importance that off-farm employment received is not surprising given the large scale of the farm operations involved in the TFCW. Although multiple peril crop insurance increased steadily in its importance rating, the differences among years were not statistically significant. Hail/fire insurance for crops rated slightly higher in importance as a response to risk than multiple peril crop insurance all three years. In spite of the low ratings of importance as responses to risk, 44 and 46 percent of producers in 1997 indicated they used hail/fire and multiple peril crop insurance, respectively.
Two of the marketing responses to risk in Table 4, minimum prices con-tracts and use of commodity options, had significant increases in their ratings of importance. Given the expected greater importance of variability in prices after “Freedom to Farm Act,” the increase in importance of these responses is not unexpected. However, the increases in importance ratings occurred between 1991 and 1993, not after the 1996 Farm Bill. Levels of use by producers were not statistically different between 1993 and 1997. Almost 22 percent of producers in 1997 used minimum price contracts, as com-pared with 20 percent in 1991. The percent using options went from 35 percent in 1993 to over 41 percent in 1997.
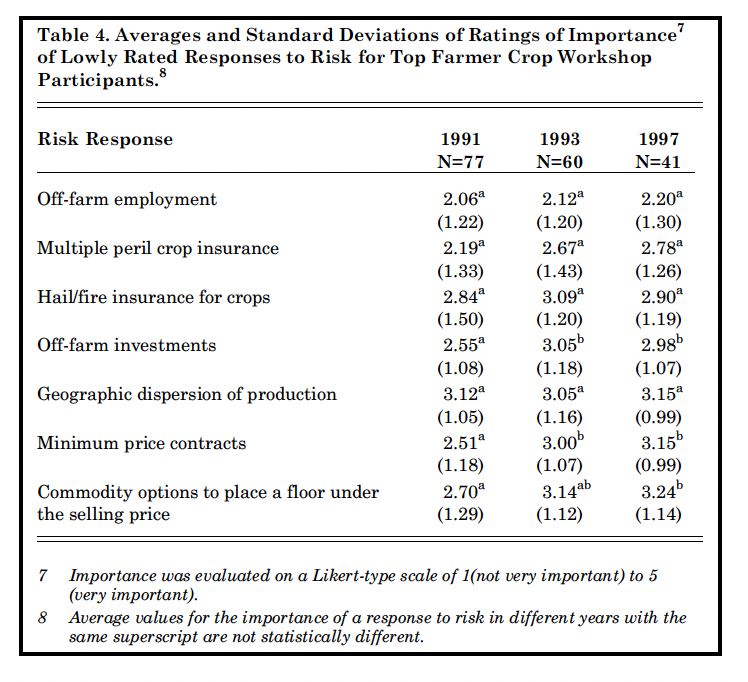
Table 4. Average and Standard Deviations of Ratings of Importance of Lowly Rated Responses to Risk for Top Farmer Crop Workshop Participants
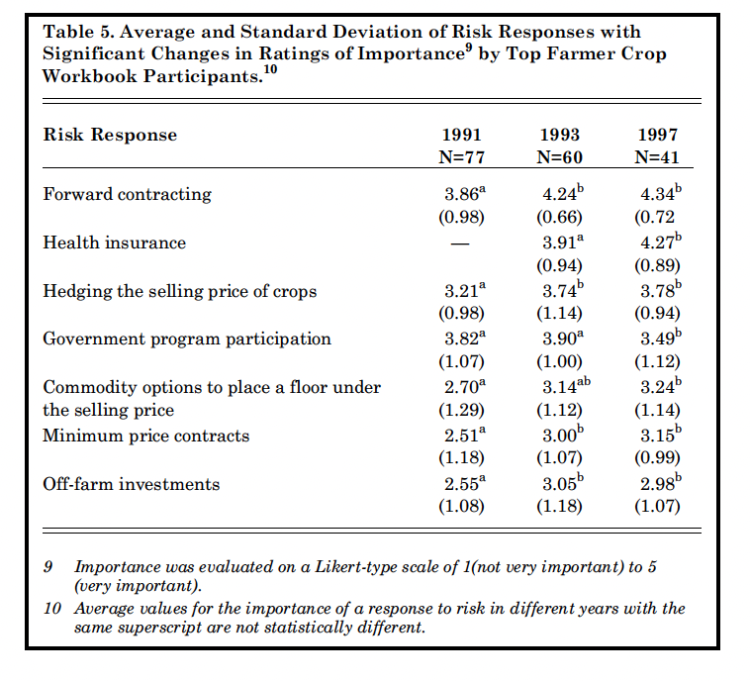
Table 5. Average and Standard Deviations of Risk Responses with Significant Changes in Ratings of Importance by Top Farmer Crop Workshop Participants
There were a number of commonly suggested responses to risk which fell into a middle group in terms of importance to the TFWC participants. Some of those included in this category were diversification of enterprises, having back-up labor/management, off-farm investments, and debt-leverage management. Although the ratings of importance were not high, almost 50 percent of producers in 1997 used diversification, 38 percent had back-up labor/management, 42 per-cent had off-farm investments, and 53 percent used debt-leverage management. Table 5 presents the responses to risk which had statistically signifi-cant changes over the period. These were generally associated with mar-keting responses or government pro-gram participation. However, as discussed previously, the change occurred between the 1991 and 1993 surveys rather than after the ‘96 Farm Bill. The 1997 survey included some additional responses in the marketing area for the first time. Having a written marketing plan rated a 3.19 on the importance scale, and 30 percent of producers had such a plan. The importance of using a marketing consultant was rated at 3.15, and about 44 percent used a consultant. Producing some specialty crops under contract rated a 3.02 on the importance scale, and 39 percent produced specialty crops under contract.
Implications
There are no “right” or “wrong” answers with respect to the ratings of the importance of various sources of and responses to risk. Each producer is in a unique position with respect to risk management. Crop yield and price variability, together with possible incapacity of the opera-tor, are the highest rated sources of risk for many large-scale farmers of the type that attend the TFCW. There are a number of responses which producers can make to man-age risk. Common strategies for protecting against these risks include health and liability insurance, being a low-cost producer, using production practices which work under a variety of circumstances, and use of marketing instruments. The sources of risk do change over time, and the responses also change as new risk management tools are developed. For example, in the crop insurance area, new products which ensure revenue, rather than just yield, have become available. Thus, a producer’s risk management strategy needs to be dynamic, adapting to a changing business environment.
![]()
![]()
![]()
![]()
![]()
