Low Farm Prices Contribute to Modest Food Price Changes
December 16, 2017
PAER-2017-18
Author: Jayson Lusk, Department Head and Distinguished Professor of Agricultural Economics
![]()
![]()
![]()
![]()
![]()
Last year, 2016, proved to be a record setter, at least in recent history, for food price changes. For the first time in at least three decades, the annual consumer price index for food at home fell. Driven in part by the fall in agricultural commodity prices, prices for food at home fell 1.3% from 2015 to 2016. While prices for food eaten away from home increased 2.6% from 2015 to 2016, this change remained below the twenty-year historical average increase of 2.7%.
Where are retail food prices in 2017 and beyond? The fall in prices from food at home appears to have abated. Through the first ten months of 2017, prices for food at home increased every month save one (June), but the in- creases were quite modest – averaging a tenth of a percentage increase each month. Increases in prices of food away from home through the first ten months of 2017 are similar to that observed during the same time in 2016. The USDA Economic Research Service forecast overall food price inflation of 1% to 2% in 2017 and 1.5% to 2.5% in 2018, with most of the increases coming from changes in prices of food away from home.
The figure below shows the year-over-year monthly changes (for example, the percent change from October 2016 to October 2017) in prices of several food and non- food items. The year-over-year change in the price of food away from home has hovered around 2.5% for the past four years. By contrast, the year-over-year changes in prices of food at home were largely negative in 2016, but have subsequently trended positive. Similar, though more dramatic, patterns are observable for prices of meat and for fruits and vegetables. Despite the recent increases in prices of food at home, meat, and fruits and vegetables, the increases remain quite modest. In-fact, the year-over- year increases for each of these food items remain below the increases in prices of non-food items, which have averaged about 2% since mid-2016. It is important to make comparisons to changes of non-food prices because it is the relative changes that drive consumer purchase behavior. If the price of non-food items increases at the same rate as food items, one would not expect much change in consumers’ food purchases.
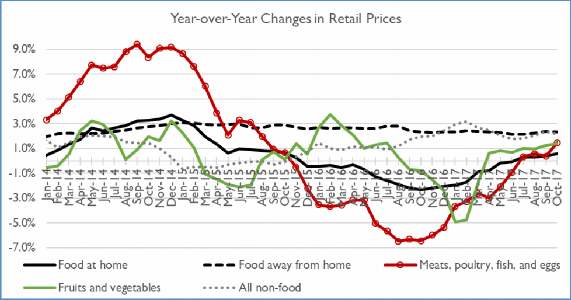
Figure 1. Year-over-year monthly changes in retail prices.
![]()
![]()
![]()
![]()
![]()
