Making the Most of Yield Monitor Data from On-farm Trials using Spatial Analysis
November 18, 2007
PAER-2007-10
Terry Griffin, Assistant Professor, Department of Agricultural Economics and Agribusiness, University of Arkansas Cooperative Extension Service; Tony Vyn, Professor, Department of Agronomy, Purdue University; Craig Dobbins, Professor, Department of Agricultural Economics, Purdue University; Raymond Florax, Professor, Department of Agricultural Economics, Purdue University, and Department of Spatial Economics, Vrije Universiteit Amsterdam and Jess Lowenberg-DeBoer, Professor, Department of Agricultural Economics, and Associate Dean of International Programs in Agriculture, Purdue University
![]()
![]()
![]()
![]()
![]()
Our three-year Purdue University study tracked farmers’ use of yield monitor data and its use in making management decisions. Case studies were utilized, instead of a survey with a larger number of farmers, because of the desire to better understand which data was used and what were the salient characteristics of the decision-making process. Participants included five farmers conducting their own on-farm trials. The farmers were located in Indiana, Illinois, Kentucky and Ontario, Canada. Results indicate that farmers with access to a spatial analysis of their on-farm trial data made decisions more quickly and had more confidence in their management decisions than when other sources of crop yield data are used.
Case Study Farms
One reason farmers cite for not conducting on-farm trials is that trials take too much time and interfere with other farming operations. Precision agriculture technology has reduced the time requirements and costs of conducting on-farm research. Combine yield monitors and global positioning systems (GPS) allow low-cost site-specific yield measurements to be collected. The increased amount of site- specific data from yield monitors and other sensors has created both data handling problems and an opportunity for new analysis techniques.
Case study farmers were initially identified as innovators who sought out better analysis techniques. They were selected based upon their expertise in conducting on-farm trials with yield monitors. All five farmers have at least six years experience mapping yields and annually
test production practices using on-farm trials.
The five farmers were included in a multiple case study consisting of two groups. Three farmers
were introduced to spatial analysis over the three-year project period. This group is referred
to as the “experimental group”. This group learned about spatial statistics and they received spatial analysis reports on some of their on-farm trials from university staff involved in the USDA/SARE project. The case study “control group” comprised two farmers that did not receive a spatial analysis for their on-farm trials. For many topics such as adoption of new technology, use of precision agricultural methods, and conducting on-farm trials, the two groups of farmers were very similar. The experimental group includes Farmer D, Farmer F, and Farmer W, while the control group includes Farmer P and Farmer T.
Farmer D
Farmer D produces irrigated corn, soybean, popcorn, green beans, and seed corn in Illinois. Illinois River bottom soils and variable topography influences yield response to inputs. Farmer D is a graduate of Illinois State University. Manual GPS lightbar navigation has been used for four years; however, no automated guidance has been used. Variable rates of lime, phosphorus, and potassium have been made over the past five years. Farmer D has been using computers and the Internet for 10 years. His first yield monitor was purchased off the back of a flatbed trailer at an auction in 2000, and he began collecting georeferenced yield data the following year.
Farmer F
Farmer F grows corn and soybean under strip-till production in Indiana. Farmer F is a graduate of Purdue University and has been using computers for more than 12 years and
the Internet for nearly 10 years. Manual lightbar navigation was used for four years prior
to adopting automated guidance four years ago. The highest level of GPS accuracy, RTK-GPS,
has been used for automated guidance the last three years and is currently used on four tractors. Yield mapping has been used for seven years. Variable rate applications of lime, phosphorus, and potassium have been used for four years.
Farmer W
Farmer W produces corn and soybean in Kentucky. Farms are rolling hills with eroded hilltops and depression areas prone to reduced yields in wet years. Farmer W has been practicing no-till production for 20 years; however, many fields were extensively tilled prior to Farmer W’s management practices. Lightbar navigation has been used for nine years and automated guidance for two. Farmer W and his wife have advanced degrees in Agricultural Economics from Purdue University. Farmer W stated that the first piece of farm machinery purchased was a personal computer in 1986 with the Internet and email being used for the last four years.
Farmer P
Farmer P grows corn and soybean in Kentucky. A graduate of University of Kentucky, Farmer P has been using computers for farm management for 27 years, with the Internet over the past ten. Manual lightbar navigation was used four years ago with automated guidance used on equipment for the last two years. Variable rates of lime and seeds have been used for eight and 10 years, respectively. On-farm trials have been a management practice for 10 years.
Farmer T
Farmer T grows corn, soybean, dry edible beans, and wheat in Southwest Ontario. The farmer was considered to be an innovator with the first automated boom sprayer in Ontario and mapping yields for 13 years. Manual lightbar navigation has been used for four years and automated guidance for two years. Variable rates of nitrogen, phosphorus, and potassium fertilizer have been used for eight years. Farmer T earned a B.S. from the University of Guelph, and an advanced degree in Agricultural Economics from Purdue University. He began using computers and the Internet extensively 17 years ago.
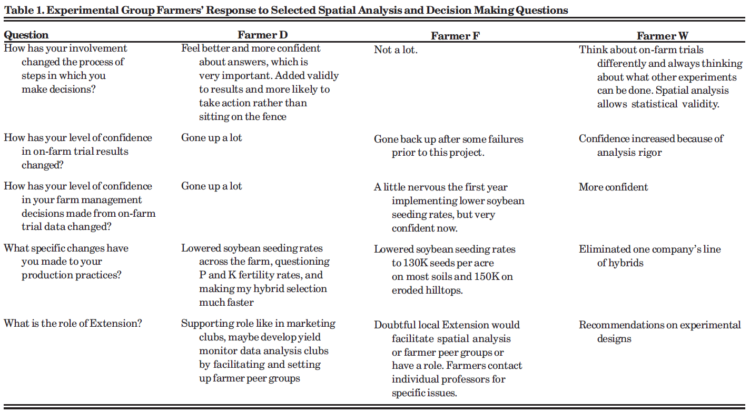
Table 1. Experimental Group Farmers’ Response to Selected Spatial Analysis and Decision Making Questions
Results
All five farmers commented on their experiences analyzing on-farm trial data and collaborating with a third-party analyst. Three of the five farmers suggested that in the future a small number of farmers would conduct their own spatial analysis of on-farm trial data. Many more farmers, however, are expected to outsource their spatial analysis to a third party. These farmers typically expect third-party spatial analysis services to assist in the design of the experiment, offer advice on collecting quality data, and provide a final report with a farm management recommendation.
A useful spatial analysis report could be short and contain only the final recommendation, or it could include details on statistical significance and interpretation. In order for the report to be useful, a quick turnaround time (such that early order discounts may be secured or the decision can be implemented for the next production season) is essential. Farmer F stated that the final production recommendation is all that was needed once the relationship between the farmer and analyst was established. However, a more lengthy report may be useful in building credibility early in a relationship. Farmer D asked for more detail on statistical analysis and interpretation of statistical results. Farmer W asked for more information but stressed that timely recommendations were more important than report details.
The farmers of the experimental group were able to provide an opinion about the impact of spatial analysis on their confidence in on-farm trial results, how this type of analysis influenced their farm management decisions, and the impact on their production. Farmer D and Farmer W stated that the participation in the USDA/SARE project changed the process with which they make decisions (see Table 1). All three experimental group farmers had increased confidence in their on-farm trial results and the farm management decisions based upon those trials relative
to before spatial analysis. Farmer F stated that his confidence in on-farm trial results have rebounded after earlier failures. Farmer W stated that the analytic rigor associated with spatial analysis led to increased confidence in on-farm trial results.
All three experimental group farmers made decisions faster with spatial analysis. Farmer D added that he makes more decisions now than before using spatial analysis. In the past, Farmer F said, he was somewhat hesitant to implement changes indicated by on-farm research, but he has more confidence now that his decisions can be based on the spatial analysis. Each experimental group farmer has made changes to their production practices based upon spatial analysis of their on-farm trial data, including Farmer D and Farmer F lowering seeding rates, and Farmer W ending use of one company’s corn hybrids.
Each of the three experimental group farmers commented on the role of the university Land Grant Extension system in yield monitor data analysis. They suggested that Extension may facilitate yield monitor data analysis clubs and provide assistance with experimental designs. The farmers saw campus Extension Specialists as a primary source of information in dealing with the technical issues (e.g., selecting treatments, designing experiments, and spatial analysis), but expressed doubts regarding whether Extension has the capacity to work directly with large numbers of farmers in conducting trials and analyzing the resulting data. They saw the university having a key role in providing spatial analysis training regardless of whether the analyst was a farmer or a third-party service provider.
Conclusions
Farmers who had access to spatial statistical and economic analysis through the USDA/SARE project had more confidence in both their on-farm research data and farm management decisions than before this project. Farmers exposed to production recommendations based upon spatial analysis also made decisions more quickly and some made more decisions than they would have without spatial analysis.
Precision agriculture not only provides farmers with new opportunities, but also creates new challenges for those that advise farmers, including university Extension and private consultants. Case study farmers indicated that some innovative farmers may conduct their own spatial analysis, however many farmers will probably outsource their spatial analysis needs to a third party. If demand by farmers for spatial analysis increases, Extension may need to increase the number of training opportunities for private consultants performing spatial analysis for farmers.
*This study was funded by a USDA-Sustainable Agriculture Research and Education (SARE) Graduate Student Research Grant.
More Information
Griffin, Terry, “Decision Making from On-Farm Experiments: Spatial Analysis of Precision Agriculture Data,” Ph.D. Dissertation, Department of Agricultural Economics, Purdue University, West Lafayette, IN, 2006.
Acknowledgements
A United States Department of Agriculture – Sustainable Agriculture Research and Education (USDA-SARE) Graduate Student Grant Program project number GNC03-020 entitled “Development of Appropriate Participatory On-Farm Trial Designs for Sustainable Precision Agriculture Systems” provided funding to facilitate this research.
We appreciate suggestions from two anonymous reviewers.
![]()
![]()
![]()
![]()
![]()
