More Grains for China by 2000
August 18, 1996
PAER-1996-2
Lei Zhou, Graduate Assistant and Philip L. Paarlberg, Associate Professor
![]()
![]()
![]()
![]()
![]()
China is the world’s largest producer and consumer of agricultural commodities, accounting for 20 percent of world grain production and 30 percent of world pork production. With its size and the rapid per capita income growth following economic reforms, concern has been expressed about the role China will play in global food markets. Projections of Chinese trade have ranged from expectations of modest net exports of grains to imports of almost unimaginable magnitudes. These differences arise from the differing assumptions authors make about future income and output grow. Those projecting net exports assumed relatively strong output growth and healthy income growth. Those seeing large Chinese imports driving world commodity prices higher and leading to starvation in other regions of the world assume shrinking Chinese agricultural land, slowing technological gains, environmental degradation, and rapid income growth with more per capita meat consumption.
This article presents another set of projections for Chinese trade in grains which foresees strong, but not excessive, growth in grain imports by the year 2000. Also, some key assumptions are varied to illustrate just how sensitive the projections are to these forces. These results show that when interpreting projections about Chinese trade, questions need to be raised about the production growth rate, the feed conversion ratios, and changes in human grain consumption assumed by the authors of the study.
Background
In 1978, China introduced a bold reform of its economic system designed to gradually give market forces a greater role in their centrally planned economy. In the past 18 years, many changes have resulted. At first agricultural output rose sharply as farmers were allowed to make their own production decisions and to keep the income they generated in farming. Agricultural output growth exceeded per capita income growth and China became a net exporter in competition with the United States. More recently agricultural output growth has slowed while per capita income growth continued to expand. Real per capita income in 1990 was 3.5 times that of 1978. As consumption expenditure increased during that period, the share of consumers’ budgets devoted to food fell, yet remained high. In 1978, 58 percent of spending was devoted to food compared to 54 percent in 1992. From 1978 through 1991, per capita grain consumption rose 2 percent per year and pork consumption (the dominant meat) rose 7.5 percent per year.
Despite the rapid income growth, per capita consumption of agricultural products in China remains behind its ethnic neighbors (table 1). Meat products, at 61 pounds per capita, account for 15 percent of the protein in the Chinese diet. The remaining protein intake comes from grains —633 pounds per capita in 1992. By contrast, Taiwan and Hong Kong consume 147 and 210 pounds of beef, veal, pork, and poultry per capita in 1992. The expectation is that the Chinese diet of the future will look more like those in Taiwan and Hong Kong. This increased meat consumption will raise demand for grains for feed.
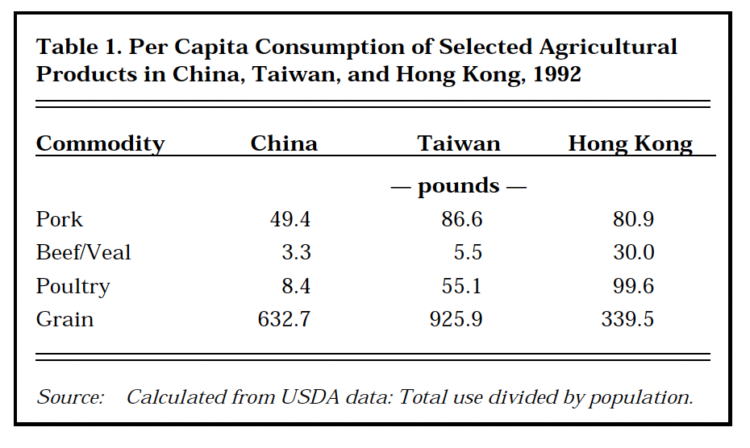
Table 1. Per Capita Consumption of Selected Agricultural Products in China, Taiwan, and Hong Kong, 1992
Projections of Grain Imports in 2000 To obtain projections for grain imports assumptions about the supply and demand forces in China through the end of the decade are necessary. Once these projections are made import levels can be determined.
A critical issue is grain output growth. The projections in this study use the period 1988 through 1995 which gives an annual growth rate of 2.24 percent. At that rate of growth in the year 2000, total grain production will be 386 million tons (table 2). Starting from the first year of reform in 1978 would give a much higher rate of growth in output, but most experts believe that China can-not sustain that high of growth rate. Following the early reforms there was a surge in output as China tapped unrealized efficiencies. Recent years have shown more modest output growth. Another concern is the urbanization and development are reducing agricultural land, both through conversion and environ-mental degradation.
The demand side has several forces to project. Of these population is the easiest. By 2000 the Chinese population will be 1.316 billion. Chinese per capita consumption and feed conversion ratios are harder to project. Using the years 1988 through 1992, per capita pork consumption is projected to grow 5.33 percent per year. For beef and veal, the growth rate is 15.85 percent, while a growth rate of 14.06 percent is applied to per capita consumption of poultry. These growth rates are conservative compared to the longer 1978-1992 trend. Feed conversion ratios from the U.S. Department of Agriculture by livestock type are used to find the feed needed for the projected livestock consumption. The feed conversion ratios used are 3.88 for pork, 6.32 for beef/veal, and 2.81 for poultry. Based on data from the 1980s, only half of the total feed sup-ply consisted of grains. Thus, the projected feed use is cut in half for a grain demand of 127 million tons (table 2).
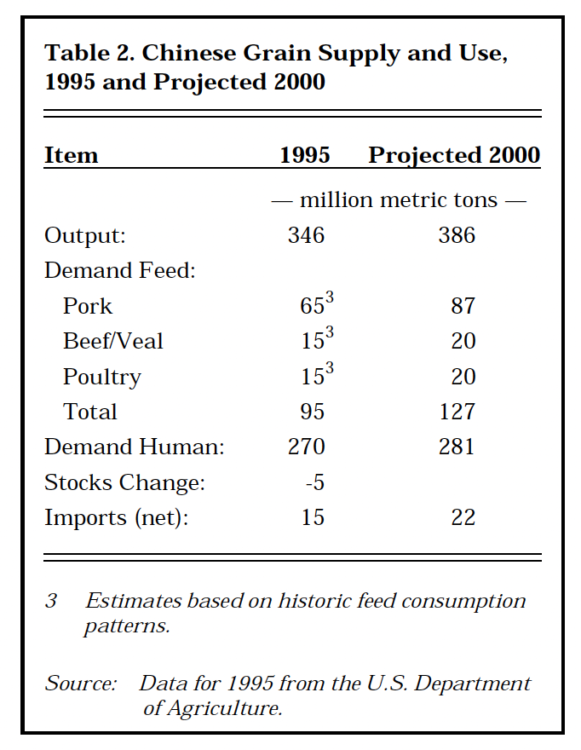
Table 2. Chinese Grain Supply and Use, 1995 and Projected 2000
Another force is human consumption of grains. In 1995 human consumption was 488 pounds per capita and was falling at 0.7 percent per year. Comparing human per capita grain consumption in Taiwan (304 pounds) and Hong Kong (309 pounds) suggests that a continued decline is reasonable. This gives a human use of 281 million tons (table 2).
Subtracting the projected output from the projected uses gives a gap of 22 million tons which would be imported. This compares to total imports of 15 million tons for 1995. At 22 million tons, China would almost be the world’s largest individual country importer with about the import volume of Japan.
Sensitivity of the Projections Given the widely different expectations over China’s future imports, it is useful to change some of the key assumptions and see what difference they make to the results. Three alter-native situations are considered. First, the growth rate in grain pro-duction is varied. Then technical change in livestock feeding is examined by changing the feed conversion ratios. Finally, the impact of different rates of change in human grain consumption is analyzed.
The base grain production growth rate is 2.24 percent per year. If that rate falls to only 1 percent per year, imports of grains rise to 45 million tons. In contrast, a higher growth rate for grain output of 4 percent per year causes net exports of 12 million tons in the year 2000.
A similar story occurs for changes in feed efficiency. If feed efficiency is allowed to improve by 20 percent for each type of livestock, the projection is that China will export 3 million tons. A livestock feed industry that converts feed into meat 20 percent less efficiently causes imports of grains to rise from 22 to 47 million tons.
The base projections assumed that human per capita use fell at 0.7 percent per year. If a more rapid decline is assumed —2 percent per year— the level of Chinese imports falls from 22 million tons to 4 mil-lion. However, if there is no decline in per capita human use imports rise to 32 million tons. And if human use rises 2 percent per year, huge imports of 63 million tons result.
This sensitivity analysis suggests that the projected magnitude of Chinese grain imports is very sensitive to the assumptions. While the base projections yield large, but manageable imports, a slowdown in grain production growth, a less efficient feed industry, or rising per capita human use sharply raise imports.
The unimaginable import projections for China sometimes reported assume all of these forces occur together. On the other hand, these forces operating in the other direction can easily project China to be a net grain exporter in competition with the United States.
Conclusion
China will be one of the major influences on world agricultural markets. This article projects Chinese grain imports for the year 2000 based on recent trends. The base set of assumptions used to project demand and supply suggest that China will be among the largest individual country importers of grains —22 mil-lion tons. That level is around the volume of present Japanese imports and is manageable without disrupting the world trading system.
Projections of Chinese trade have widely differing conclusions. Some forecast net grain exports, while others project imports at levels that would be catastrophic for world food supplies. Sensitivity analysis of the projections in this study can produce either of these scenarios depending on the assumptions made regarding grain output growth, feed efficiency, and human use. Tracking the forces that influence Chinese output and use will be critical in managing the integration of China into world markets.
![]()
![]()
![]()
![]()
![]()
