More Indiana Soybean Acres: Global Reasons But Local Implications
April 15, 2018
PAER-2018-04
Author: Chris Hurt, Professor of Agricultural Economics
![]()
![]()
![]()
![]()
![]()
Indiana farmers told USDA they would plant a record number of soybean acres in 2018. In fact, this is the sixth consecutive year they have shifted acreage away from corn and toward soybeans in the state. In fact, the state’s soybean acreage has increased nearly one million acres since 2012 and corn has decreased by 1.15 million acres.
Figure 1 provides an illustration of Indiana acreage planted to the four largest acreage crops. Those are soybeans, corn, hay and wheat. These USDA numbers are “planted” acres with the exception of hay which is “harvested acres.”
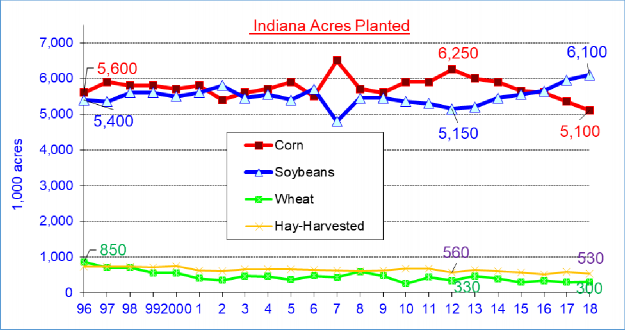
Figure 1. Indiana Planted Acres in 1,000s
The first year in the graph is 1996, a significant year in U.S agriculture representing the first year in modern history when government acreage set-asides were eliminated. This was commonly known as the “Freedom to Farm” policy in which both set-asides ended and government payments were designed to avoid incentives to plant a specific crop. Under this policy, government payments were de-coupled from planting incentives and thus market prices directed farmers’ decisions on which crops to plant. The elimination of set-aside acres also meant that all acres were in production with the exception of the on- going Conservation Reserve Program (CRP).
Why More Soybean Acres?
One question is why is acreage shifting to soybeans and why has this gone on for six years in Indiana? If market forces are providing greater incentives for soybeans then we might look at the expected returns for soybeans versus corn in Indiana. That is precisely what ag economist do each winter in educational meetings using Purdue crop budgets. For several years the expected returns for soybeans have been stronger than for corn. As an example this past winter, the Purdue budgets were showing $40 to $60 per acre stronger returns for soybeans versus corn on average quality Indiana soils using yields and costs in our budgets.
Why would soybeans be providing more returns in Indiana than corn? There could be a number of factors to explore but l will start with the growth in global demand for soybeans. The rate of growth in the global usage of soybeans has simply been larger than corn or wheat.
If markets are working properly, they should provide prices that give farmers the incentive to plant more of the crops that are most needed. Rapidly expanding usage is one of the factors that could cause a need for more acres.
The global use of soybeans has been outpacing the growth rates of corn and wheat. These annualized growth rates are shown in Table 1 by time period- mostly decades. Usage growth rates have been the slowest for wheat. For the 27 years from 1990 to 2017, the annual growth rate in global wheat use has been 1% a year. Interestingly, the annual increase in world wheat yield has been slightly more than 1% and as a result world wheat acres have dropped a small amount since 1990 (down 5%).
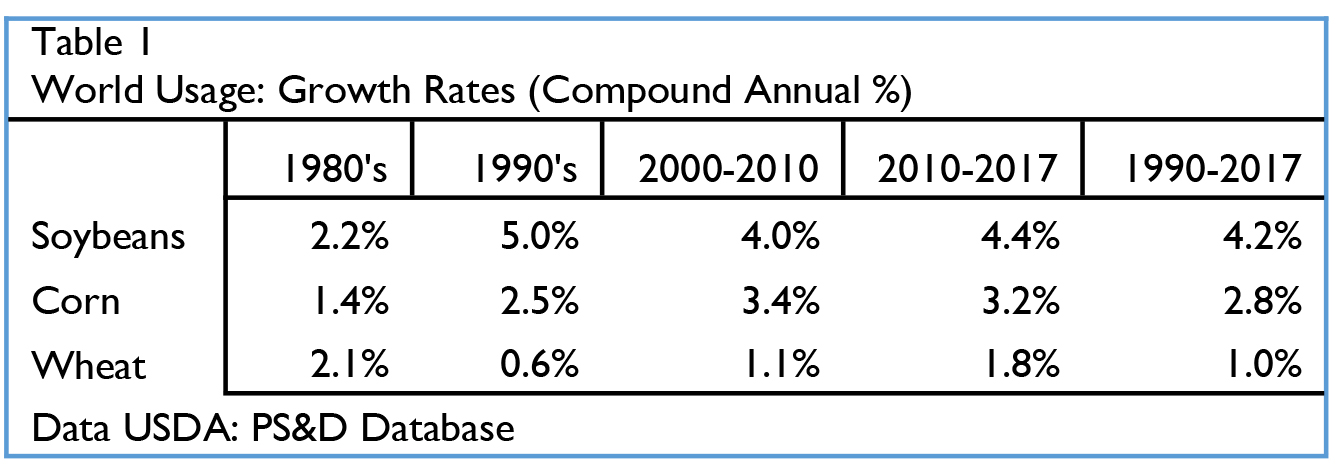
Table 1. World Usage: Growth Rates (Compound Annual %)
For corn, the annual growth rate in total usage has been much faster at 2.8% and yields have risen about 1.6% per year. Usage rising faster than yields means more acres of corn have been needed and total world acreage since 1990 has risen 42%. More acreage of corn has been needed in each recent decade, but especially in the decade from 2000 to 2010. That is when most of the buildup in corn usage was needed for ethanol production increases. Global annual usage growth rates surged to 3.4% that decade.
As you already know, the “rock star” of global usage growth has been soybeans. From 1990 to 2017, annual growth rates in world usage averaged 4.2%. The average annual yield increase of 1.2% could not begin to keep up. As a result, many more acres were needed to accommodate this quickly growing market. By 2017, world acreage had increased 2.3 times over 1990. South America provided 60% of the growth representing 105 million added soybean acres. The United States provided 19% of the world expansion or 33 million added soybean acres between 1990 and 2017. The most recent growth rate in soybean usage from 2010 to 2017 has been a very strong 4.4% per year.
What is the source of the usage expansion? Soybeans have strong usage growth rates for a number of reasons including growing incomes in developing countries. As those incomes rise, consumers eat more animal-based products and more animal production re- quires more soybean meal. Biodiesel programs in Eu- rope and the United States have increased the usage of vegetable oils like soybean oil. China is the geographic center of increased soybean use as that single country represents 43% of the world’s soybean use growth from 1990 to 2017. So to predict future soybean usage growth rates we would turn to predications of world income growth, biodiesel programs and to China.
USDA estimates real world economic growth in the next decade will accelerate, rising to 2.9% annually compared to 2.3% for the past decade. China’s real economic growth is expected to remain at a strong rate of 5.5% per year, but is slower than the 8.2% growth rate of the past decade.
Implications of More Indiana Soybean Acres
Indiana soybean acres have been growing in each of the past six years. One of the likely reasons is that world soybean usage rates have been growing faster than those for corn and wheat. Secondly, world yields of soybeans have not improved as fast as corn, so more world soybean acres are needed to keep up with the soybean usage growth. Some of those acres are in the U.S. and some in Indiana. Indiana soybean acres are already high and a continuing trend to even more Indiana acres may occur if current world economic growth accelerates as expected. What are some implications of high Indiana soybeans acres for input suppliers, farmers, and our marketing sectors?
Higher soybean acres imply greater soybean seed production relative to corn seed and other crops. More soybeans mean fewer inputs would be needed. There is less fertilizer use in the state especially nitro- gen fertilizer. Less fuel is needed as soybean production requires less machine fuel and dryer fuel com- pared to corn. More soybean acres mean less lender debt for operating loans. More soybeans suggest a potential downsizing of several Indiana input industries.
For farmers, more soybean acres relative to corn forces them to re-think a 50/50 corn/soybean rotation perhaps considering a rotation of 2-years beans and 1- year of corn. Heavier bean acreage may change optimum machinery requirements for planting and harvesting. The much smaller volume of soybean bushels per acre versus corn means that hauling equipment needs are sharply reduced. A heavy soybean farm also sharply reduces on-farm storage space requirements. On sloping soils prone to erosion, the limited residue from soybeans compared to corn may imply re-thinking conservation practices.
The marketing sector will feel the impacts of greater bean acres in 2018 and maybe beyond. Less commercial storage space will be needed. In 2018 with one mil- lion more Indiana acres in soybeans than corn, over 100 million less bushels of storage capacity will be needed than when corn/soybean acreage was 50/50. There will be more intensity of harvest activity around soybean harvest and less around corn. Total bushels going through grain handling facilities will drop and that tends to increase costs per bushel for grain elevators. Even end users will be affected as less corn means final users like ethanol plants and the animal industry have stronger competition for corn bushels.
I have made an argument for a continuation of the expansion of soybean acres in Indiana relative to corn and wheat. This trend has major implications for future cap- ital investments in machinery, storage, and plant investments in the state. But, a host of other factors could be drivers that were not discussed and could shift the trend. Early in 2018, China is proposing tariffs on U.S. soybeans. Such an action would cause a major recon- figuration of where soybeans are produced in the world. Also, Argentina suffered substantially reduced soybean production in early 2018 due to dry weather. This increased soybean prices and gave U.S. farmers stronger incentives to plant soybeans in 2018. While predicting whether the trend to more Indiana soybeans will continue, it is important to be aware of these trends, to continue to observe their direction in future years, and to remain cautious regarding capital investments that may be impacted.
References
USDA Agricultural Projections to 2027. Office of the Chief Economist OCE-2018-1. February 2018.
USDA PS&D database: data source for world acreage, yield and usage.
![]()
![]()
![]()
![]()
![]()
