Off-Farm Employment and Earnings Among Indiana Farm Households
April 17, 1994
PAER-1994-04
David H. Hearn, Research Assistant; Kevin T. McNamara, Associate Professor; and Freddie L. Barnard, Associate Professor
![]()
![]()
![]()
![]()
![]()
Off-farm employment income is important to farm families for several reasons. First, such income is often needed to help the family achieve a reasonable standard of living. The 1991 Costs and Returns Survey con-ducted by USDA’s Economic Research Service showed that the total household income of families who were primarily farmers was only slightly more than 75 percent of the average U.S. household income, and they relied on off-farm sources for almost 65 percent of their total income (USDA, 1993). Also, small and/or part-time farmers must often depend on off-farm employment income to compensate for net losses in the farming operation. Second, some farm households cannot meet the large capital requirements of some forms of modern U.S. agriculture. These households may be young, new to farming, small-scale, or some combination of these characteristics. They must work off-farm to amass the capital which they will need to remain in farming.
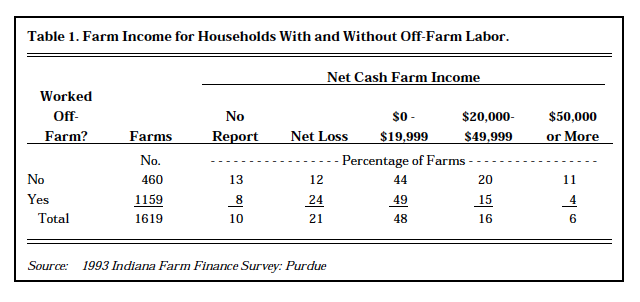
Table 1. Farm Income for Households With and Without Off-Farm Labor
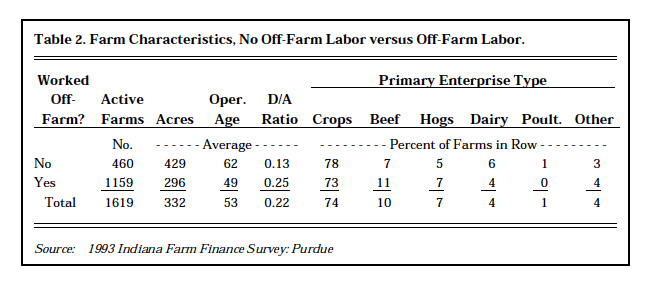
Table 2. Farm Characteristics, No Off-Farm Labor versus Off-Farm Labor
Third, farm households whose farming operation is experiencing financial dis-tress due to low returns or heavy debt burdens may be forced to work off of the farm to meet their financial obligations to creditors.
Income from non-farm employment is a very large component of farm household income in the U.S. In 1991, about 43 percent of average U.S. farm household income came from off-farm employment, versus about 11 percent from farming. Only 55 percent of U.S. farm households reported farming as their principal occupation. Of those, nearly 47 per-cent reported earning income from non-farm employment. The average amount earned per household from non-farm employment was slightly larger than the amount earned from farming. Almost 86 percent of farm households for whom farming was not the principal occupation reported income from non-farm employment, and on average these households needed such income to offset losses in the farming operation. Although Midwestern farm households were more dependent on farm income than households from other regions, they still received only slightly more than 22 percent of their total income from farming.
The importance to Indiana farmers of income from off-farm employment can be seen in the results of the 1993 Indiana Farm Finance Sur-vey. The study shows what proportion of farm households in Indiana reported off-farm employment and income, and presents average off-farm income levels and averages of selected farm characteristics. The data are presented in several tables and organized by farm income levels, debt-to-asset ratios, reporting district, and the primary enterprise of the farm operation.
Overall Participation in Off-Farm Labor
Table 1 compares net cash farm income between households who did and did not work off-farm. Of the 1,663 usable responses to the sur-vey, 1,619 were from active farms, slightly more than 97 percent of the total. As shown, nearly 72 percent of the active farms in the sample had some household member who worked off-farm. About 56 percent of the households who did not work off-farm reported net cash farm income less than $20,000, while almost 31 percent of those not working off-farm had net cash farm income of $20,000 or more. In comparison, over 73 percent of households who worked off-farm had net cash farm income less than $20,000, and only 18.5 percent of them reported income of $20,000 or more.
Farm characteristics differ for farm households who worked off-farm when compared to households who did not (Table 2). The house-holds who worked off-farm had smaller farms, younger operators, and a higher debt/asset ratio than the households who did not work off-farm. Proportionately fewer of the households who worked off-farm lived on field crop, dairy, and poultry farms, while proportionately more of them lived on beef, hog, and other crop farms. Further comparisons of these characteristics will be made in other tables.
Non-Farm Employment and Income by Farm Income Levels
Overall, about 57 percent of the operators and 48 percent of their spouses worked off-farm, and 18 percent of households had other members who also worked off of the farm (Table 3). The proportion of all family members who worked off-farm was higher for farms with low farm income, and much higher for the households which lost money in farming. Households which reported net losses or low income from farming were proportionately more likely to have worked more off-farm in the past year and to be planning to work more off-farm in the coming year. For all farms, about 15 percent reported working more off-farm in 1992, and 13 percent planned to work more off-farm in 1993.
Average farm size was larger and operator’s off-farm employment income was smaller as net cash farm income increased (Table 4). On aver-age, those farm households which reported negative or low farm income had farms less than one-half the size of those reporting moderate farm income and less than one-fifth the size of those reporting high farm income. Of the households which reported net cash farm income, those with positive but low farm income had the lowest average off-farm employment for spouses, while those reporting either net farm losses or moderate farm income had the lowest average levels of non-wage, non-farm income. Both spouse’s non-farm income and unearned income were highest for the farms with the highest net cash farm income.
Non-Farm Employment and Income by Debt-to-Asset Ratios
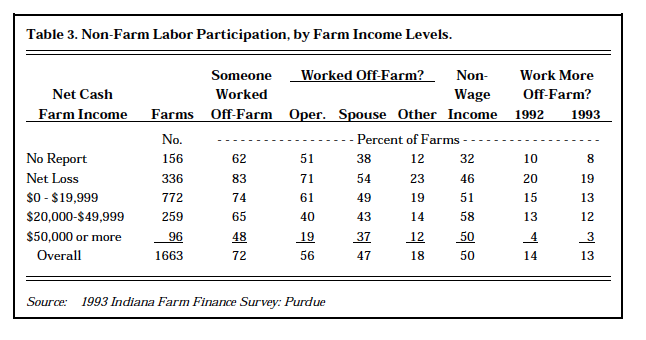
Table 3. Non-Farm Labor Participants by Farm Income Levels
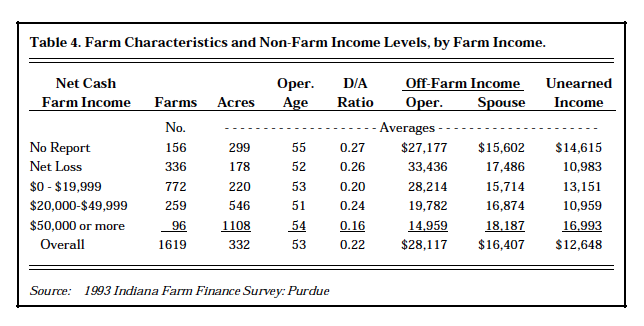
Table 4. Farm Characteristics and Non-Farm Income Levels, by Farm Income
Almost 33 percent of the active farms surveyed declined to report some component of either their assets, their debts, or both, so no ratio is available for those farms (Table 5). About 24 percent of total active farms had debt-to-asset ratios of zero, while less than one percent reported being insolvent.
Many researchers prefer to assign financial risk levels to farms using debt-to-asset ratios. These levels are also shown in Table 5. The usual grouping refers to those farms with debt-to-asset ratios less than 0.40 as financially safe, those with debt/assets from 0.40 to 0.70 as financially vulnerable, and those with debt/assets between 0.70 and 1.00 as in a financial crisis (Walker and Bellinghausen). Farms with debt-to-asset ratios greater than 1.00 are of course insolvent. According to this system, slightly more than half of Indiana farms surveyed were financially safe, about 12.5 per-cent were vulnerable, nearly 3 per-cent were in crisis, and less than one percent were insolvent.
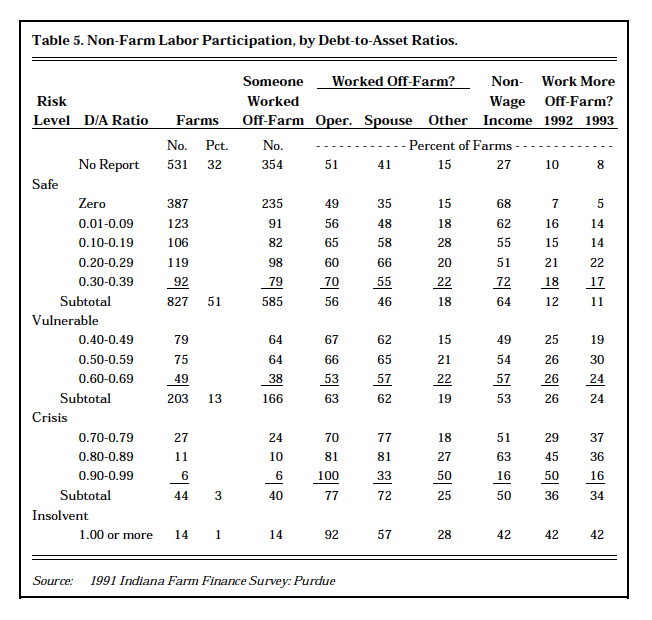
Tble 5. Non-Farm Labor Participation, by Debt-to-Asset Ratio
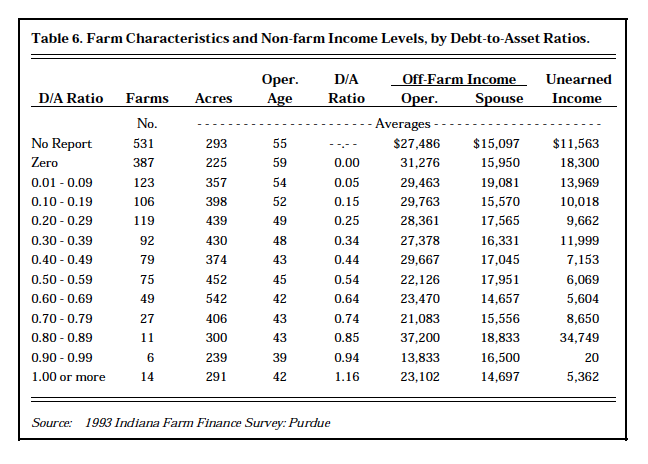
Table 6. Farm Characteristics and Non-farm Income Levels, by Debt-to-Asset Ratios
The general trend in off-farm labor participation can be seen by the percentages across debt/asset ratios, but it is starkly outlined when viewed across risk categories. In general, the tendency to work off-farm increased as financial risk (as measured by debt-to-asset ratios) increased. For instance, about 57 percent of the operators whose farms were safe worked off of the farm, but this proportion rose until roughly 93 percent of the operators of insolvent farms worked off-farm. This pattern also holds for other household members’ off-farm work and for households working more off-farm in both the past year and the coming year. The proportion of spouses working off-farm increased as finan-cial condition worsened to the crisis level: roughly 47 percent of spouses on safe farms worked off-farm while about 72 percent of spouses on farms in crisis worked off-farm. However, only about 57 percent of spouses on insolvent farms worked off-farm.
The smallest farms, on average, were those at each extreme of the scale, with either debt-to-asset ratios of zero or ratios at or near insolvency (Table 6). Table 6 indi-cates that average farm size may be smaller for farms in crisis than for the safe or vulnerable farms; if so, the pattern is not strong. In general, average operator’s age, operator’s non-farm income, and household unearned income all tend to fall as the ratio of debts to assets rises. Spouse’s average income seems to rise as debt/assets increases.
Non-Farm Employment and Income by Reporting District
Participation by farm families in non-farm employment seems to vary across reporting districts. The tendency for operators to work off-farm, relative to their proportion of total active farms surveyed, increased from north to south and from west to east. In general, spouses were most likely to work off-farm across the middle of Indiana. Spouses in the Central and East Central reporting regions were most likely to work off farm, while spouses in the Southeast region were least likely to work off-farm. Contrary to the spouses, other household members in the South-east region were most likely to work off-farm, relative to the number of farms in the region. The likelihood that households received non-wage income increased from the south to the north; households in the Northwest region were most likely to have unearned income, while those in the South Central region were the least likely. Households in the East Central region had the highest relative likelihood of having worked more off-farm in 1992 and of planning to work more off of the farm in 1993.
Farms in the Northwest region (Table 7) on average were the largest, had the youngest operators, and they had the highest debt-to-asset ratios, the lowest operator’s off-farm employment income, and the highest spouse’s off-farm employment income. In general, farms in south-ern Indiana were smaller and had the lowest debt-to-asset ratios. The oldest operators were in the South Central region. Farm households in the North Central region had the lowest average levels of both spouse’s and unearned income. Operator’s and unearned average income levels were highest in the Central reporting region.
Non-Farm Employment and Income by Primary Enterprise Type
Survey responses are broken down by primary farm enterprise in Table 8. As should be expected in Indiana, the vast majority (about 75 percent) of farms surveyed were mainly engaged in field cropping. Poultry operations were least represented at only about 1 percent of the total. Dairy farm operators and their spouses were the least likely to both work off-farm and to plan to work more off of the farm. On the other hand, households on farms specializing in beef, hogs, and “other” crops were far more likely to work off-farm than their counterparts on other types of farms. Households on beef farms were more likely, and house-holds on dairy and poultry farms less likely, to work off-farm than households on field crop farms.
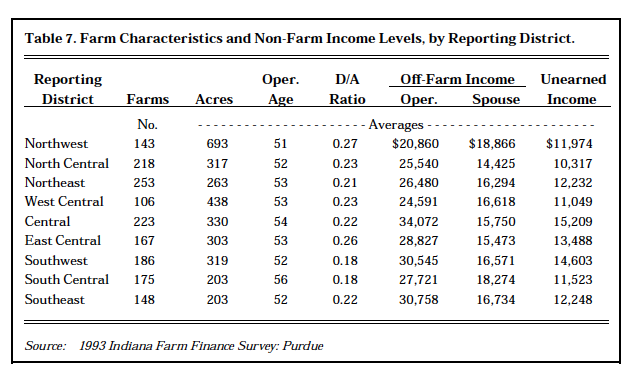
Table 7. Farm Characteristics and Non-Farm Income Levels, by Reporting DIstrict
Beef farms had the lowest aver-age debt-to-asset ratios and spouse non-farm incomes, but average operator off-farm income was relatively high. Field crop farms were the largest while “other” crop farms were the smallest. Dairy operators’ aver-age non-farm income was the lowest. The largest average spouses’ non-farm income was on “other” farms. Hog farm households had, on average, the youngest operators, the highest debt-to-asset ratios, and the lowest non-wage incomes. Poultry farms, by contrast, had the oldest operators, the highest average operators’ non-farm incomes, and the highest average unearned income levels.
Summary
This report has summarized selected results from the 1993 Indiana Farm Finance Survey regarding non-farm employment for Indiana farm house-holds. Farm households with negative or low farm income were more likely to work off-farm and to depend on off-farm income than those households receiving moderate or high levels of farm income. In addition, households living on Indi-ana farms were more likely to work off of the farm as the debt-to-asset ratio of the farm business, a measure of financial risk, increased.
The tendency for households to rely on off-farm employment and income varied, sometimes widely, across reporting regions. While the proportion of operators reporting off-farm employment increased as one moved from north to south and from west to east across Indiana, farm spouses in the central regions were the most likely to work off of the farm. Households in the East Central region were the most likely to have worked more, and to plan to work more, off of the farm.
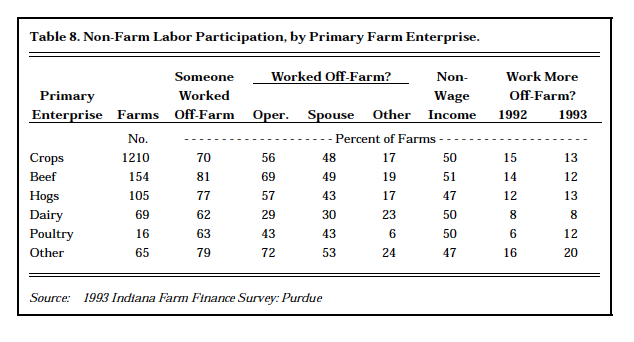
Table 8. Non-Farm Labor Participation, by Primary Farm Enterprise
Households living on farms specializing in “other” crops generally worked significantly more off-farm and had higher off-farm income levels than households on beef, hog, or field crop farms, while households on poultry farms generally worked off farm less, but had higher average off-farm incomes, than beef, hog, or dairy households. Households on dairy farms had both the least participation in and lowest incomes from off-farm employment.
These results show that income from non-farm employment is very important to Indiana farmers. For all active farms in the sample, 57 percent of operators and 48 percent of spouses worked off of the farm. Over 71 percent of the households on active farms reported that some household member worked off-farm. While some of those households are probably not full-time farmers, that proportion is much higher than the 47 percent of U.S. (full-time) farmers that reported off-farm work.
It is difficult to determine the share of total income derived from non-farm sources because the survey did not derive exact farm income levels. However, some ranges can be derived, though these ranges are not totally accurate. The 48 percent of the sample which received positive but low ($0 – $19,999) net cash farm income received much more income from off-farm sources than they did from the farm operation. At most, farm income made up only 26 per-cent of total household income for these farmers, less than the 35 percent share for U.S. farmers as a whole but more than the 22 percent for Midwestern farmers as a group. The households which had moderate levels of net cash farm income received roughly 30 to 51 percent of total income from the farm, while those with high net cash farm income received at most half of total income from the farm. In general, therefore, Indiana farmers needed income from non-farm sources to supplement low (or negative) house-hold income from farming. Without this income, Indiana farm house-holds would not achieve a standard of living on a par with their non-farming neighbors.
References
Barnard, Freddie L., Kevin T. McNamara, and Jeurene Falck. “Results of the Indiana Farm Finance Survey for 1993.” Purdue Agricultural Economics Report, December 1993.
Hearn, David H., Kevin T. McNamara, and Freddie L. Barnard. “Indiana Farm House-hold Off-Farm Employment and Earnings,” CES 274, Purdue Cooperative Extension Service, Purdue University, West Lafayette, IN, March 1994.
Indiana Farm Finance Survey, 1993. Departments of Agricultural Economics and Agri-cultural Statistics, Indiana Agricultural Experiment Station, Purdue University, West Lafayette, IN, March 1993.
Perry, Janet, and Bob Hoppe. “Farm Household Income Estimates Provide Additional Perspective on Farm Families.” Agricultural Income and Finance. AFO-49, USDA, ERS, June 1993.
Walker, Odell L., and Bob Bellinghausen. “Sources and Levels of Off-Farm Income in Oklahoma.” Current Farm Economics. Oklahoma Agricultural Experiment Station.
![]()
![]()
![]()
![]()
![]()
