Pork Industry Favored by Strong 2018 Demand
December 16, 2017
PAER-2017-21
Author: Chris Hurt, Professor of Agricultural Economics
![]()
![]()
![]()
![]()
![]()
Pork production increased by 3% in 2017, but hog prices were about 10% higher, averaging near $51 per live hundredweight. Stronger prices with higher production is generally an indication of strong demand. Strong pork demand is expected to continue in 2018 and will hold, or modestly strengthen, 2018 hog prices even with stepped up production.
The higher hog prices are due to consumer demand. U.S. economic growth in the third quarter reached 3.3% with the lowest unemployment rate since 2000. Strong income growth with more people working improves the consumption of meats, including pork. The 2018 outlook is for continued income growth and even lower unemployment. In addition, higher stock and housing values tend to cause consumers to spend more freely as well.
Pork is growing in popularity with our foreign customers. The world economy in 2018 is expected to have its strongest year since the 2008-2009 recession. In 2017, pork exports were up 7% and net trade (exports minus imports) was up 9%. U.S. pork production was up about 2.5% in 2017 but the more positive trade balance means that U.S. consumers have only 1% more pork available. With domestic population expanding by near 1%, this means that pork available per person in 2017 was about the same as 2016.
Mexico is the biggest reason for increased 2017 exports. The volume of Mexican pork purchases surged above Japan in 2015 to become our number one export destination. Since then, Mexico has continued to put Japan in the rear-view mirror. In 2017 to-date, the volume of Mexican pork purchases have exceeded Japan by 45%. South Korea, our fourth largest buyer has increased the volume of pork purchases from the U.S. in 2017 to-date by 18%. The export market looks strong for 2018 with USDA analysts suggesting an additional 6% rise. A positive outcome to NAFTA negotiations are vital to the pork industry.
Increased packer capacity began to reduce packer margins in August 2017 as new capacity began to come on-line. Lower pack- er margins can mean that more value is bid into the producers’ hog price. In October, the packer margin, as reported by USDA, fell to 48 cents per retail pound compared to 79 cents per retail pound one year earlier. In 2018, these new plants are expected to continue to expand processing numbers as they work toward full capacity. This will likely continue to be supportive to producer prices.
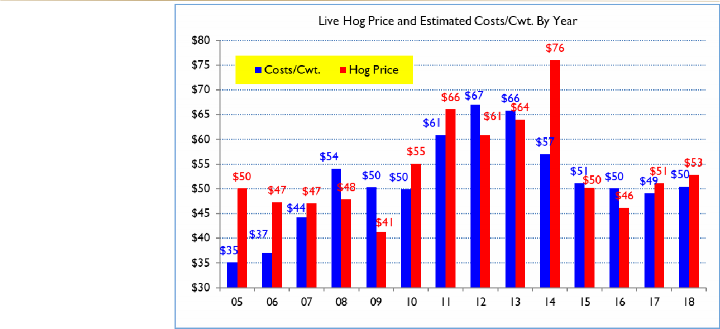
Live hog prices in 2016 averaged about $46 per live hundredweight and near $51 for 2017. The lean futures market, at this writing, is optimistic for a similar outcome in 2018 suggesting that live prices may average about $51 to $53 in 2018. My estimates are for pork supplies to rise around 2.5% in 2018 and if hog prices do rise again, it will most likely be due to positive demand factors.
Feed cost are expected to rise modestly in calendar year 2018 with corn prices up about 15 cents per bushel and meal up about $15 per ton compared to calendar 2017.
Estimated total costs of production will increase from around $49 in 2017 to a bit over $50 for 2018. With moderate feed costs and a low general inflation rate, estimated annual total production costs have been near $50 for the most recent four calendar years from 2015 through 2018. This narrow cost range is dramatically different when compared to the nine years from 2005 through 2013 when my estimated annual costs ranged from $35 per live hundredweight to $67.
For 2018, the current outlook is for positive returns above all costs. The level of positive returns is expected to be in the range of $5 to $8 per head for both 2017 and 2018.
The pork industry has been in expansion since 2014 when the PED virus helped send hog prices to record highs and feed prices dropped sharply. The pace of that expansion has been reasonably controlled and orderly. Annual expansion of 2.5% per year can be sustained as long as domestic demand remains strong and export demand grows by 5% or more. However, the industry could return to losses if expansion grows by more than 2.5% or the cur- rent strong demand drivers should falter.
![]()
![]()
![]()
![]()
![]()
