Pork Industry Looking for a Better 2019
December 5, 2018
PAER-2018-19
Author: Chris Hurt, Professor of Agricultural Economics
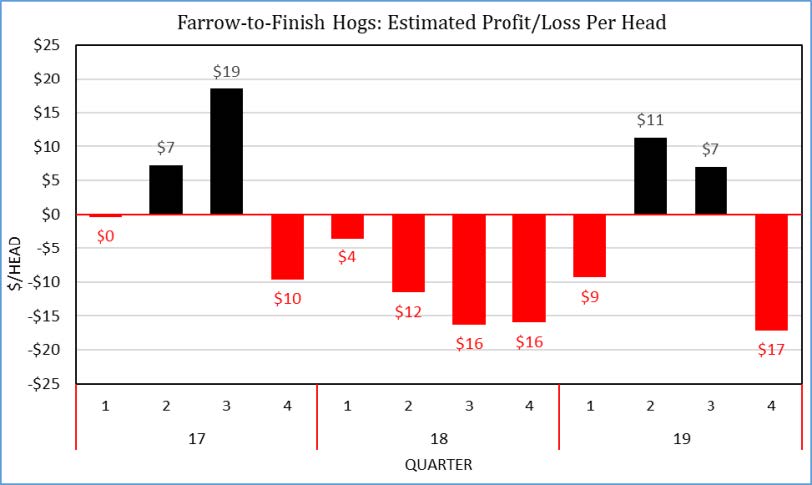
The year of 2018 did not turn out so well for pork producers as estimated losses were about $12 per head for farrow-to-finish operations. These were the largest losses since 2012 when high feed prices prevented positive returns. Pork production was up 3% in 2018. That was record high production as the industry has been in expansion since 2014.
Trade conflicts directly affected the U.S. pork industry in 2018. The two most important countries that put tariffs on U.S. pork were Mexico and China. Exports to Mexico in 2017 totaled 7% of U.S. production and exports to China represented 2% of U.S. production, or 9% combined. Markets reacted negatively to the fears of lost pork exports resulting in low hog prices in the late-spring and summer. Live prices in the third quarter of 2018 were $44 compared to near $56 for the same quarter in 2017. This reduction in price was far more than could be explained by higher supplies alone.
The Trump administration did provide trade assistance to pork producers as Market Facilitation Payments through USDA FSA offices. The payment was $8 per head of inventory on August 1, 2018. This is roughly equivalent to about $2 per head on annual production and there were payment limits that restricted larger producers. So, the trade assistance helped smaller producers, but was not sufficient to cover the estimated $12 per head of losses in 2018.
Now, at the end of 2018, we observe that the damage to exports was not as severe as feared. Pork export volume to China is down 19% for this calendar year and most of the decrease has been since the summer when Chinese tariffs on U.S. pork were put in place. While sales to Mexico also decreased relative to the same months a year-ago once tariffs were in place, total 2018 year-to-date sales to Mexico are still up 1%. Thus, Mexico largely did not reduce purchases as much as feared. There are at least two reasons. First Mexico wanted to avoid conflicts with the U.S. and quickly realized that the big trade battle was between the U.S. and China. Secondly, the U.S. probably remained near the lowest costs source of pork, even with the tariffs in place because of the close location and favorable transportation costs.
Turning to 2019, prospects look somewhat better. Producers are expected to continue to provide record sup- plies with another increase of 3%. Market inventories in the September Hogs and Pigs report were about 3% higher and represent the hogs to be marketed this winter. Farrowing intentions were also up about 2% and with higher pigs per litter will provide about 3% higher hog numbers next spring and summer. The supply of hogs in the fall of 2019 will come from the spring 2019 farrowings and those may only be up 1% given the losses in 2018.
Demand continues to look favorable for 2019 with a continuation of U.S. and World economic growth, but at a slowing growth rate. Low unemployment in the U.S. and rising wage rates will be supportive to domestic meat demand.
Global demand for 2019 has turned more optimistic for multiple reasons. First, total pork exports to all destinations in 2018 will be up 6%. While China did buy less in 2018, this was more than made up by other countries buying more. USDA analyst estimate that U.S. pork exports will grow again by a strong 8% in 2019. Second, the signing of the USMCA calms trade conflicts with Mexico and Canada. That trade agreement still needs approval in each country. In addition, it leaves in place the U.S. tariffs on steel and aluminum. It was these tariffs that caused Mexico and Canada to place restrictions on U.S. pork. Those tariffs still need to come off. Third, there appears to be progress toward cooling of the trade conflicts with China. If there is a grand bargain for China to buy more U.S. goods then pork will be one of those named Ag goods. Fourth, African swine fever in China is not under control and China may import more pork and other meat products to compensate for lost hogs due to the disease. China produces 97% of the pork they consume and imports only 3%. So, a loss of just 1% of their hogs due the disease could result in one-third more pork imports.
What are hog price prospects for 51% to 52% lean carcasses on a live weight basis? Hog prices in 2018 averaged about $46. Current prospects are for prices to average near $50 in 2019. Winter prices are expected to be in the mid-$40s and then move to the mid-$50s for averages in the second and third quarters. Then prices will likely drop seasonally back to- ward the mid-$40s in the final quarter of the year.
Feed prices have been low and fairly steady in recent years. This has helped to stabilize costs of pork production around my estimated total costs of $50 per live hundredweight. For 2019, corn prices are expected to be about 20 cents per bushel higher while soybean meal may be around $20 per ton lower. Pork producers can expect slightly higher total costs of production due to higher corn prices and higher labor, interest, and building costs. With current prospects for hog prices to average near $50, this means 2019 would be a year near breakeven for farrow-to-finish producers. Losses would be the norm in the first and the fourth quarter with profits in the second and third quarter roughly offsetting.
The bottom line is that the U.S. industry will be producing record pork supplies in 2019 and will need more open export markets and strong demand support. If not, another year of losses might result.

