Potential Profitability of Feeding Dairy Steers in Indiana
December 13, 2003
PAER-2003-11
Michelle M. Schank, Chris Hurt, and Kern Hendrix
![]()
![]()
![]()
![]()
![]()
The inventory of dairy cattle in Indiana is rising dramatically. Currently, Indiana is one of the fastest growing dairy states in terms of the number of milk cows. After decades of decline, milk cow numbers reached a low of 135,000 cows in 1999. That long-term trend has, however, reversed as Indiana milk cow numbers rose to as high as 155,000 in 2002. Most of the growth has been in large-scale specialized dairies that are not involved in crop production.
The increase in dairy cows has, of course, led to an increase in dairy calves. While these new specialized dairies tend to subcontract replacement heifer rearing, bull calves are viewed as a byproduct. Therefore, there has been an equally dramatic expansion in the supply of dairy steers, providing new opportunities for farmers in Indiana to finish these steers.
This article provides potential dairy steer finishers with an analysis of potential profitability and possible risk management strategies. While this appears to be a growing business opportunity, there is limited information regarding the historical returns from feeding dairy steers. To help fill this void, we had four objectives:
- To develop an Indiana Dairy Steer Feeding Budget;
- To examine the historical returns from feeding dairy steers in Indiana;
- To identify the primary factors that created variability in the historic returns;
- To examine risk management strategies.
Our Approach
The first step in explaining the profitability of dairy steer feeding was to develop an Indiana Dairy Steer Feeding Budget that incorporated all costs and revenues. Budgets for finishing dairy steers were examined from the University of Wisconsin, Michigan State University, University of Minnesota, The Ohio State University, and Land O’ Lakes. With these as a basic framework and the guidance of Dr. Kern Hendrix of the Purdue University Department of Animal Sciences, the Indiana Dairy Steer Feeding Budget was developed.
The analysis of returns was conducted on a monthly basis where cattle were placed on feed each month from January of 1992 through December of 2000. Cattle were assumed to be purchased at 500 pounds and sold nine months later at 1300 pounds. This provided returns for 108 months, beginning with placements in January 1992 and ending with the last cattle sold in September of 2001.
Prices for the budgets came from official public sources. Monthly dairy calf prices for USDA #2 feeder calves and finished USDA choice #2-3 dairy steer prices were from the Wisconsin Agriculture Statistics Services (USDA, NASS). Corn prices were the monthly Indiana corn prices received by farmers from USDA. The corn silage cost was derived from the corn price using a formula from the University of Nebraska’s Web site. Prices of protein supplement were 48 percent soybean meal prices at Decatur, Illinois. Monthly hay prices were for the U.S. average of “all hay” prices from USDA. Costs for veterinary and medical expenses, processing, yardage, marketing, and death loss were assumed to be fixed costs per head as determined by Dr. Hendrix and were constant through-out the analysis period. Yardage includes items such as labor, facilities, equipment, bedding, fuel, and utilities. Yardage cost was set at about $.26 per head per day, or about$70 per head for the nine-month feeding period.
Moderate Losses and High Variability
The average of the monthly returns for cattle placed from 1992 to 2000 (108 feeding periods) was a loss of $6.57 per head, with a standard deviation of $66.49 per head. The range of estimated monthly returns was from a maximum loss of -$152.19 per head to a gain of $123.57 over the nine-year period. This information is shown in Table 1.
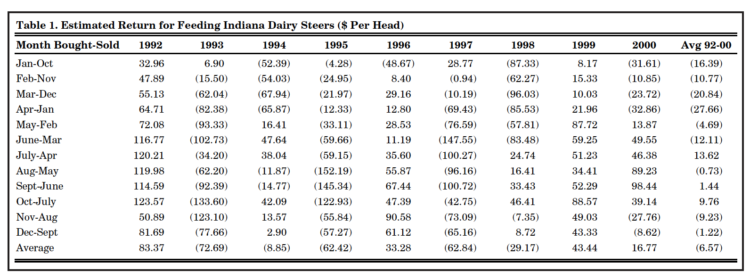
Table 1. Estimated Return for Feeding Indiana Dairy Steers ($ Per Head)
Figure 1 is a graphic illustration of the monthly returns. Periods of profit and others of loss are indicated, but there does not seem to be a cyclical pattern. However, the data period may not be long enough to reflect the traditional 10-to-12 year cattle cycle. Because of the apparent non-cyclical behavior of dairy steer returns shown here, it will more difficult for producers to predict profitable or unprofitable periods based upon potential indicators from the cattle cycle.
Figure 2 illustrates the seasonal pattern of returns and may prove beneficial to producers considering feeding dairy steers. The placement months that were more profitable tended to occur in late summer and early fall. Cattle purchased in July and sold in April, as an example, had the highest returns, averaging $13.62 per head. Buying in October and selling in July was the next most profitable practice, with an average return of $9.76 per head. Both of these periods generated a profit in six out of nine years. During the period of the study, it was most profitable for producers to place calves on-feed from July through October. The least profitable placement months were from January through April.
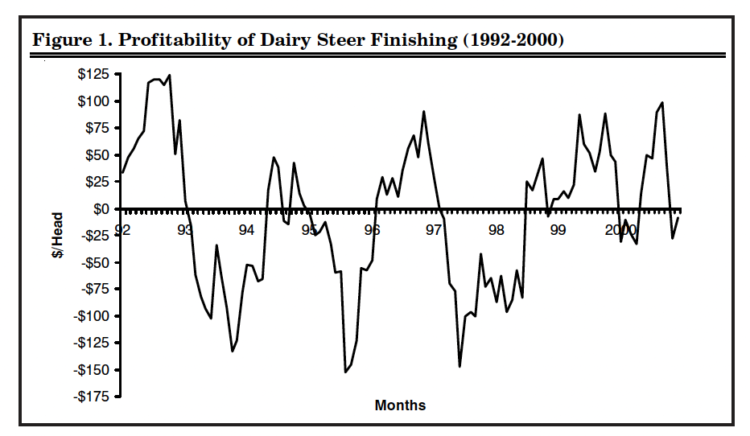
Figure 1. Profitability of Dairy Steer Finishing (1992-2000)
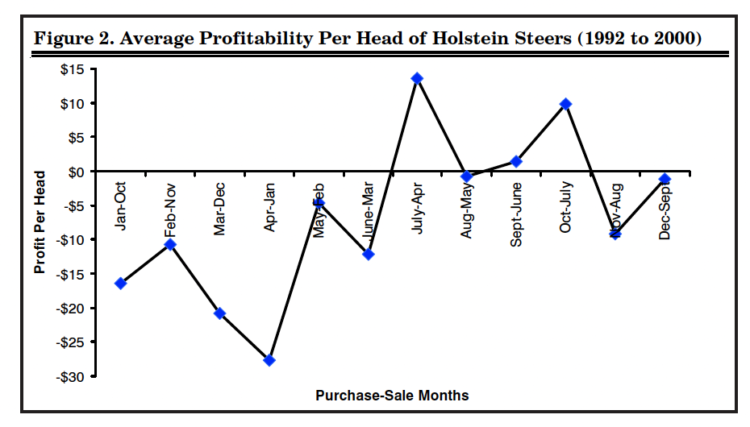
Figure 2. Average Profitability Per Head of Holstein Steers (1992 to 2000)
In the 1992 to 2000 time frame, 50 percent of the months had an estimated profit, and 50 percent of the months produced an estimated loss. The distribution of monthly profits and losses is shown in Figure 3. While the odds of making or losing money were 50/50, the magnitude of the dollar losses in the negative months exceeded the same average magnitude of profits in the positive months. As an example, 14 percent of the months had profits that were $60 per head or greater, but 25 percent of the months had losses that were $60 or more per head. An overall description would be that, “there was a 50/50 chance of making or losing money, but some of the loss months were very large.”
What is the source of the variability in estimated returns to finishing dairy steers in Indiana? About 63 percent of the variation in profitability was explained by three items: finished cattle prices, hay prices, and protein supplement prices. Finished cattle prices were by far the most important explaining 55 percent of the variation in returns, and hay prices were the second most important. Corn prices explained less than 1 percent of the variation in returns.
Difficult to Manage Price Risks The two variables that most directly impacted profitability were finished cattle prices and hay prices. There-fore, risk management tools for these variables may help reduce producers’ vulnerability in the market. Hay, however, is not traded on a futures exchange, limiting producers’ ability to control this risk through hedging. Hence, the only significant price variable that affects returns within producers’ control are finished cattle prices using live cattle futures traded at the Chicago Mercantile Exchange.
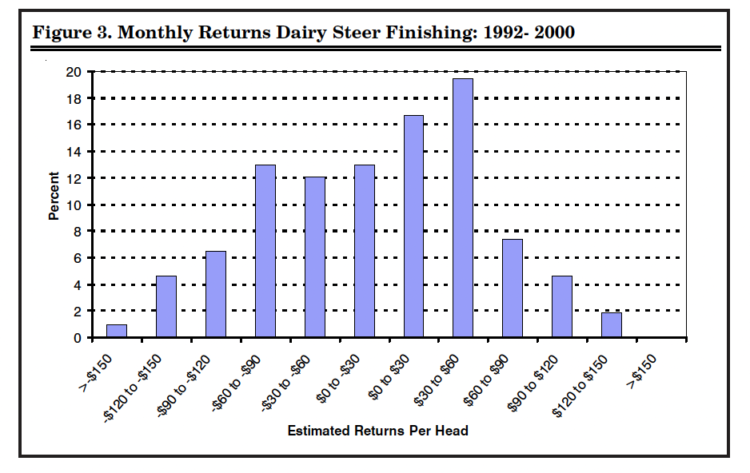
Figure 3. Monthly Returns Dairy Steer Finishing: 1992- 2000
To examine the possible positive returns to routine hedging with futures, the daily average price for each live futures contract was calculated from 1992 to 2000. These were then graphed to determine when routine hedging might be profitable. The results show that on average across the data period, it would not have been beneficial for producers to routinely hedge, because the highest average futures prices tended to occur at the end of the contract month, as illustrated by the February futures in Figure 4.
Individual years were then examined to determine if hedging was possible in the three years with extremely large losses: 1993, 1995, and 1997. During these unprofitable years, the highest futures prices still tended to occur near the end of the contract maturity, meaning that hedging during the feeding period would reduce returns compared to simply taking the higher cash market price. In addition, there would be additional costs for interest on margin money and brokerage costs if futures were used. Thus, during 1992 to 2000, routine futures hedging would have increased losses on average, and so there was little that producers could do to help manage their price risks through the futures market. Producers may be able to manage their risk through other mechanisms such as contracting, however.
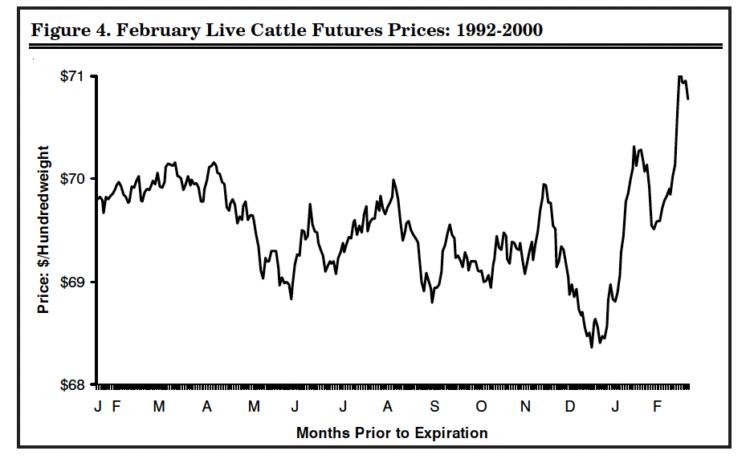
Figure 4. February Live Cattle Futures Prices: 1992-2000
But Maybe Our Costs Estimates Were Too High
This analysis has shown that returns over the 1992 to 2000 feeding period tended to be negative on average. However, this may also be an incorrect conclusion for some producers if their costs were distinctly different from those assumed in the Indiana Dairy Steer Feeding Budget.
Of particular interest is the yardage cost, which includes items such as labor, management, and facility costs that are resources provided by the family. These costs would vary from farm to farm and would be unique for each operation.
An alternative analysis could leave these out of the cost structure and view returns as a “return to yardage.” This would allow individual producers to calculate their own costs and evaluate whether this “return to yardage” would be sufficient to cover their facility, labor, and management costs.
Figure 5 does this by reducing the total cost by the yardage. Without the incorporated yardage cost, producers have a positive “return to yardage” 80 percent of the time, with an average return of $64.41 per head. In essence, this is a linear transformation of the previous method of calculation, but it allows potential dairy steer finishers to evaluate whether this is sufficient to cover their own costs.
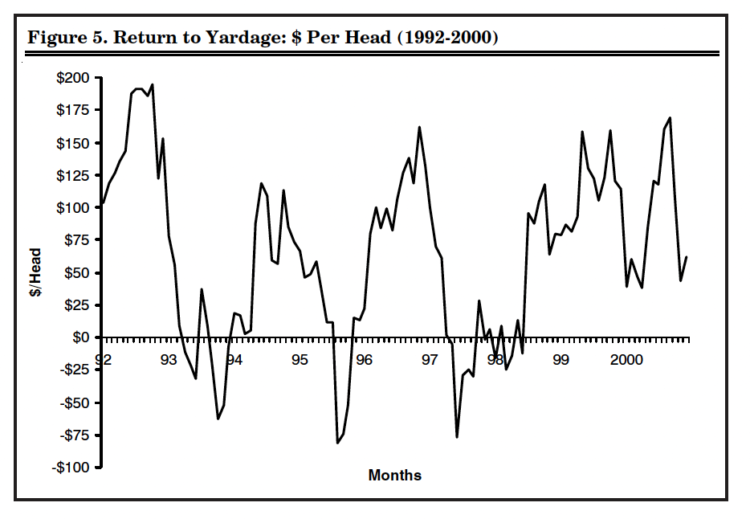
Figure 5. Return to Yardage: $ Per Head (1992-2000)
Summary and Conclusions
Large dairies are causing a rapid growth in Indiana’s dairy cow numbers, thus creating an opportunity for farmers to finish the dairy steers that are a by-product. While this is a potential new opportunity, there has been little available information on the possible returns from such an enterprise. To help fill this void, the Indiana Dairy Steer Feeding Budget was developed to capture the level and distribution of monthly returns from feeding Indiana dairy steers and was applied to a study period for cattle placed on-feed from January 1992 through December 2000.
Given the assumptions and estimated costs used in the study, dairy steer finishing was not a profitable enterprise on average over the data period. The average loss was$6.57 per head. The monthly returns ranged from +$123.57 to -$152.19. During this time frame there was no distinguishable cyclical impact; however, there was notable seasonality. Producers would have had losses, on average, for steers placed in the January to April period. Profitability tended to be greatest, on average, for cattle placed on-feed during the months of July through October. The simulated feeding operation would have lost money 50 percent of the time and made money 50 percent of the time. However, the months of large losses more than offset the months of high profits, thus resulting in a net loss on average.
Hay prices and prices received for the finished cattle were the two variables that most significantly affected returns. The price received for the finished cattle was by far the most important, explaining 55 percent of the variation in returns over the data period. Hay prices were the second most important, but corn prices and the purchase prices of the calves were not significant variables in explaining the variation in returns.
Because there is no futures exchange for hay, the only marketing tool available to producers for price risk management of important variables is the live cattle futures at the Chicago Mercantile Exchange. An examination of average daily futures prices from 1992 to 2000 for each of the live cattle delivery contracts revealed that the highest prices tended to come near the maturity of the contract. Therefore, hedging with futures would have resulted in lower net prices of finished cattle and thus increased the average losses above simply taking the cash price when the steers were market ready.
Returns to feeding Indiana dairy steers tended to be very risky, with wide variations across the 108 monthly observations. The average loss was $6.57 per head, but the standard deviation of returns was $66 per head. In addition, while the odds of a profit or loss were 50/50 overall, these returns were not evenly distributed. As an example, 14 percent of months had positive returns per head of $60 or more, but 25 percent of the months had losses of $60 or more per head. It is this much larger probability of very large losses that is of greatest concern.
It is important to realize that these results may not have held for all Indiana feeders because individual costs could have been distinctly different from those assumed in the Indiana Dairy Steer Feeding Budget. To account for this, total cost was reduced by yardage to determine a
“return to yardage.” Dairy feeder steers had a positive “return to yardage” 80 percent of the time and a mean return to yardage of $64.41 per head. Potential dairy steer finishers should calculate their own costs and determine if they could provide facilities, utilities, labor, and management for $64.41 a head or less. If so, dairy feeding would have been profitable overall in the 1992 through 2000 period, given our other assumptions.
This analysis shows that dairy steer feeding returns tend to be unpredictable, highly volatile, and prone to some large losses that are not easily reduced by futures hedging. To the extent these characteristics continue in the future, only producers in a strong financial position should consider this enterprise. Those with a stable financial position who already have usable facilities and excess labor would also be likely candidates because they may be able to keep costs moderate.
Finally, given the volatile nature of returns, those who do not meet the above conditions could consider feeding on contract, perhaps with the large dairies retaining ownership and taking the market risks.
Related References
“Feeding and Management of Dairy Beef Steers.” Land O’ Lakes Feed, 1999.
Hendrickson, S.R. “Enterprise Budgets: Dairy Steer Calves.” University of Wisconsin-Extension, February 2001.
Jones, Rodney, James Minert, and Martin Albright. “Seasonality in Steer Feeding Profitability, Prices, and Performance.” Kansas State University Agricultural Experiment Station and Cooperative Extension Service. June 1997.
Lawrence, John D. “Live Cattle Futures and Options: How Have They Done?” Iowa State University. http://www.econ.iastate.edu/faculty/lawrence/ Cattle%20Futures%20and%20Options.pdf. 2000
Lawrence, John D, Alexander H. Smith. “Managing Cattle Price Risk with Futures and Options Contracts.” Iowa State University. http://www.econ.iastate.edu/faculty/lawrence/Acrobat/ ManagingCattle PriceRisk.pdf. 2001.
Lawrence, John D., Zhi Wang, and Dan Loy. “Elements of Cattle Feeding Profitability in Midwest Feedlots.” Journal of Agricultural and Applied Economics, 31,2 (August 1999):349-357.
Nott, Sherrill B., Gerald D. Schwab, John D. Jones, James H. Hilker, and Lawrence 0. Copeland. “1995 Crops And Livestock Budgets Estimates For Michigan” Michigan State University. Agricultural Economics Report. 581, May 1995.
Zimmerman, Bill, and Brian Buhr. “Finishing Budget for Cattle.” University of Minnesota Extension, June 1999.
![]()
![]()
![]()
![]()
![]()
