Records Show Large Farm Income Difference
March 17, 1993
PAER-1993-3
Don Pershing, Extension Economist


Analysis of Indiana farm records reveals a huge difference between the high earning half and the low-earning half of the 101 Indiana farms who participated in the Purdue Comparative Farm Business Summary for 1991.While the farms were not representative of all farms in Indiana, the income difference among similarly sized farms is an indication of differences in production, marketing, and financial performance among farm managers.
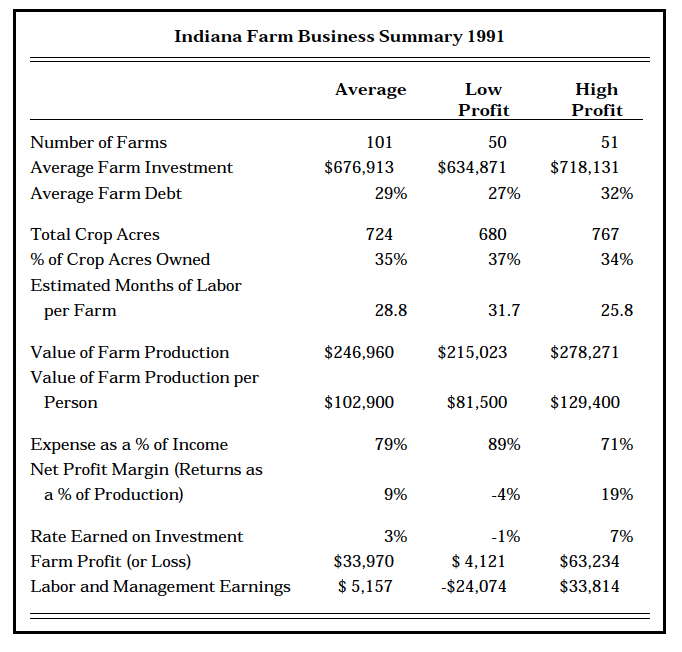
Table 1. Indiana Farm Business Summary 1991
Returns to labor, management, and equity averaged $63,234 for the high-profit half compared to $4,121 for the low-profit half. Allowing for a 6 percent return on their equity, the high-profit half had labor and management earnings of $33,814, compared to -$24,074 for the low-profit half. The return to total farm investment (return over the value of labor and management plus interest paid) for the high-profit half was 7 percent compared to -1 percent for the low-profit half. The high-profit half had 19 cents from each dollar of value of production to pay interest on borrowed money, reduce debt, and build up investments, compared to -4 cents for the low-profit half. Lower labor productivity on the low-profit farms appears to be a significant factor in the lower returns to this group. Part of the wide differences observed in 1991 may also reflect the wider than usual variation in crop yields that year.
The following results can be used as a benchmark to evaluate a farm business’s performance. If the farm’s financial performance resembles that of the lower half, some corrective actions may be needed. Just as tests for blood pressure and cholesterol may serve as a benchmark of a person’s health, these financial measures indicate the health of the farm business.
For a financial analysis of a farm business, see your County Extension Ag Agent to learn what information is needed. Ag Agents can arrange to use the computer programs FINAN or FINANX to analyze the farm business. Farm operators can learn what these factors mean and how to use them to improve the farm business. Further information on the 1991 farm records analysis is available in the 1991 Farm Business Summary (EC-666) at your local Purdue Cooperative Extension office.
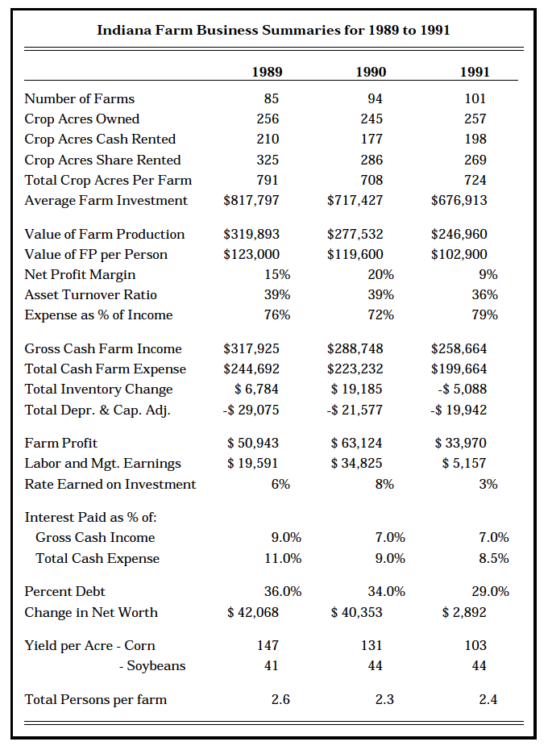
Table 2. Indiana Fam Business Summaries for 1989 to 1991
Farm earnings also vary from one year to another. The following table shows the average data for the past three years. Dry weather and lower livestock prices account for much of the decrease in earnings in 1991. Since weather conditions did not affect all farms equally, variations beyond the control of the farm manager should be considered in using these data