Rents for Indiana Pasture Land, Irrigated Land, Hay Ground, and On-Farm Grain Storage in 2017
April 15, 2018
PAER-2018-01
Authors: Craig L. Dobbins, Professor of Agricultural Economics and Kim Cook, Research Associate
![]()
![]()
![]()
![]()
![]()
Estimates for the current rental value of pasture land, irrigated land, hay ground, and on-farm grain storage in Indiana are often difficult to locate. For the past several years, questions about these items have been included in the Purdue Farmland Value Survey. The values from the June 2017 survey are reported here. Because the number of responses for some items is small, the number of responses is reported.
Averages for pasture rent, irrigated land, hay ground, and the rental of on-farm grain storage are presented in Tables 1, 2, 3, and 4, respectively. The rental rate for grain bins includes the situation where there is just a bin and the situation where there is a bin and utilities.
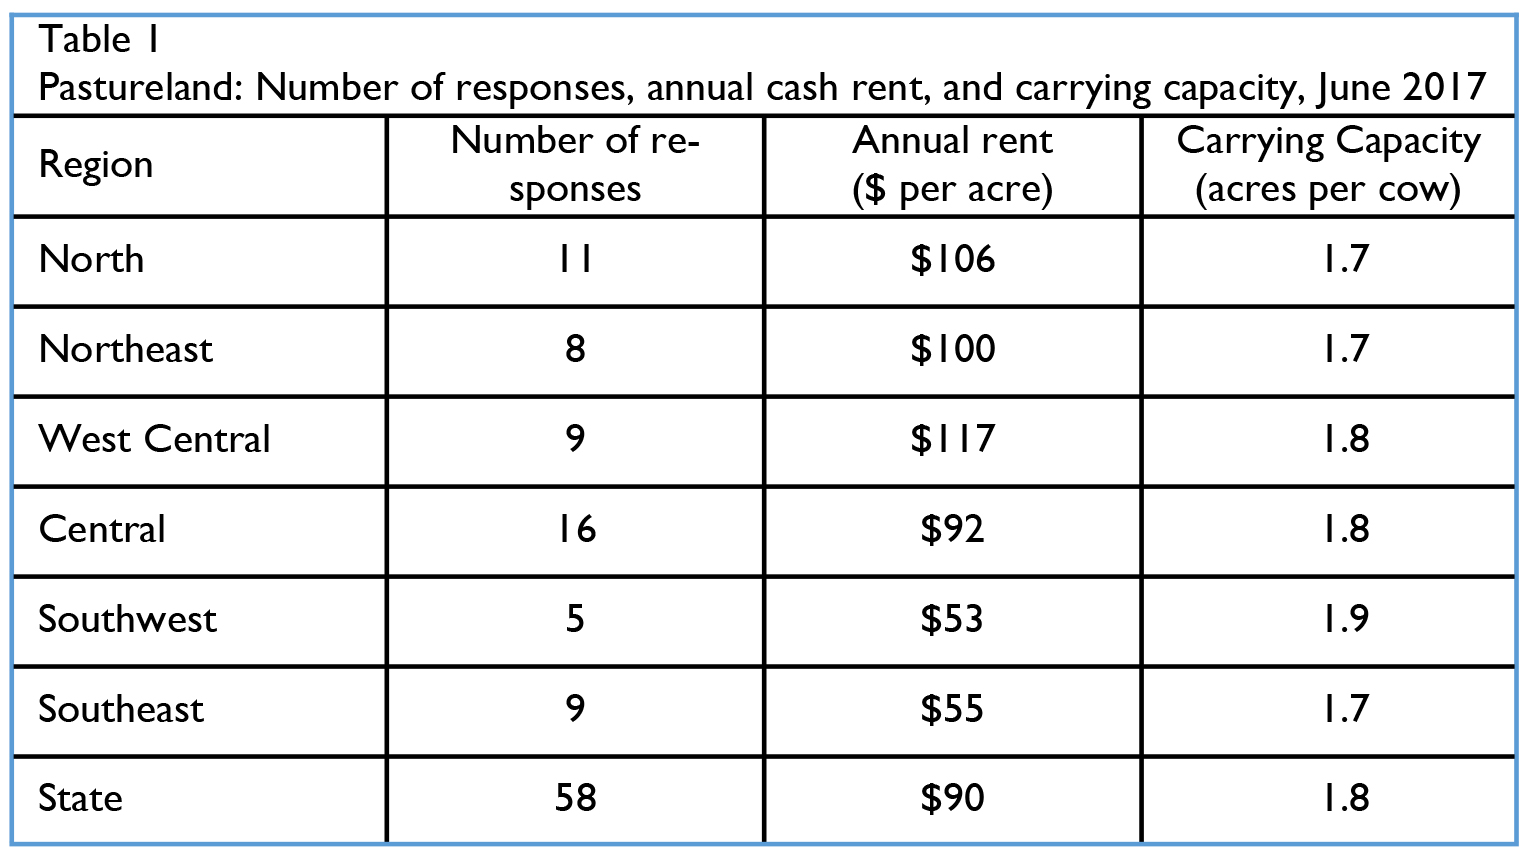
Table 1
Pastureland: Number of responses, annual cash rent, and carrying capacity, June 2017
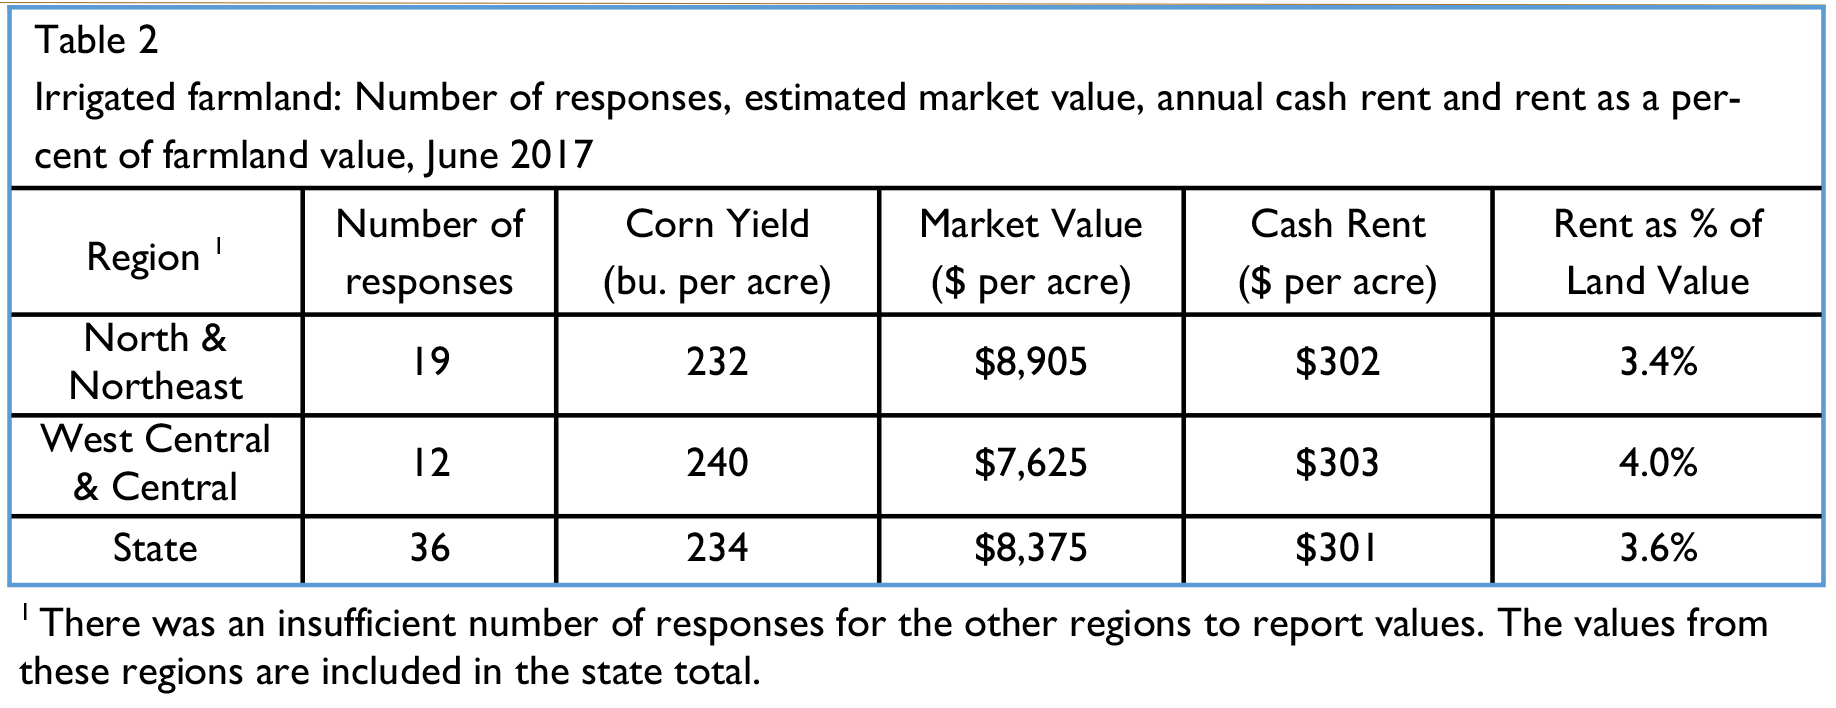
Table 2 Irrigated farmland: Number of responses, estimated market value, annual cash rent and rent as a per-cent of farmland value, June 2017
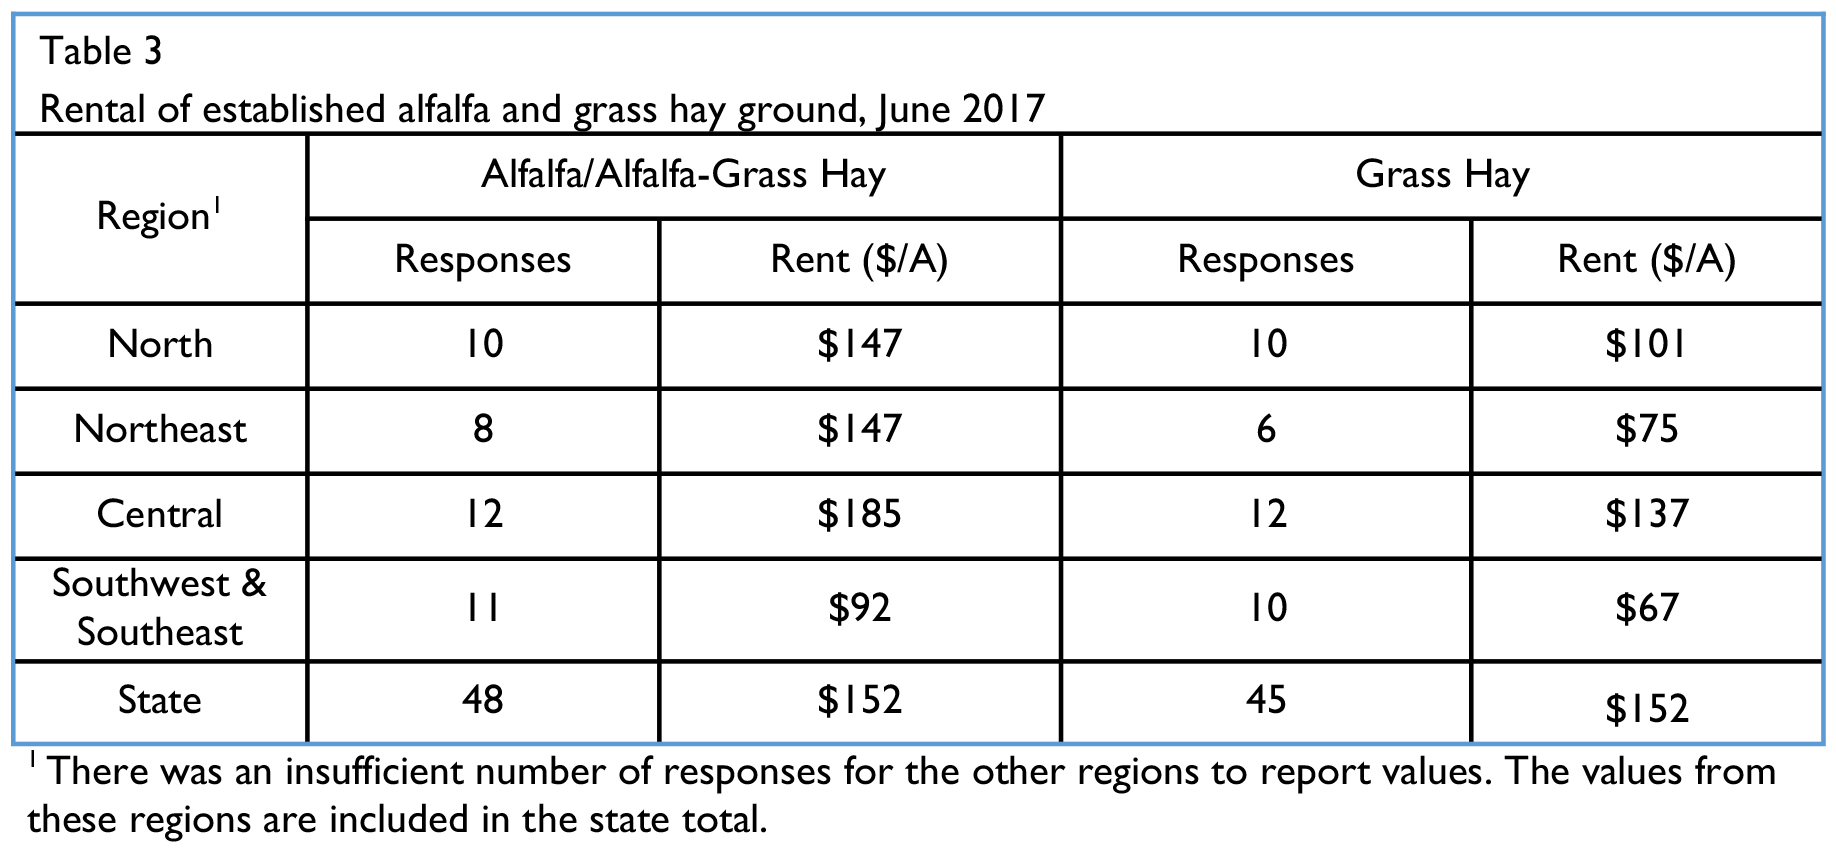
Table 3 Rental of established alfalfa and grass hay ground, June 2017
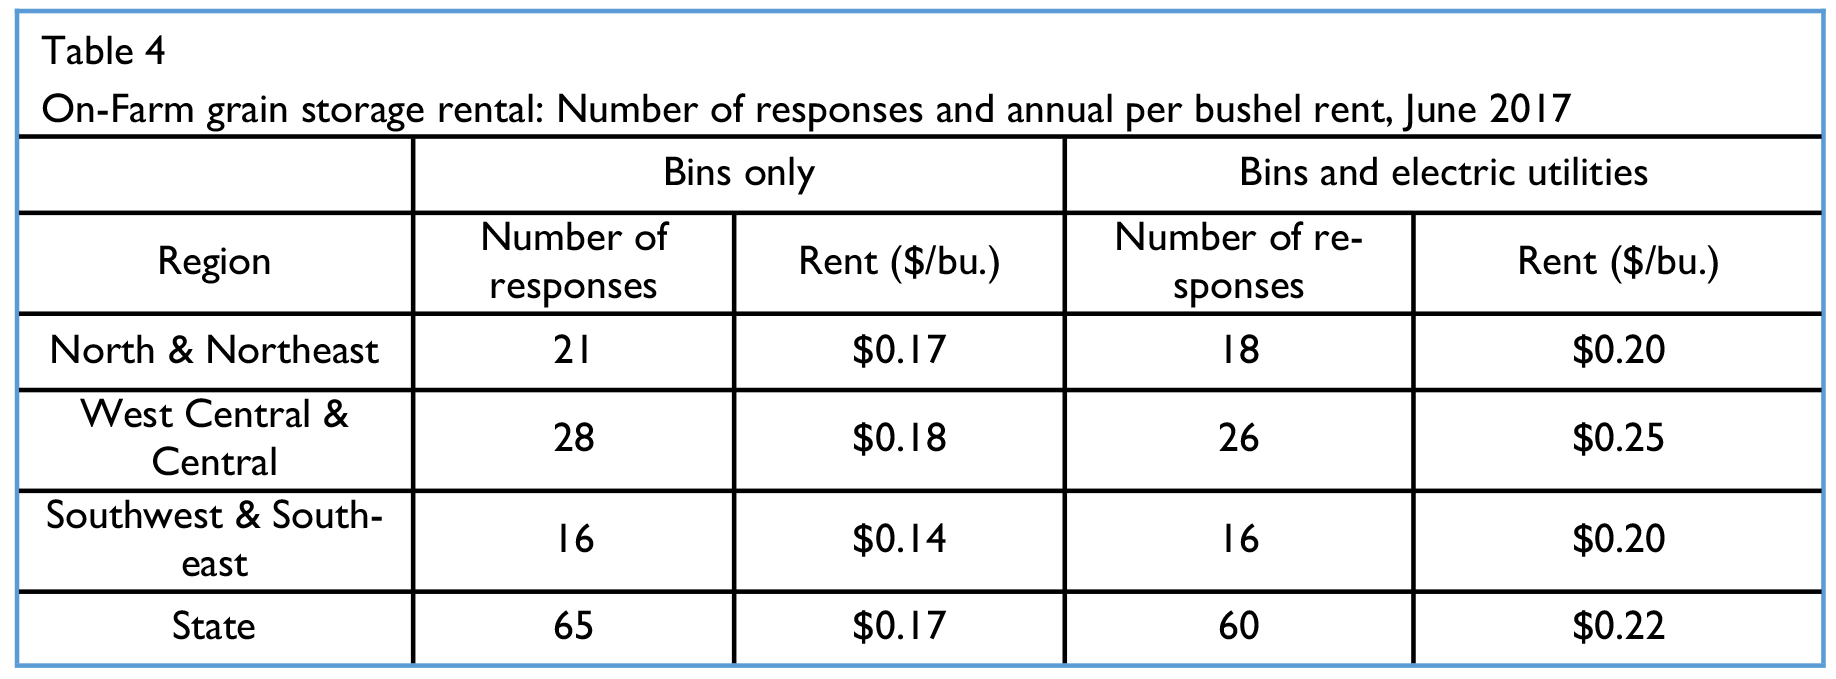
Table 4 On-Farm grain storage rental: Number of responses and annual per bushel rent, June 2017
Similar rental rates for 2015 and earlier years is in the August issue of the Purdue Agricultural Economics Report archive. The first year for reporting this information was 2006. For 2016, these rental rates are in the February 2017 issue.
![]()
![]()
![]()
![]()
![]()
