Results of the Indiana Farm Finance Survey for 1993*
December 16, 1993
PAER-1993-17
Freddie L. Barnard, Associate Professor; Kevin T. McNamara, Associate Professor; and Jeurene Falck, Computer Programmer
![]()
![]()
![]()
![]()
![]()
Summary and Implications
Key findings of the 1993 farm finance survey are that:
➤ On average, net farm income increased in 1992 compared to 1991. About 18% of all respondents in 1992 had net farm incomes of $20,000 and greater, up from the 15% reported for 1991. The percentage of all respondents in 1992 who had a net loss, 30%, is slightly lower than the 31% in 1991. The percentage of full-time farmers who reported a net loss in 1992 is 12%, down from 15% in 1991.
➤ The economic condition of farmers is influenced strongly by conditions in the nonfarm sector, because many part-time farmers depend on income from off-farm work. About 57% of all operators and 48% of all spouses reported off-farm earnings in 1992. The average total gross off-farm income for respondents reporting off-farm income in 1992 was about $34,238.
➤ The average debt-asset ratio for respondents in 1993 is about the same as the average ratio for respondents in 1992. The debt-asset ratio in 1993 is 22%, compared to 23% reported in 1992. The average debt-asset ratio in 1993 for respondents with GFI of$100,000 or more is 30%.
➤ The delinquency rate on farm real estate debt in 1993, 5%, is up from the 3% reported in 1992. The 9% delinquency rate on farm nonreal estate debt in 1993 is down from 11% reported in 1992, and is below the 14% in 1986 (the highest percentage during the
“Farm Crisis”) and the 14% in 1989 (year following the 1988 drought). The delinquency rates on farm real estate and nonreal estate debt in 1993 for respondents with GFI of $100,000 or more is 4% and 8%, respectively. The delinquency rate on real estate debt for respondents with$100,000 or more GFI is up from 1% in 1992.
➤ The percentage of Hoosier farmers who applied for a new farm loan or additions to existing farm loans for the 1993 crop year and were turned down, 12%, equals the 12% reported in 1992, but is below the 16% in 1986. The per-centage of full-time farmers who applied for a loan in 1993 and were turned down is 9%, down from 10% in 1992.
➤ The percentage of applicants in 1993 who applied for a loan but were turned down because the lender is not interested in making agricultural loans, 26%, is up from 13% in 1992. The percentage of respondents unable to get a loan for the 1993 crop, 3% of those who applied, equals the per-centage in 1992.
➤ The percentage of all respondents in 1993 with debt-asset ratios less than 40%, 77%, equals the percentage for 1992. The percentage of farmers in 1993 with gross farm incomes $100,000 or more and debt-asset ratios less than 40%, 65%, is slightly lower than the 66% for 1992.
➤ The percentage of all respondents in 1993 with debt-asset ratios greater than 70%, 5%, equals the 5% reported in 1992. The percentage of farmers in 1993 with gross farm incomes $100,000 or more and with debt-asset ratios greater than 70%, 5%, is down from 9% in 1992.
➤ The percentage of debt held by all respondents in 1993 with 100% or higher debt-asset ratios, 1%, is down from 2% reported in 1992 and considerably below the 10%in 1988, which is the highest per-centage reported since the survey started in 1985.
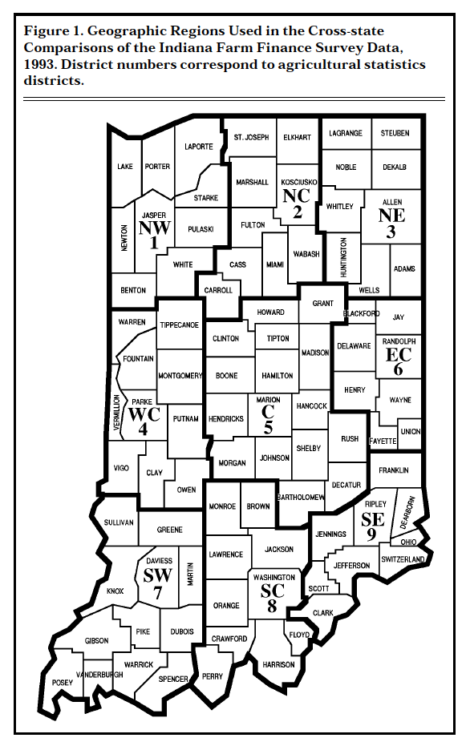
Figure 1. Geographic Regions Used in the Cross-state Comparisons of the Indiana Farm Finance Survey Data, 1993. District numbers correspond to agricultural statistics districts.
➤ During the past year, “reducing debt” was the most frequently mentioned adjustment for respondents, followed by “hiring others to do custom work with their machinery.” “Reducing debt” was the most frequently mentioned adjustment for the upcoming year, followed by “keeping more complete records.”
Data from the 1993 survey indicate financial stress levels are not as severe as during the “Farm Crisis” in 1985-86 or even following the 1988 drought. The primary reason for this finding is the continuing effort of Hoosier farmers to reduce costs, improve efficiency, and reduce risks. The results of those efforts are reflected in the financial strength of Hoosier farmers following the 1991 drought.
Introduction
Key indicators from the Indiana Farm Finance Survey for 1993 suggest that the financial condition of many Hoosier farmers showed a slight improvement from 1992. Delinquency rates for nonreal estate loans, debt-asset ratios, interest rates paid on farm debt, and the per-centage of debt held by producers with debt-asset ratios 70% and higher, all fell below 1992 levels. The percentage of respondents turned down when applying for a loan remained the same. The delinquency rate on farm real estate loans increased. Farmers continued to adopt management practices that increase their efficiency and reduce costs, and plan to continue these practices during the next 12 months.
Indiana Farm Finance Surveys were conducted in March-June in 1985, 1986, 1988, and yearly during 1990-1993, by the Departments of Agricultural Economics and Agricultural Statistics at Purdue University. An abbreviated survey of a smaller sample was conducted in February-March 1989. This article reports on the 1993 survey, com-pares the 1993 results to the findings for 1992 and to selected findings for previous years.
Procedure
In March 1993, a farm finance questionnaire was sent to about 5,000 Indiana farmers by the Department of Agricultural Statistics at Purdue University. Approximately 1,000 farmers who had responded to the 1992 farm finance questionnaire were included in the sample, together with a random sample of an additional 4,000 farmers. Three weeks after the initial mailing, a reminder questionnaire was mailed to nonrespondents. In May 1993, a telephone survey of 134 non-respondents was conducted mainly to determine if they differed from those who had responded, particularly whether nonrespondents were in worse financial condition than respondents. Respondents to the tele-phone survey farmed slightly fewer acres (320) than respondents to the mail survey (333). In general, financial measures were better for tele-phone respondents than for mail respondents; the delinquency rate for real estate and nonreal estate loans, the debt-asset ratio, and per-centage with debt-asset ratios exceeding 70% were all lower for telephone respondents. No other differences in characteristics could be detected in the responses obtained by telephone. Hence, the results obtained by telephone were included with those obtained by mail questionnaires to produce the summaries appearing in this article. 1,663 questionnaires contained usable responses for a response rate of 33%. However, as noted in the summary tables, the number of usable responses varied substantially from question to question.
Many results are reported below as averages for Indiana and for the northern, central, and southern regions of the state (Figure 1).
Data from the balance sheets of respondents are as of January 1, 1993. The data on loan delinquencies and loan turndowns are as of the spring of 1993. The data on farm and off-farm income are for calendar year 1992.
Background Statistics on Characteristics of Respondents
The background statistics appearing in Table 1 were used for assessing the representativeness of the sample and for making certain cross-tabulations reported later. The average age and average number of years of experience as a farm operator of respondents were 53 and 26 years, respectively, and did not vary substantially either across the three regions of the state or from the results of the 1992 survey (Table 1). Acreage operated and acreage owned per farm in the 1993 sample were similar to the 1992 sample. The number of acres operated and acreage owned tend to be larger than the average for all farms in Indiana.
Measures Describing the Financial Condition of Indiana Farmers
Several statistics from the Farm Finance Survey are used to draw inferences about the financial condition of Indiana farmers. Gross and net farm income, debt-asset ratios, delinquency rates for loans, loan rejection rates, and principal payments in addition to scheduled payments statistics are used in this section to characterize the general financial condition of Indiana farms.
Gross and Net Farm Income. Gross farm income is the income generated by a farm before any expenses are subtracted. About 24%of the respondents had gross farm incomes over $100,000 and are classified as full time farms (Table 2). In 1991, 22% of the sample farms were in the full time class. In southern Indiana, only 16% of the respondents had 1992 gross farm incomes greater than $100,000, compared to 26% and 28% in central Indiana and in northern Indiana, respectively. Because the financial characteristics of part-time farms differ from those of full-time farms, certain statistics will be presented separately in the article for farmers with gross incomes of $100,000 or more per year.
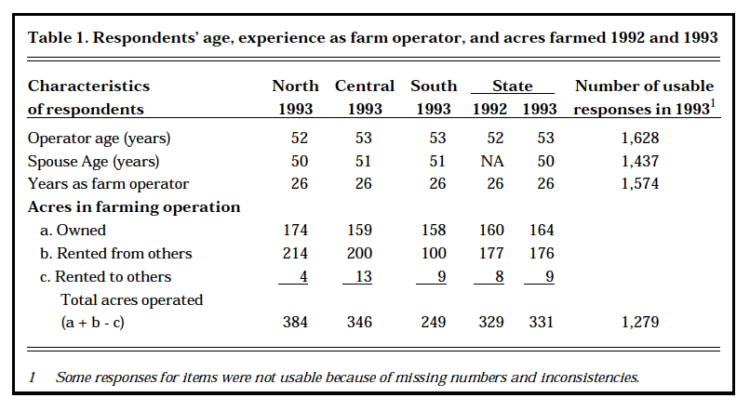
Table 1. Respondents’ age, experience as farm operator, and acres farmed in 1992 and 1993
Operators of many small, part-time Indiana farms obtained large percentages of their incomes from nonfarm sources. Only 32% of the farm operators with gross farm incomes of $100,000 or more worked at an off-farm job.
Respondents reported net cash farm income and net farm income figures for 1992. For purposes of the survey, net cash farm income was defined as total cash receipts minus total cash operating expenses. Net farm income was defined as net cash farm income minus depreciation. Neither of the two measures of farm income is adjusted to reflect changes in inventories.
Net farm income is commonly defined as the return to unpaid operator and family labor, management, and equity capital. Net cash farm income represents the amount of money available to farmers to repay the principal on intermediate and long-term debt, purchase capital assets, pay family living expenses, pay income taxes, and use as a financial reserve for the farming operation.
The delayed impact of the 1991 drought and the effect of low grain prices in 1992 can be seen by examining the 1992 earnings of respondents. About 23% of the respondents reported negative net cash farm incomes for 1992; and about 30% of the respondents reported negative net farm incomes (Table 2), nearly equal to the 23% and 31%, respectively, in 1991. These percentages were 17% and 24%, respectively, in 1990. The percentage of respondents which reported net losses in 1992 was largest in southern Indiana. The percentage of respondents with$100,000 or more of gross farm income (GFI) which reported net losses was 12%, down from 15% in 1991. The percentage was 9% in 1990.
About 82% of all respondents had net farm incomes of less than $20,000 in 1992, compared to 85% in 1991. Of those with $100,000 or more GFI, 49% reported net farm incomes less than $20,000, com-pared to 50% in 1991. Given family living expenses, these farmers probably would have had difficulty making debt payments from 1992 net farm incomes. Of course, some could have made debt payments using depreciation allowances and income obtained from nonfarm sources.
Many Indiana farmers supplement farm income with income from off-farm sources. The average gross off-farm income for all respondents reporting off-farm income in 1992 was $34,238.
Balance Sheet Information Used to Obtain Measures of Solvency. A balance sheet is a financial picture of an individual or firm at a point in time. It shows assets (what is owned), liabilities (what is owed), and owner equity. Respondents were asked to provide an estimate of their nonreal estate and real estate assets and liabilities as of January 1, 1993. Caution should be used when interpreting data about reported values. The value of total assets is the average amount reported by each respondent and no mechanism was employed for verifying the accuracy of these estimates. Hence, the real estate and farm machinery values, which made up a large portion of most respondents’ assets, are subject to biases, differences in evaluation methods, and levels of market knowledge.
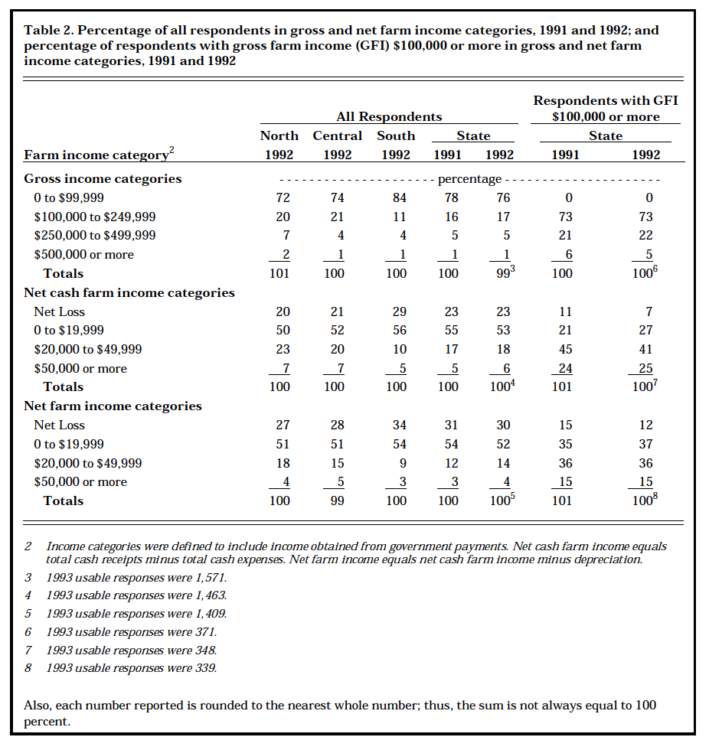
Table 2. Percentage of all respondents in gross and net farm income categories, 1991 and 1992; and percentage of respondents with gross farm income (GFI) $100,000 or more in gross and net farm income categorized, 1991 and 1992
The average value of farm real estate assets reported by respondents as of January 1, 1993 was $239,043, ranging from $203,174 in southern Indiana to $260,230 in central Indiana (Table 3). The average value of farm real estate assets reported by respondents with gross farm income (GFI) $100,000 or more was $447,146. Farm nonreal estate assets averaged $112,564 in value for the state, with the lowest value ($100,239) in southern Indiana and the highest value ($124,119) in northern Indiana. Farm nonreal estate assets averaged $229,115 for farmers with GFI $100,000 or more.
For all respondents, the average amount of real estate debt was $48,977, ranging from $37,715 in southern Indiana to $55,698 in central Indiana. The average amount of real estate debt for farmers with GFI $100,000 or more was $110,994. The nonreal estate debt (state aver-age) was $22,239, varying from $16,587 in southern Indiana to $27,752 in northern Indiana. The average amount of nonreal estate debt for farmers with GFI $100,000 or more was $58,328.
The owner equity (total assets minus total liabilities) of respondents averaged $280,391 for the state. It was highest in northern Indiana ($294,576) and lowest in southern Indiana ($249,111)
(Table 3). The average owner equity of respondents with GFI $100,000 or more was $506,939.
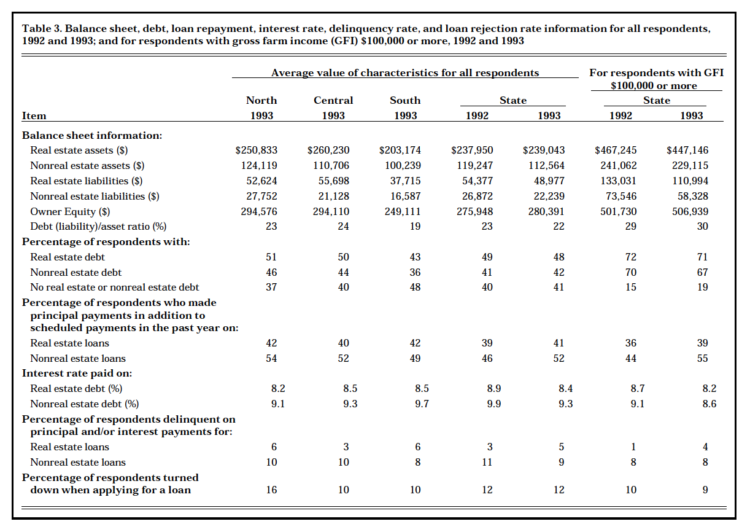
Table 3. Balance sheet, debt, loan repayment, interest rate, delinquency rate, and loan rejection rate information for all respondents, 1992 and 1993; and for respondents with gross farm income (GFI) $100,000 or more, 1992 and 1993
The percentage of all respondents carrying real estate and nonreal estate debt in 1993 and the average interest rates paid by the respondents on the debt are also listed in Table 3. Note that about 41% of all respondents reported zero debt in 1993. This zero debt figure is about 1 percentage point higher than the comparable number for 1992. About 48% of the respondents in southern Indiana reported they had no debt on January 1, 1993. About 19% of the respondents with $100,000 or more of gross farm income had zero debt in 1992, which is 4 percentage points higher than the figure report-ed in 1992 (15%) and considerably lower than the percentage of all respondents.
Nearly 41% of the respondents with debt made principal payments on real estate loans in addition to scheduled payments during the past year. The comparable figure was 52% for nonreal estate loans. Respondents with debt and $100,000 or more GFI also paid ahead; about 39% and 55% made principal payments in addition to scheduled payments on real estate and nonreal estate loans, respectively.
Respondents reported average interest rates on real estate and non-real estate debt in 1993 of 8.4% and 9.3%, respectively. Rates paid by respondents with $100,000 or more GFI were lower for both real estate and nonreal estate debt in 1993 aver-aging 8.2% and 8.6%, respectively.
Solvency measures describe the amount of money a farmer would have remaining after all assets are converted to cash and debts retired. Solvency ratios measure the relationship between claims on the business (liabilities) and either total assets or owner equity. Using debt-asset ratios obtained in this survey as an indicator of the financial condition of Indiana farmers requires caution. The total debt component of the ratio (liabilities) does not take into account how the debt is structured. Debt structure impacts farmers’ ability to service debt, and consequently, their financial condition.
Problems discussed earlier about the difficulty of establishing farm asset values also impact the reliability of the debt-asset ratio. Calculations of change in owner equity can be the result of a profit or loss in a previous year and/or the result of an increase or decrease in the asset values. Such a change also influences the ratio. Without an income statement and the knowledge of asset values on the previous balance sheet, it is difficult to identify the reasons for the change in owner equity for an individual operation.
The statewide average debt-asset ratio of 22% as of January 1, 1993 (Table 3) was about the same as reported in 1992 (23%). The ratio was highest in central Indiana (24%) and lowest in southern Indiana (19%). The average debt-asset ratio for full-time farmers ($100,000 and more GFI) was considerably higher at 30%.
Guidelines for using debt-asset ratios to describe the financial stress on farmers are:
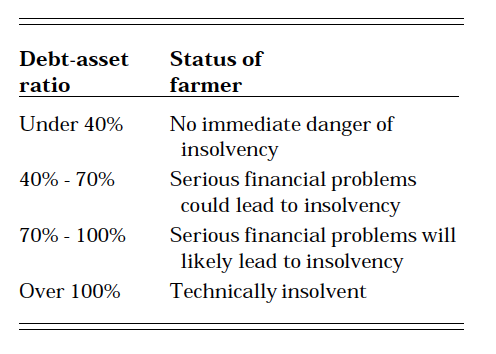
Debt-Asset Ratio Guidelines
About 23% of those responding had debt-asset ratios exceeding 40%in 1993. This is slightly lower than the 24% found in 1992, which is much lower than the 32% in 1985,(the highest percentage during the “Farm Crisis”). About 5% had debt-asset ratios exceeding 70% in 1993, down from 6% in 1992 and 13% in 1985. The guidelines discussed above suggest that serious financial problems could cause up to 5% of all Indiana respondents to become insolvent; however, this tends to oversimplify the problem. For example, some skilled managers who carry a relatively small proportion of their debt in the form of land debt may be in satisfactory financial condition despite having a debt-asset ratio exceeding 70%. Additional analyses involving subsets of respondents and cross-tabulations will be reported later to assess more fully the debt-asset ratio figures.
About 35% of respondents which reported gross farm incomes of$100,000 or more had debt-asset ratios exceeding 40% in 1993, up slightly from the 34% in 1992. About 5% had debt-asset ratios exceeding 70% in 1993, down from the 9% in 1992, and still below the 13% in 1989 (the highest percentage during the “Farm Crisis”). The guidelines discussed previously suggest that about 5% of Indiana respondents with $100,000 or more gross farm income could face extreme financial difficulties.
Delinquency Rates. A second measure of financial condition is the rate of delinquency of loan payments. Those respondents having real estate loans (48% of all respondents) were asked if their principal and interest payments were current. For all respondents who had real estate debt, 5% said “no” (Table 3). This is 2 percentage points higher than the 3% reported in 1992, but nearly 4 percentage points lower than the 9% reported in 1986 (the highest percentage during the “Farm Crisis”). Also, about 50% of those who were delinquent on their real estate loans were current on the interest payments and delinquent only on principal payments.
About 9% of the respondents having nonreal estate loans (42% of all respondents) indicated that their payments were not current (Table 3), about two percentage points lower than in 1992. Comparable figures for 1985 and 1986 were 22% and 14%, respectively. About 65% of those who were delinquent on their nonreal estate loans were current on the interest payments and delinquent only on principal payments.
Delinquency rates for respondents with gross farm incomes $100,000 or more were lower than the delinquency rates for all respondents. The delinquency rate for real estate loans was 4%, up from the 1%reported in 1992. The delinquency rate for nonreal estate loans equals 8% in 1993, the same as reported in 1992. Also, about 45% of those who were delinquent on their real estate loans were current on the interest payments and delinquent only on principal payments. That percentage for nonreal estate loans was 72%.
Loan Requests Rejected. A third indicator of financial condition is the percentage of loan applications turned down by a lender. Respondents were asked if they were turned down for a 1993 farm loan and, if so, why the loan request was rejected. Only results for respondents who actually applied for a loan were considered. Of the 312 respondents indicating they applied for a loan (21% of all respondents), about 12% (2.5% of all respondents) indicated they were turned down. This figure equals the 12% in 1992 (Table 3), but is below the highest percentage reported during the “Farm Crisis” (16%).
Respondents were asked to indicate the reasons their loan applications were rejected. Their responses, ranked by frequency, appear in the following schedule:
The percentage of respondents who indicated they were turned down because the lender is not interested in making agricultural loan is 26%.
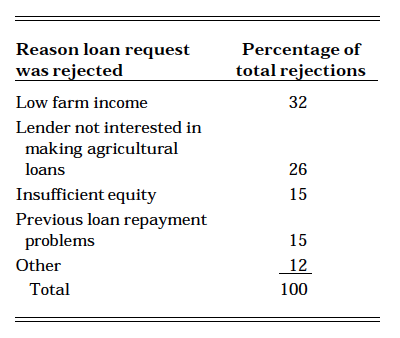
Loan Rejection Reasoning & Statistics
Respondents whose loan requests were rejected were asked if they eventually obtained loans for the 1993 crop year. Sixty-nine percent of these respondents said “yes.” Thus, about 3% of those who applied for loans for the 1993 crop year were unable to get loan funds, which is equal to the 3% in 1992. However, it is important to note this is less than 1% of all 1,540 respondents. The sources of loan funds for the 69%who eventually received loans are ranked by frequency:
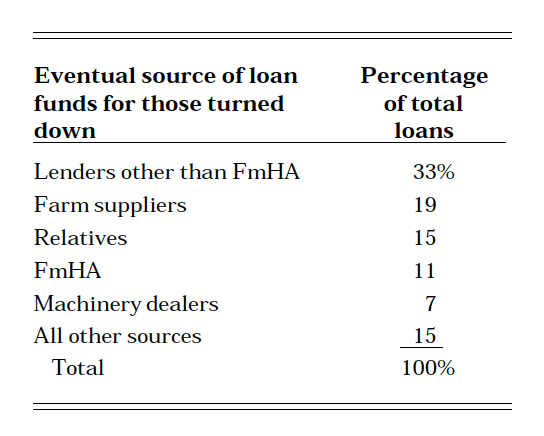
Loan Sources Table
The 11% of the respondents who received loans from FmHA is lower than the 24% reported in 1992. This finding probably reflects the impact of the 1991 drought and the need for an increased number of borrowers to seek funds from FmHA in 1992.
Forty percent of respondents with$100,000 or more GFI applied for a 1993 farm loan. Of that number, about 9% were turned down, less than the 10% reported in 1992. Only four of those turned down indicated denial because the lender was not interested in making farm loans, and only one person turned down for a loan was unable to get loan funds.
During the past 12 months, Indiana farmers have expressed concerns to the authors about the availability of loan funds. Farmers are concerned that some lenders in Indi-ana have stopped making loans to farmers and that lenders have there-fore restricted loan funds for farmers.
Consequently, further analysis was conducted on the twelve individuals who indicated they were turned down because the “lender is not interested in making agricultural loans.” All twelve respondents are located in the northern and central districts. Eight of the twelve had gross farm incomes less than $100,000. Only 10 respondents provided data on net farm income. Nine of the 10 had net farm income in 1992 less than $20,000. The average debt-to-asset ratio for the nine answering the question was 34.3%, and all had debt-to-asset ratios less than 70.0 percent. Eight had real estate loans and all were current with their payments. Eleven had nonreal estate loans, but only seven were current with their payments. Eight of the nine respondents who answered the question did acquire loan funds from another lender: Three from lenders other than FmHA; one each from FmHA, input suppliers, and machinery dealers; and two from other sources.
Thus, the majority of the respon-dents who indicated they were turned down for a loan because, “the lender is not making agricultural loans,” were part-time farmers who had net farm income less than $20,000, for the most part, and had a debt-to-asset ratio less than 70.0%.
Additional Information on the Incidence of Farm Financial Stress
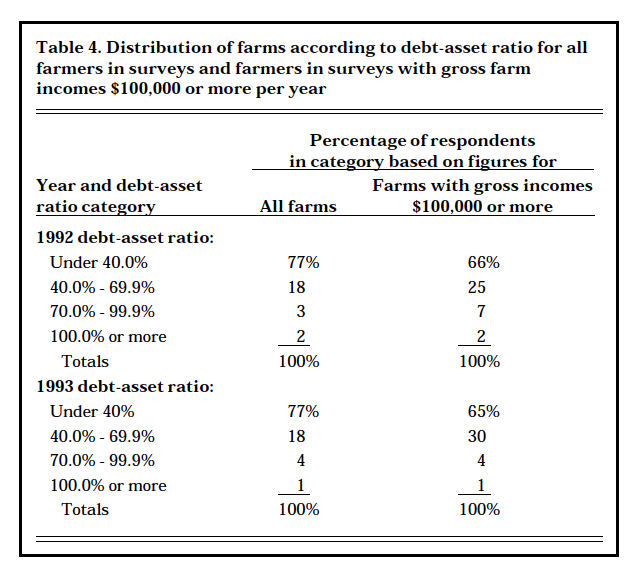
Table 4. Distribution of farms according to debt-asset ratio for all farmers in surveys and farmers in surveys with gross farm incomes of $100,0000 or more per year
In this section, debt-asset ratios for all farms and those with gross farm incomes of $100,000 or more are presented. Other statistics relate debt-asset ratios to debt differentiated by gross income levels.
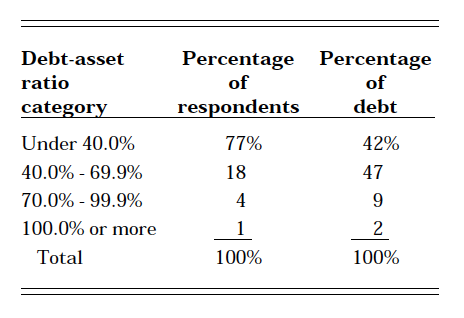
Debt-Asset Ratios by Size of Farm. Table 4 shows the percentage of all farmers and the percentage of farmers with gross incomes of $100,000 or more per year by debt-asset ratio in 1993. Less than one-fourth of all respondents had debt-asset ratios of 40% or more com-pared to about 35% of those with gross incomes of $100,000 or more. The percentage of respondents in this higher debt category equals the percentage for all farmers in 1992, but increased about 1 percentage point for those with the higher gross incomes (Table 4).
Amount of Debt Owed by Respondents in Different Debt-Asset and Gross Farm Income Categories.Debt is becoming less concentrated in the hands of those respondents in the higher debt-asset ratio categories. As noted in the figures for 1993, about 11% of the debt was owed by respondents with debt-asset ratios of 70% or higher and about 2% of the debt was owed by respondents who were technically insolvent. The 2% is down from 4%in 1992, and from 10% reported in 1988. The respondents who are technically insolvent and some respondents in the 70.0% to 99.9%debt-asset ratio category presumably are vulnerable to future financial adversities.
Farm Adjustments
Respondents presumably vulnerable to future financial adversities
Farmers were asked to review a list of 23 possible adjustments and to identify the adjustments they had made during the past 12 months and those they expected to make during the next 12 months. Respondents could also add adjustments to the list. The adjustments identified by respondents, ranked according to frequency of mention using the state figures for all respondents, appear in Table 5. Each adjustment (made or expected to be made) which accounted for less than 5% of the total, was lumped together in the “other adjustments” item in Table 5. The adjustments indicated by respondents with $100,000 or more GFI are also reported in Table 5.
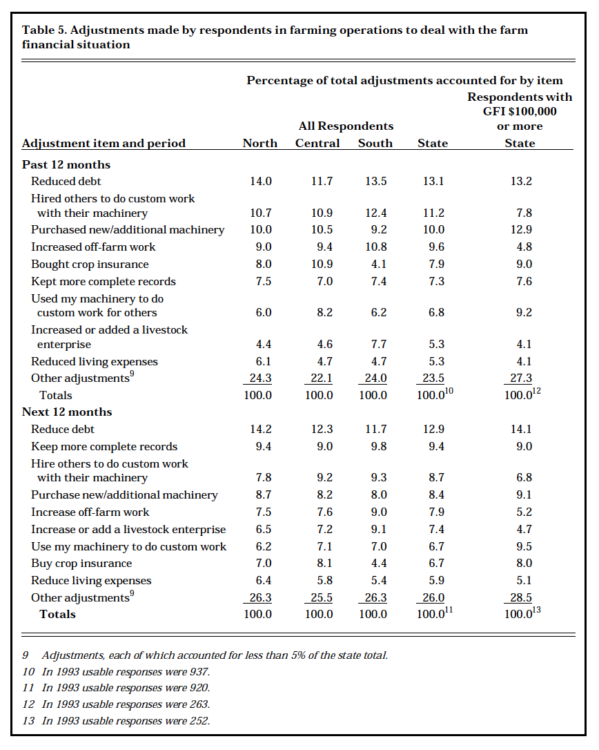
Table 5. Adjustments made by respondents in farming operations to deal with the farm financial situation
Past 12 Months. The adjustments made during the previous 12 months that were most frequently mentioned by respondents were “reduced debt,” “hired others to do custom work with their machinery,” “purchased new/additional machinery,” “increased off-farm work,” “bought crop insurance,” “kept more complete records,” and other adjustments (Table 5). Several of the adjustments made during the past 12 months can be categorized as changes which helped them to reduce costs (e.g., those relating to reducing debt, reducing living expenses, and hiring others to do custom work), to diversify and reduce risks (e.g., used my machinery to do custom work for others, adding or expanding livestock enterprises, increasing off-farm work and buying crop insurance), and to more accurately measure farm costs and returns (e.g., keeping more complete records).
Respondents with $100,000 or more GFI placed much more emphasis on certain adjustments than respondents in general. Those adjustments include “reduced debt,” “purchased new/additional machinery,” “used my machinery to do custom work for others,” and “bought crop insurance.” Respondents with $100,000 or more GFI placed less emphasis on “increased off-farm work,” “reduced living expenses,” and “increased or added a livestock enterprise” than all respondents.
Next 12 Months. Many of the adjustments planned for the next 12 months by the respondents are similar to those made during the previous 12 months and to those reported on previous surveys.
“Reducing debt” topped the list followed by “keeping more complete records,” “hiring others to do custom work with their machinery,” “purchasing new/additional machinery,” “increasing off-farm work,” and “increase or add a livestock enterprise.” Several of the adjustments planned for the next 12 months can be categorized as changes which will help them reduce costs (e.g., reducing debt, hiring others to do custom work with their machinery and reducing living expenses), more accurately measure farm costs and returns (e.g., keeping more complete records), diversify and reduce risks (e.g., increasing off-farm work, increasing or adding a livestock enterprise, buying crop insurance and using my machinery to do custom work for others) and upgrade capital (e.g., purchasing new/additional machinery).
As was the case for the past 12 months, respondents with $100,000 or more GFI placed much less importance on “increasing off-farm work,” “reduce living expenses,” and “increase or add a livestock enterprise” than all respondents. “Operating more land” was planned as an adjustment by more of these farmers (6.2%) than all respondents.
* Financing for this study was provided by a Crossroads Project of the Purdue Cooperative Extension Service and the Purdue Agricultural Experiment Station. Thanks are extended to the farmers who completed the questionnaires and to Ralph W. Gann, head of the Department of Agricultural Statistics at Purdue University, for helpful suggestions regarding design of the questionnaire and for supervising the collection of the sur-vey information in March-May 1993. Helpful comments on the manuscript by Lee F. Schrader, John E. Kadlec, Christopher A. Hurt, and Gene W. Danekas are acknowledged.
![]()
![]()
![]()
![]()
![]()
