Returns to Corn Storage in Recent Boom Years
June 13, 2014
PAER-2014-6
Chris Hurt, Professor of Agricultural Economics
![]()
![]()
![]()
![]()
![]()
Cropping agriculture entered a new era of much higher and more volatile prices starting with the 2006 crop. U.S. corn prices for the seven crops from 2006 through 2012 averaged $4.73 a bushel which was more than double the $2.06 of the previous seven years covering the 1999 through 2005 crops. While the average price more than doubled, the volatility of annual prices nearly tripled.
This article examines the impacts on storage returns both for on-farm and commercial storage space in the most recent seven year period compared to the more stable seven year period represented by the 1999 to 2005 crops. The study uses weekly cash corn prices for the 14 year period. These weekly prices are the mid-week corn bids of a unit train loading elevator located in central Indiana.
Many producers measure storage returns by observing whether the cash bid moves up enough after harvest to cover their storage costs and that simple concept is used here. The harvest price was considered to be the average price at the elevator in the last-half of October each year. On-farm storage costs considered interest costs only. The interest rate was the six month average certificate of deposit (CD) rate through the 2007 crop. Then, CD rates moved very low, so starting in 2008, the prime interest rate was used. The prime interest rate has been 3.25% since January of 2009. For on-farm storage, there is no-costs assigned to the grain handling and conditioning equipment, to the storage bins, nor to labor costs, etc. This means that the on-farm storage returns reported here can be considered as the amount per bushel available to cover ownership costs for dryers, legs, storage bins, labor, insurance, utilities and a return for management of these facilities.
Commercial storage costs assume the same interest costs as on-farm storage, but add commercial storage charges. Those increased over time. In 1999, they were assumed to be a 12 cents per bushel flat charge for storage from harvest until December 31 and then an additional 2 cents per bushel per month starting in January. By the 2012 crop, they were a 17 cent per bushel flat charge until December 31 with a 3 cent per bushel per month charge starting in January.
Corn Storage Returns: The Normal Condition
Economic logic suggests that over a period of years, prices need to move upward after harvest by an amount that will cover storage costs. If the upward price movement during the storage season is not enough to cover costs, then producers and grain industry managers would observe this, and over time, sell more grain at harvest time and thus less during the storage season. This action would tend to cause harvest prices to drop and prices later in the storage season to rise. Thus, over a series of years, the price rise during the storage season would tend to driven to be equal to the storage costs. This equality might not occur in any given year, but over time should approach this equilibrium-at least on average.
Storage costs are relatively constant, tend to be known at the time the grain is put into storage, and accumulate throughout the storage season. A manager can predict with reasonable accuracy the storage costs throughout the storage season. However the cash price pattern through the storage season is less certain. Thus it is the eventual pattern of cash prices that largely determines whether the year turns out to provide favorable storage returns or not.
This pattern of cash bids rising after harvest to equal the costs of storage can be seen in Figure 1 which represents the low priced and relatively stable price period for the 1999 through 2005 crops. The price per bushel is on the vertical axis and the weeks of the storage season are on the horizontal axis. Nov 1-2-3-4-5 represent the five weeks of November, etc. The lines in the graph for “Commercial” and “On-Farm” represent the harvest price plus the accumulating storage costs across the storage season.
On average, cash prices moved up quickly in the first month after harvest, and then continued to move higher-but at a slower rate until mid-May. It is also interesting to note that the price gain was roughly equal to the costs of commercial storage space where the full costs of interest, facility costs, labor, utilities, etc. are included. Figure 1 thus represents the normal situation that is expected over time suggested by economic logic.
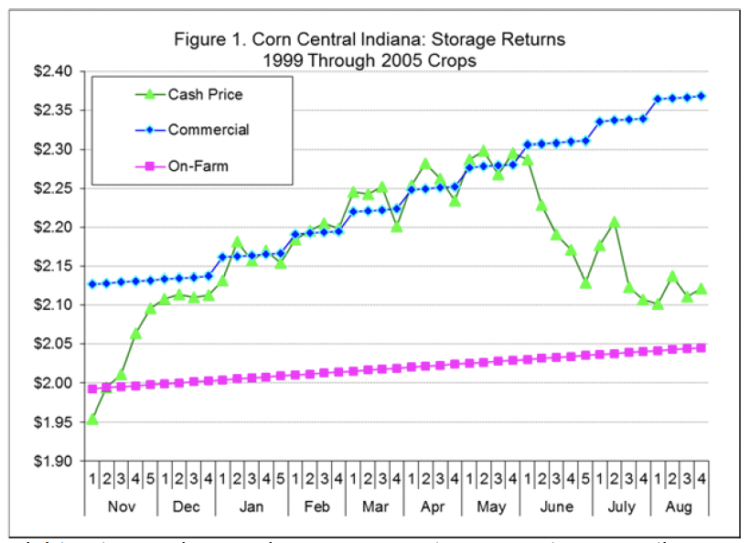
Figure 1. Corn Central Indiana: Storage Returns 1999 through 2005 Crops
Two more observations are helpful for those trying to decide how long to store under fairly normal conditions. First, for both on-farm and commercial storage, most of the positive returns above storage costs were earned by mid-March. From mid-March to early June, market prices moved upward at roughly the rate of increasing costs. This is particularly helpful to producers storing on-farm who would like to get on-farm bins emptied in the late-winter before country roads are posted and before spring planting activities get underway.
The second observation is that cash prices-on average-tended to decline after mid-May into the summer while storage costs continued to move upward. This process of falling prices and rising storage costs quickly reduces storage returns for storage into the summer-on average.
Why would cash prices tend to fall into the summer-on average? The answer is most likely related to the growing influence of the new-crop production prospects after the new-crop is planted. In the long-run, most summers do not provide poor growing weather that sharply reduces the expected size of the crop.
As an example, in the 20 years representing the 1986 through 2005 crops, central Indiana cash corn prices decreased from May to July in 70% of the years. On average this price decrease was 3.5% from May to July. Thus, farmers and others who hold corn in storage in May, may tend to hold that corn awaiting a clearer picture of whether the summer growing season will bring harmful weather. They also tend to know that if summer weather does become adverse, prices on old-crop inventory could rise sharply. Since the long-run tendencies are for prices to decline into summer, this hypothesis suggests that those holding inventory in the spring tend to over-anticipate the chances for harmful weather, and/or they over-anticipate the upward price impact of harmful weather.
Storage Returns 2006 to 2012 Crops
Not surprisingly, corn storage returns look different in the most recent period of higher and more volatile prices for the 2006 to 2012 crops as shown in Figure 2. First, cash prices-on average moved up more quickly than commercial storage costs providing strong positive returns even for those storing in commercial facilities. Secondly, the volatility in these average prices is apparent moving up and down. This implies that the decision of which week to price would have had a substantial impact on storage returns. Third, prices overall tended to rise into mid-July, rather than begin a downward slide after mid-May.
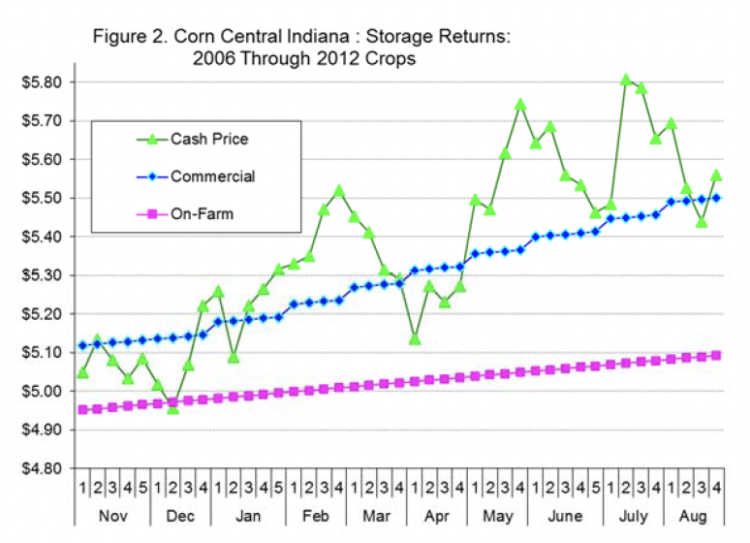
Figure 2. Corn Central Indiana: Storage Returns 2006 through 2012 Crops
These results are fairly easily explained by the unusual conditions and events during this seven year period that vary from the norm. At the start of the 2006 marketing year, cash price were $2.07 a bushel and moved as high as $7 in early 2008 with critically short world inventories. Then world recession later in 2008 and 2009 dropped cash prices back to near $3. This was followed by short production crops in 2010 and 2011, and then in 2012 by the most severe drought since 1988 with cash prices climbing to $8.50 at this location. Intertwined in these events was the rapid buildup of corn use for ethanol from the 2006 to 2010 crops.
The details of storage returns by crop year as shown in Figure 3 are helpful in understanding this unusual seven year period. There were four crops that had high storage returns. Those were the 2006 and the 2007 crop when prices were rising from $2 to $7 as world inventories tightened. The other two years of extremely high returns were 2010 and 2011. Both of these had short-crops from adverse weather in the year following harvest that caused old crop prices to rise sharply the next summer.
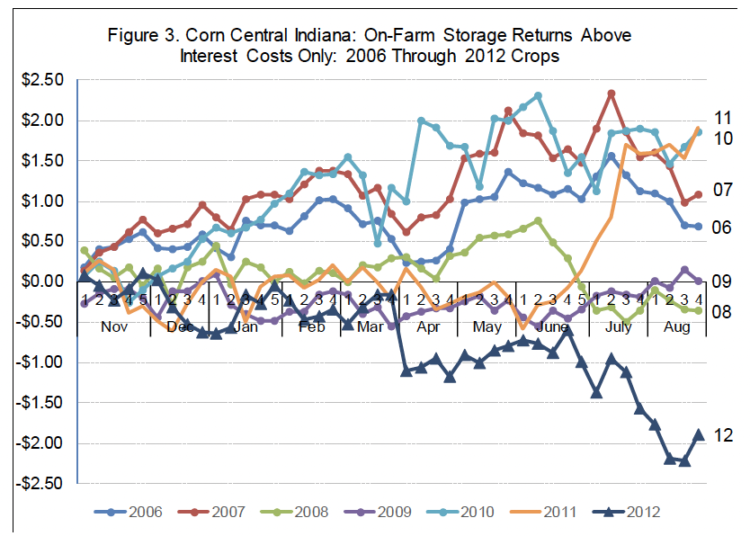
Figure 3. Corn Central Indiana: On Farm Storage Returns Above Interest Costs Only: 2006 through 2012 Crops
Finally the 2008 and the 2009 crops had very low returns to storage as the world recession caused price weakness. This was an unusually set of non-normal conditions for a seven year period. In addition, they occurred at a time when inventories were unusually low. For grains, tight stocks periods tend to exaggerate price swings from a given event like a 5% decline in production.
Lessons from Two Time Periods for Future Storage Returns
Comparing corn storage returns for a more normal and more stable period represented by 1999 to 2005 crops with the more recent and more volatile 2006 to 2012 crops provides some insight into expectations for future storage returns. Figure 4 provides these comparisons of on-farm storage returns above interest costs only. These returns above interest can be viewed as the returns available for ownership of on-farm bins, grain handling and conditioning equipment, and the labor and utilities invested in on-farm handling and storage.
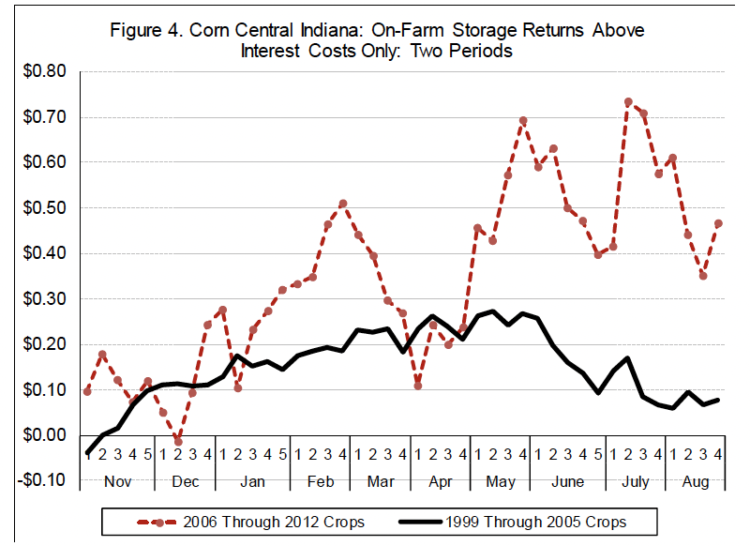
Figure 4. Corn Central Indiana: On Farm Storage Returns Above Interest Costs Only: Two Periods
For the early period these returns were about 25 to 30 cents per bushel for storage into the period from mid-March to Mid-May (see the solid line in Figure 4). In the more recent period that averaged closer to 30 to 50 cents per bushel for storage into mid-March to early June (see the dashed line). In the more recent period there was much more volatility in returns and which week was chosen to price would have had a significant impact on storage returns.
In the early period, cash prices and storage returns tended to go down starting in early June. For the more recent period, prices and returns both had one more upward surge into early July. This was likely due to the unusually large percentage of the years (four of the seven years) that had below trend yields which caused summer prices to rise.
In the future, corn inventories are expected to increase somewhat and this will tend to moderate corn prices from extreme highs. In addition, it will tend to cause corn prices to have less overall volatility than was experienced in the 2006 to 2012 crop years. Returns to cover grain handling, storage facilities, labor and utilities will also likely moderate somewhat. In the more stable period those averaged about 8% to 10% of the corn price. If corn were to average $4.50 a bushel in the future as an example, this would mean average returns of 36 cents to 45 cents per bushel per year to cover the costs of bins, handling equipment, labor and utilities, etc. At best, this is only a general guideline.
Finally, it is clear from the yearly returns shown in this article that averages over time should be a starting point as a general guideline of how long to store. Prices tend to rise in the storage season, but, they go up a lot more if the overall market is in a bullish situation as demonstrated by the 2006 and the 2007 crops. Prices can also go up a lot in the summer following harvest with adverse growing weather. However that only tends to occur about 30% of the time-or alternatively does not occur about 70% of the time. Prices can go down during the storage season when there are overall bearish events as demonstrated by the impact of the world recession on the 2008 and 2009 crops. And prices can also go down a lot through the storage season when moving from a very short production crop to a more normal crop as demonstrated by the 2012 crop price pattern.
A routine storage strategy would follow the same storage and pricing pattern each year. An example would be to put corn in the bin at harvest and price it all in mid-March. This is the type of strategy that the results of this study report on.
Alternatively, a discretionary storage strategy could be different each year based upon the unique signals in the marketplace that year as determine at the discretion of the manager. Discretionary storage strategies become more complex and require an understanding of futures carrying charges, expected basis levels, and may include a willingness to consider the outlooks for weather, southern hemisphere production, and macroeconomic events.
One simple adjustment to the routine storage strategy is to NOT STORE in years of extremely short production, like the 2012 drought crop. In these years prices tend to peak around harvest time and then tend to have a “long tail” moving lower through the storage season. If one had sold the 2012 crop at harvest rather than storing, they would have been about $1 a bushel better off than storing on-farm and selling the following spring.
![]()
![]()
![]()
![]()
![]()