Short-Term Effects of COVID-19 on U.S. Soybean and Wheat Exports
April 13, 2020
PAER-2020-04
Author: Mindy Mallory, Associate Professor, Clearing Corporation Charitable Foundation Endowed Chair of Food & Agricultural Marketing
The pandemic caused by Covid-19 will likely be the defining global crisis for at least a generation. The devastating economic consequences of shelter-in-place orders are second only to the heart-wrenching loss of life and human suffering caused by the illness itself. As economies all over the globe shutter for an unknown length of time, the crisis is impacting every aspect of the human condition and the global economy.
The issues exposed relating to broad health, economic, and agricultural policy will take years to work through. For now, an awareness of potential short term impacts can help navigate the next few weeks to months. In this article I consider very near term impacts the COVID-19 crisis could have on U.S. exports of soybeans and wheat. Exports of soybeans and wheat especially could be impacted by two aspects of the crisis: case flare-ups during peak seasonal export times for major exporters and geopolitical tensions sparked by the virus. As with everything related to the virus, the situation is changing daily and impacts are extremely difficult to forecast.
Soybeans
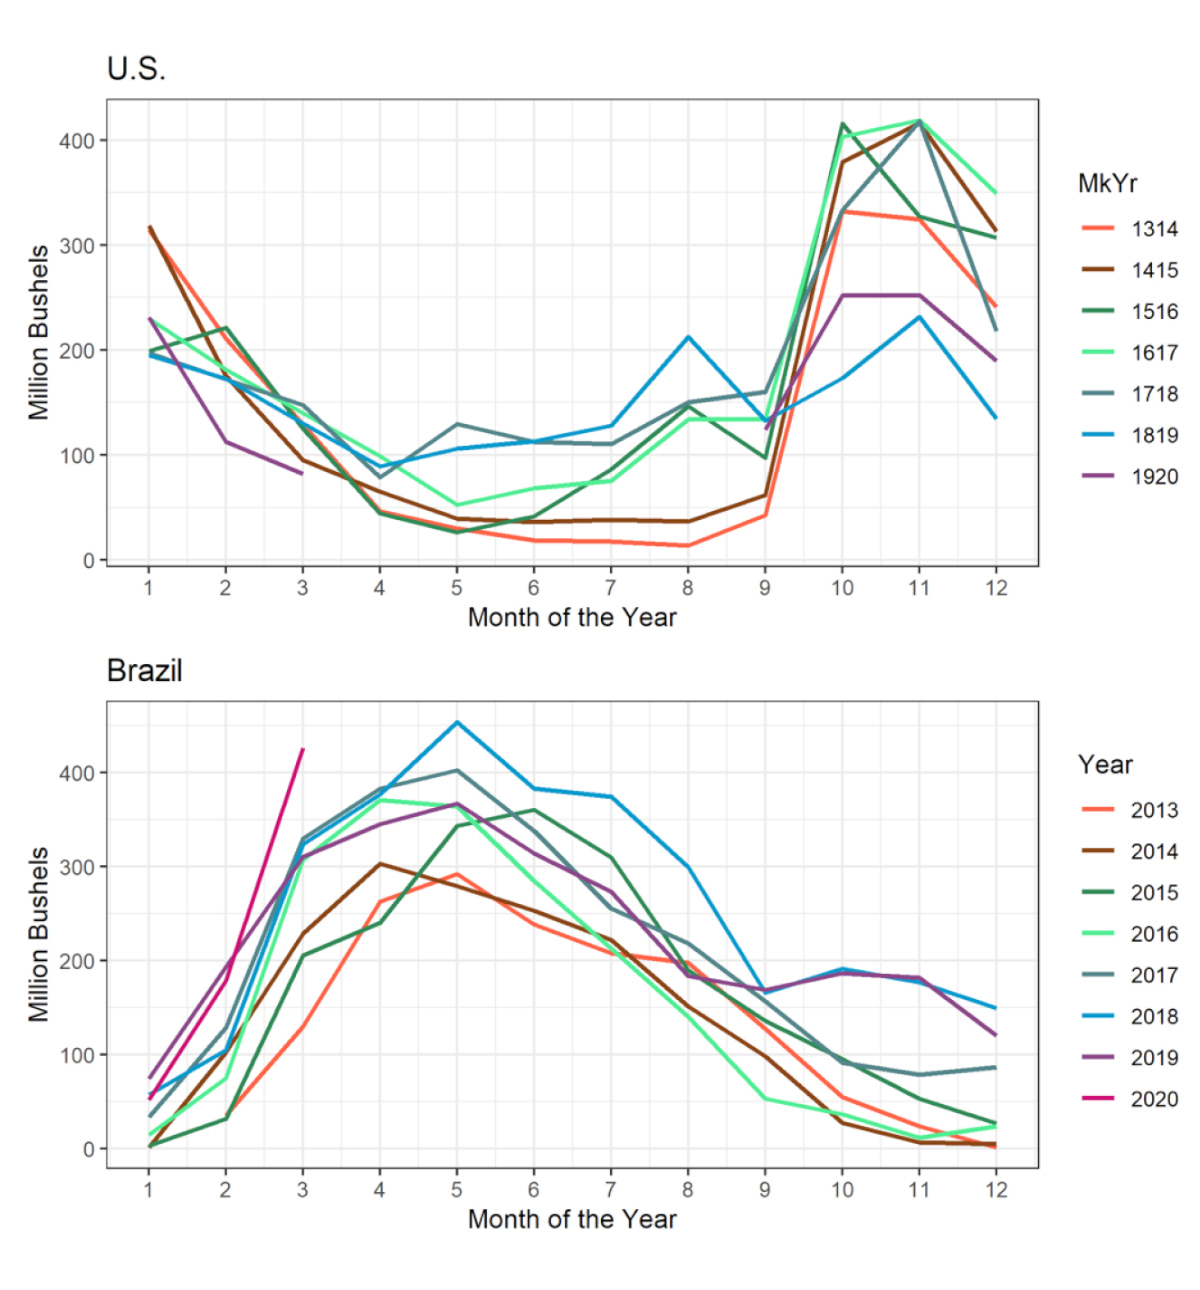
U.S. exports of soybeans are still reeling from the lingering trade war with China. The January 15, 2020 signing of Phase 1 of the U.S.-China trade deal brought hope that U.S. would see a rapid rebound of export volumes of soybeans to China. However, those hopes have not come to fruition, at least not immediately. Figure 1 shows monthly soybean exports from the United States and Brazil. Brazil’s bumper crop of 2020 soybeans dampened the impact of the trade deal, especially considering there was only a short window between signing of the trade deal and Brazil’s harvest.
Just eight days after signing Phase 1 of the trade deal, the city of Wuhan was placed under a stay-at-home by the Chinese government;1 by the first week of February new cases were rising in other areas in China and as many as fifteen cities were under some form of stay-at-home order.2 It is not clear whether widespread restricted movement policies dampened demand for soybeans, but initial evidence suggests that demand was not reduced for soybeans. Figure 1, shows weak exports from the U.S. in February and March are mirrored by especially strong exports from Brazil.
While demand for soybeans in China does not seem to be impacted by the virus, the coming weeks have potential to see disruption in the typical shift from Northern Hemisphere exports to Southern Hemisphere exports. Brazil currently has the third largest outbreak in the Americas, despite a low testing rate, and is expected to reach its peak in late June.3 This coincides with the period Brazil is typically exporting soybeans at its highest pace. Strict stay-at-home orders in Brazil could inhibit the timely shipment of goods to international markets. With the U.S. also under widespread stay-at-home orders, the same issues could constrain our capacity for shipment, but the U.S. is projected to experience its peak in coronavirus cases in mid-April. Further, Washington State and Louisiana, important locations in international shipping, are expected to peak in early April.4,5 Possibly freeing up capacity at the ports to fulfill Chinese demand while Brazil slows down.
The virus is also putting a strain on China-Brazil diplomacy. Brazil’s education minister made a post on twitter mocking Chinese accents and suggesting that the coronavirus crisis would be advantageous to China.6 The incident is escalating diplomatic tensions between the two countries. Further escalation would disrupt global trade flows of soybeans further.
Wheat’s importance as a staple food around the world, combined with a global rush for dollars is making many countries rush to limit or ban exports of the commodity.7 Russia, Ukraine, and Kazakhstan are among the world’s top ten exporters of grain that have either implemented or are considering restrictions on exports of wheat or flour. The renewed moves toward protectionism is causing some concern about disruptions to global food supply chains.
With the virus expected to cause a significant down- turn in the global economy, risk assets have seen a dramatic reduction in their value, and safe assets like dollars and U.S. treasuries have experienced strength. The weakness of currencies around the globe relative to the dollar are exacerbating fears that commodity traders would rather trade the commodity for dollars on the world market as the value of their domestic currency erodes.
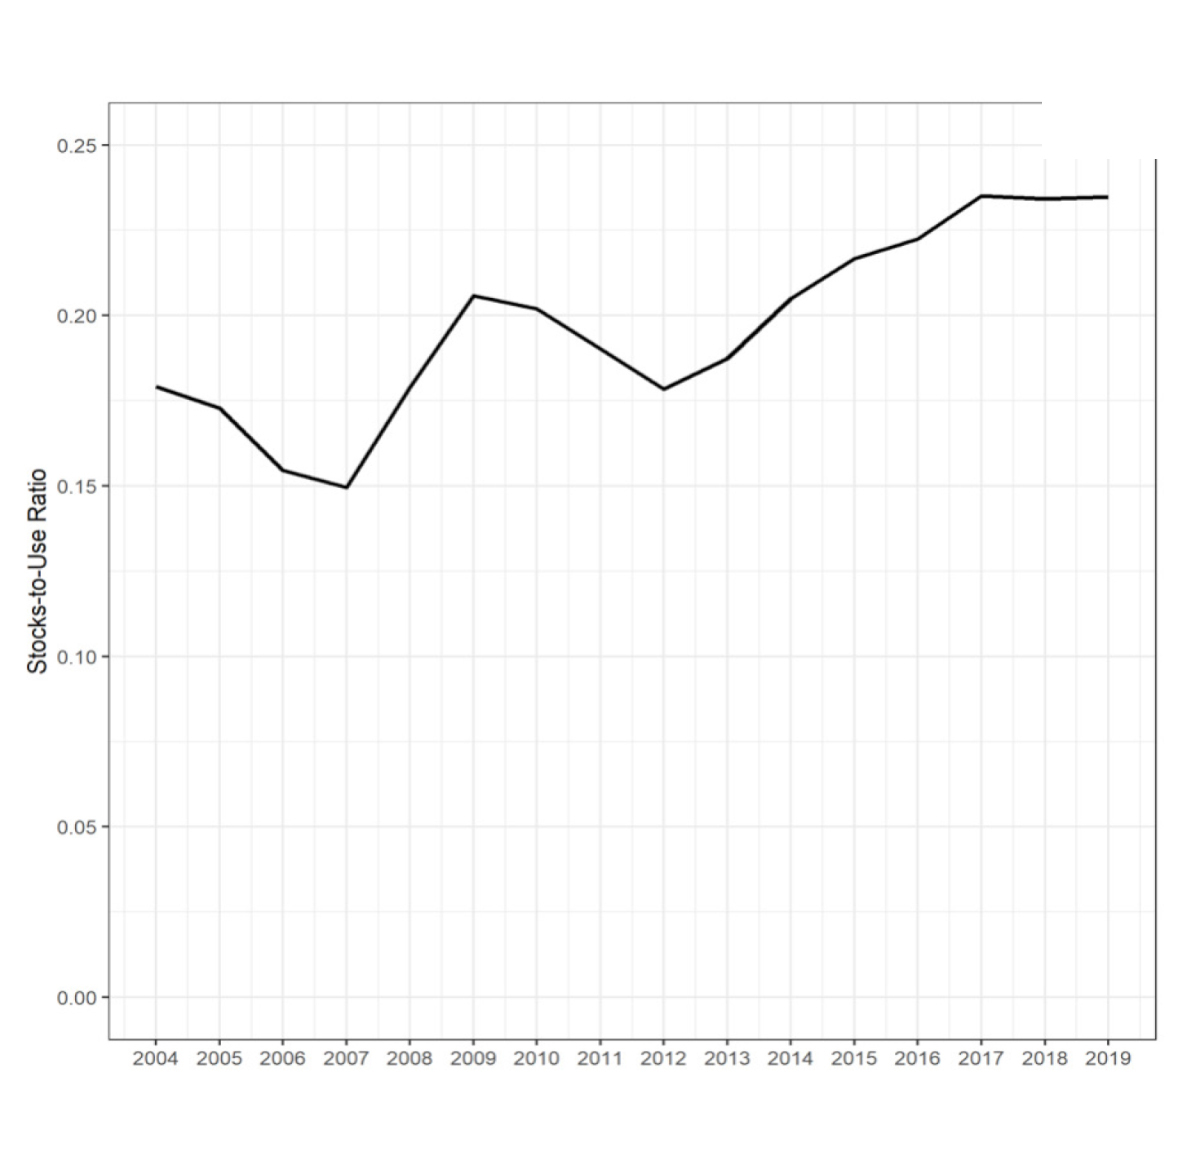
Also, memories are fresh of the commodity boom and bust cycle of 2007-2009, which saw significant export restrictions of wheat and rice around the globe. However, figure 2 shows that world stocks of wheat are currently much more plentiful today (at 24%) than they were in 2007 when they reached a recent low of 15% just before the commodity boom-bust cycle. Of course, today the worry is not tight stocks, but the ability to move stocks to where they are needed. In these unprecedented times, nothing is guaranteed, which is why we see countries taking measures to protect local supplies. Wheat stocks in the U.S. are projected to be about 43% of domestic use, so if shipping is at all possible the U.S. will have opportunity to ramp up exports to meet global demand for wheat.
Final Thoughts
These are times of extreme uncertainty, and there is no playbook for how this will play out. Our most recent example was the flu pandemic of 1918, when global supply chains looked vastly different. It is not clear whether the pandemic will affect some countries’ ability to move product through ports in a timely manner. In the case that it does impede trade flows, the U.S. may experience its worst disruptions earlier, and thus could step in to help offset disrupted flows in other parts of the world at later stages of the pandemic. Though, if we see repeated waves of the pandemic with another seasonal peak in the fall, we will have to reassess again what it means for global trade of commodities.
1Rueters, 2020-01-23, https://www.reuters.com/article/us-china-health-who-idUSKBN1ZM1G9
2Aljazeera, 2020-04-08, https://www.aljazeera.com/news/2020/01/timeline-china-coronavirus-spread-200126061554884.html
3Associated Press, 2020-04-04, https://apnews.com/a8efbe2f8ca2532d846741873c75e48c
4Washington Post, 2020-04-06, https://www.washingtonpost.com/health/2020/04/06/americas-most-influential-coronavirus-model-just-revised-its-estimates-downward-not-every-model-agrees/
5NPR, 2020-04-0, https://www.npr.org/sections/health-shots/2020/04/07/825479416/new-yorks-coronavirus-deaths-may-level-off-soon-when-might-your-states-peak
6Rueters, 2020-04-06, https://www.reuters.com/article/us-health-coronavirus-brazil/brazil-china-diplomatic-spat-escalates-over-coronavirus-supplies-idUSKBN21O22Z
7New York Times, 2020-04-03, https://www.nytimes.com/reuters/2020/04/03/world/europe/03reuters-health-coronavirus-trade-food-fact-box.html


