Small Business Administration Disaster Loans after Hurricane Katrina
March 12, 2016
PAER-2016-2
Anna Josephson and Maria Marshall, Professor of Agricultural Economics
![]()
![]()
![]()
![]()
![]()
Hurricane Katrina, which hit the southeastern United States over ten years ago in August of 2005, was the costliest hurricane in the history of the country. The storm cost more than $108 billion in damages and over 1,800 lives were lost (FEMA, 2013). As a result, the recovery effort was a tremendous undertaking. In order to assist in the rebuilding, the United States government promised $45 billion in loans and rebuilding funds (FEMA, 2013). One of these sources of funding was the Small Business Administration (SBA), and their small business disaster loans.
The SBA provides small business disaster loans to businesses and individuals for losses not covered by insurance. Disaster loans are different from SBA commercial loans, which are provided by commercial banks but guaranteed by the SBA. Disaster loans are provided directly by the federal government.
SBA small business disaster loans provided to small businesses affected by Hurricane Katrina are the subject of this article. In particular, we consider the differences in small businesses which applied for a loan and small businesses which did not apply for a loan following Hurricane Katrina. As any business in a declared disaster area is eligible to apply for a loan, understanding the characteristics of businesses which applied versus those that did not apply is important. We consider these differences for a group of approximately 500 small businesses in southern Mississippi.
SBA Background and History
Following a disaster, regions are designated as “declared disaster areas”. Businesses and individuals located within these regions are then eligible for financial assistance from the SBA. Businesses of any size, most private nonprofit organizations, and homeowners may apply to the SBA for a loan. Loans are intended to cover losses not fully protected by insurance. Three primary loan types exist, including: 1) home and personal property loans, 2) business physical disaster loans, and 3) economic injury disaster loans.
Although SBA loans were available following Hurricane Katrina, evidence suggests that the process was mismanaged and that many eligible business owners were either rejected or failed to apply altogether. The Associated Press released a report based on SBA data, finding that 55 percent of homeowners and businesses that applied for disaster loans were turned away. Of 318,953 applications processed, 175,463 were rejected and 143,490 were approved. Further, of the approved loans, only 60 percent ultimately reached recipients. SBA officials claim that many applicants never accepted the loans as they found other ways to rebuild. But, many applicants indicated that applications were abandoned as the process took too long and was overly complicated (Weiss, 2010).
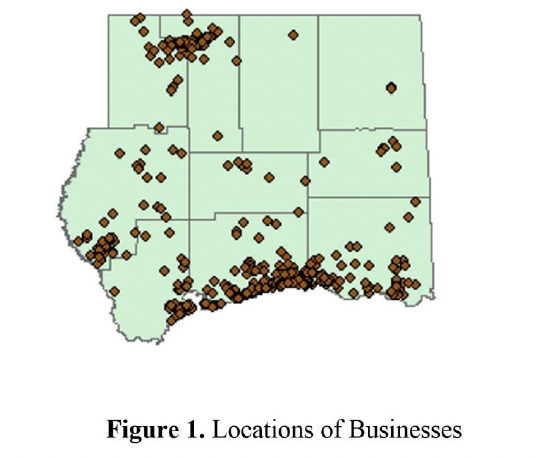
Figure 1: Location of Businesses
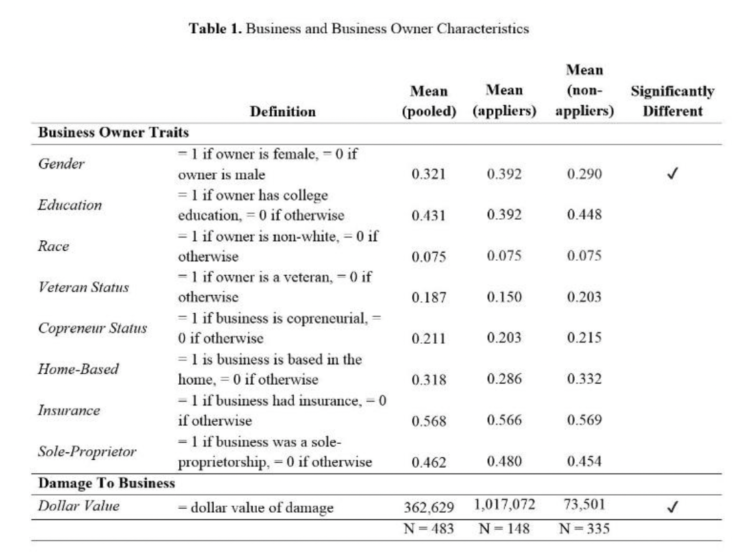
Table 1: Business and Business Owner Characteristics
The data used in this analysis are from the 2013 Small Business Survival and Demise after a Natural Disaster Project (SBSD). The population from which the sample was drawn was deliberately limited geographically to south Mississippi. The land mass of the ten chosen counties was almost entirely to the right of the storm track, in the right front quadrant of Hurricane Katrina. These ten counties are home to a wide range of industries including services, financial, tourism, retailing, manufacturing, forestry, and agriculture. Figure 1 shows a map of business locations within these 10 counties. We include 483 businesses in our sample.
Appliers v. Non-Appliers
In this analysis, we consider eight primary characteristics of business owners: 1) gender of the business owner, 2) education of the business owner, 3) race of the business owner, 4) veteran status of the business owner, 5) whether the business was copreneurial (defined as a couple working together in the management of the business), 6) whether the business was home-based, 7) whether the business had insurance, and 8) whether the business was a sole-proprietorship. The revenue of the business and damage experienced by the business are also considered. Table 1 gives the definitions of the owner characteristics considered, as well as means for the different populations including 1) the entire sample, 2) businesses that applied for a disaster loan, and 3) businesses that did not apply for a disaster loan.
In Table 1, we consider the means for the entire sample, as well as for the appliers and non-appliers. There is also a column which indicates if the means of appliers and non-appliers are statistically and significantly different from one another. Only a single variable has a statistically different mean for appliers and non-appliers: gender of business owner. While 32% of all businesses in the sample have a female owner, 39% of those who applied for a loan were female, while only 29% of those who did not apply were female. This indicates that female business owners were more likely to be appliers. It is not clear at this time why women would be more likely to be appliers, on average, than non-appliers; however, based on the support by the SBA for women-owned businesses, perhaps the greater application of women is a signal of the success of these programs (SBA, n.d.).
Other characteristics of business owners are not significantly different between appliers and non-appliers. Some traits have slight, though not statistically significant differences. These include:
1. Education: 43% of business owners have a college education; only 39% of appliers have a college education while 45% of non-appliers do.
2. Veterans: 19% of business owners are veterans; only 15% of appliers are veterans while 20% of non-appliers are.
3. Coprenerial status: 21% of business owners are copreneurs; only 20% of appliers are coprenerial, while 22% of non-appliers are.
4. Home-based: 32% of businesses are home-based, only 29% of appliers are home-based, while 33% of non-appliers are.
5. Sole-proprietorship: 46% of businesses are sole-proprietors; 48% of appliers are sole-proprietors, while only 45% of non-appliers are.
For the remaining two traits, there are effectively no differences; 7.5% of all the groups are non-white, while 57% of all groups had insurance.
Several of these similarities are encouraging. In particular, there seems to be no bias for application towards only those with college education and no bias against application for non-white business owners. As the SBA seeks to help all business owners and other eligible individuals impacted by disaster, it is encouraging that no bias in application is evident. However, one of the lacks of difference is somewhat surprising. That is, the result that there is no difference between appliers with insurance and non-appliers with insurance is somewhat unexpected as SBA loans only cover losses not covered by insurance. Thus, it would seem that those without insurance would be more likely to apply, though this is not the case. This can be explained, however, as insurance is often mandated for homeowners or renters. It is possible that businesses had insurance, but did not have enough insurance to cover the damage sustained from the storm. This resulted in businesses with insurance applying for loans, causing no difference between appliers with insurance and non-appliers with insurance.
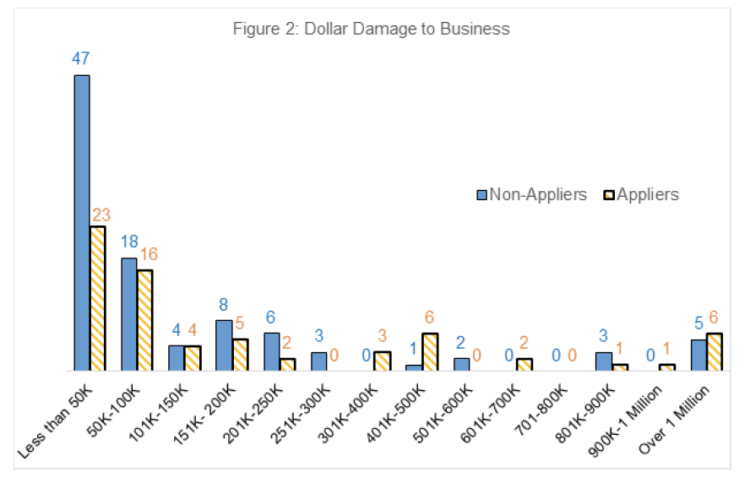
Figure 2: Dollar Damage to Business
It is also important to consider the financial considerations of the business. The first of these considered is the size of business revenue. There is no clear distinction in the size of revenue between appliers and non-appliers; businesses with revenues over a million dollars are not significantly less likely to apply, nor are businesses with revenues less than $50,000 significantly more likely to apply. This suggests that application status is equitable across businesses, with respect to revenue.
Additionally, when considering application for loans, it is imperative to consider damage to the business. This particular variable measures the damage to the physical facility in which the business is housed. Mean statistics are given in Table 1, with a range seen in Figure 2. Table 1 shows that, on average, businesses had an average of $362,629 of damage. As one would expect, for those who applied for loans, damage was much higher: $1,017,072. Further, for those who did not apply, damage was much lower: $73,501. This follows expectations, as those with less damage are less likely to apply, as they have less need for the loan; their losses may be covered by insurance or they may be able to independently cover the cost of reconstruction. Conversely, those with more damage are more likely to apply, as their losses may not entirely be covered by insurance and it would be difficult to independently cover the cost of repairs.
Figure 2 expands on these damage statistics. Not shown in Figure 2 are businesses with a damage value of zero. For those businesses which applied there are 79 businesses with no damage while for those businesses which did not apply there are 240 businesses with no damage. It may be somewhat puzzling that there would be appliers with no damage. However, this is possible as businesses are able to apply for loans related to economic injury or damage to personal property with no reported damage to the physical structure of the business. However, it is worth noting that businesses with less than $50,000 of damage which do not apply are the largest group represented; this makes sense, as those with less damage are less likely to apply.
Why Apply or Not Apply?
Small business disaster loans from the Small Business Administration were available to businesses in Mississippi following Hurricane Katrina, in order to help them recover losses not otherwise covered by insurance. This article reports on differences between the businesses which applied and the businesses which did not apply for an SBA disaster loan. We examined several characteristics of the business owner, as well as two financial measures. The analysis largely revealed that there are few differences between those businesses which applied and those businesses which did not. While female business owners are more likely to be appliers than not, there are no significant differences with respect to education, race, veteran status, or insurance.
Two circumstances have mixed results. First, there is not a definitive discrepancy in business revenue between appliers and non-appliers; businesses with revenues over a million dollars are not significantly less likely to apply, nor are businesses with revenues less than $50,000 significantly more likely to apply. However, there is a strong distinction with respect to amount of damage: the average damage for those businesses which apply is nearly fourteen times greater than damage for those businesses which did not apply. Thus, the amount of damage was more important than size of revenue for businesses which would apply for an SBA loan.
Although these results do not tell us everything that we may want to know about the differences between appliers and non-appliers, it does suggest that there is little bias in the process of application for SBA loans. Given the controversy at the SBA which followed Hurricane Katrina due to difficulties with the application and administration process for the disaster loans, this is an encouraging result.
References:
FEMA: Federal Emergency Management Agency, (2013), “About Hurricane Katrina”, available at: http://www.fema.gov/response-recovery/about-hurricane-katrina (Accessed March 15, 2014).
SBA: Small Business Administration, (n.d.). “Women Owned Businesses: SBA Resources for Women” available at: https://www.sba.gov/content/women-owned-businesses (Accessed January 9, 2015)
Weiss, M. (2010), “No Compassion for Katrina Loan Applicants”, Associated Press. (Accessed May 19, 2014).
This article is based upon material from the Purdue University Project “Small Business Survival and Demise after a Natural Disaster”, supported by NSF Grant #0856221-CMMI and “Small Business Disaster Recovery Process: An Analysis of Rural Communities in Mississippi” supported by USDA-NIFA grant # 2011-67023-30609.
![]()
![]()
![]()
![]()
![]()
