1993 Statewide Farmland Values Continue Modest Increase
August 1, 1993
PAER-1993-11
J.H. Atkinson, Professor and Kim Cook, Research Associate
![]()
![]()
![]()
![]()
![]()
The Purdue land values survey revealed a statewide increase of 3.2% in the value of average-quality bare till-able land in the year ending in June 1992, about double the tiny increase of 1991-92. The USDA estimate for the year ending January 1 was 5%. The Federal Reserve Bank of Chicago survey of bankers indicated a 4% increase for the year ending March 31 in “good” farmland in the northern two-thirds of Indiana.
According to the Purdue survey, this is the sixth consecutive year of increasing Indiana land values. Top-quality land values are now 44%above the low levels of 1987, but are still 35% below the high of 1981. Furthermore, inflation of about 27%reduces the “real” increase in top and average land values since 1987 to 13%.
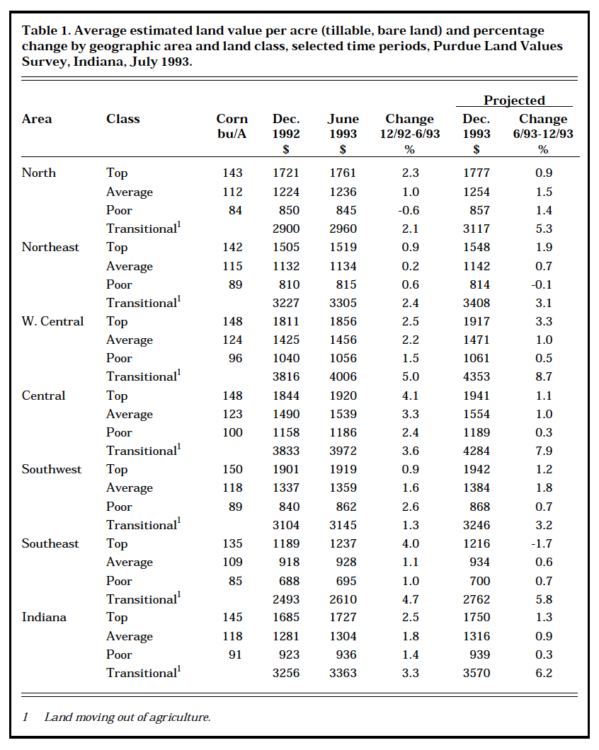
Table 1. Average estimated land values per acre (tillable, bare land) and percentage change by geographic area and land class, selected time periods, Purdue Land Values Survey, Indiana, July 1993
Compared to a year ago, the cur-rent number of farmland transfers was estimated to be up by 30% of the respondents, down by 26%, and the same by 44%. Only 7.5% of the respondents reported that there currently is more land on the market than a year ago; 43% said less, and 50% said the same.
Statewide Land Prices
For the six months ending in June 1993, the survey showed statewide average increases of 2.5% on top land, 1.8% on average land, and 1.4% on poor land, somewhat more than the increases of 1% to 1.3%reported for the same period a year ago (Table 1). Fifty-two percent of the respondents reported that some or all classes of land increased dur-ing the six-month period, 4.5%reported declines, and 42% felt there was no change in any class of land values. These estimates were more bullish than those of last year.
The statewide increase in value for the year ending in June 1993 was 3.2% on top and average land, and 3.7% on poor land (Table 2). These increases are greater than the 1.1%to 2.4% increases reported last year.
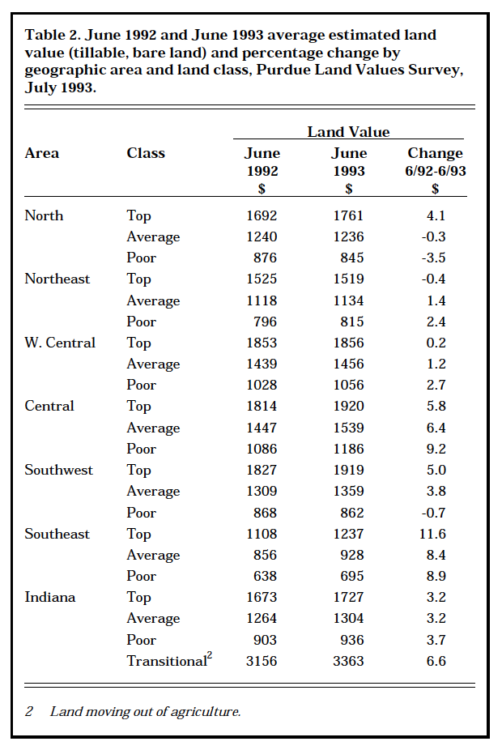
Table 2. June 1992 and June 1993 average estimated land value (tillable, bare land) and percentage change by geographic area and land class, Purdue Land Values Survey, July 1993
Statewide, land rated at a long-term corn yield of 145 bushels per acre had an average estimated value of $1,727 per acre (Table 1) or $11.91 per bushel (Table 3). Average land (118-bushel yield) was valued at $1,304 per acre, while the 91-bushel poor land was estimated to be worth$936 per acre. Land values per bushel of yield rating were $11.05 on average land and $10.29 on poor land. These per-bushel figures are$.21 higher than last year on top land, $.15 higher on average land, and $.26 higher on poor land.
Transition land moving into non-farm uses was estimated to have a value of $3,363 per acre in June 1993, up 6.6% from last year (Table 2). Only about 46% of the respondents reported on transition land values, and the range in estimates is quite wide. Hence, the reliability of the average value is not as good as with farmland.
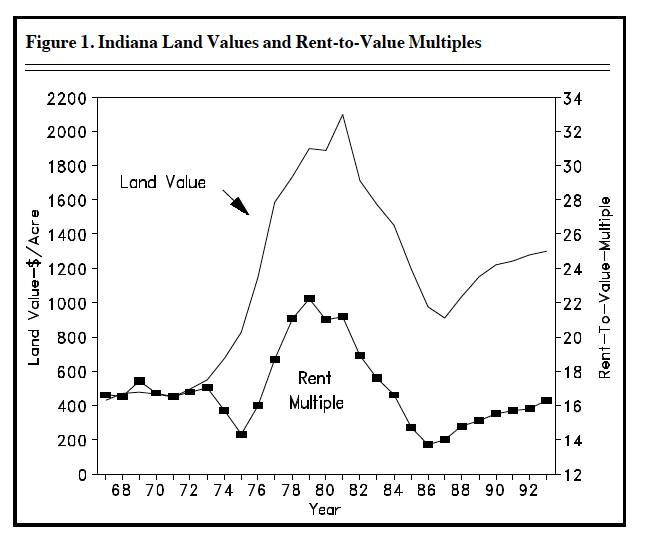
Figure 1. Indiana Land Values and Rent-to-Value Multiples
Statewide Rents
Cash rents increased statewide from 1992 to 1993 by $2 per acre on top land and $1 per acre on poor land and declined $1 per acre on average land (Table 4).
The estimated cash rent on aver-age land was $89 per acre, $114 on top land, and $69 on poor land. Rent per bushel of estimated yield was $.79 on top land, $.75 on average land, and $.76 on poor land. Cash rent on top land in 1993 was 17%below the record 1981 level.
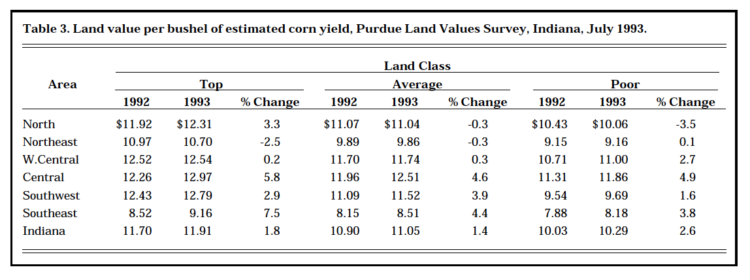
Table 3. Land values per bushel of estimated corn yield, Purdue Land Values Survey, Indiana, July 1993
Statewide, cash rent as a percent-age of estimated land value declined a little from the levels of the three previous years. Average figures are 6.6% for top land, 6.8% for average land, and 7.4% for poor-quality land (Table 4).
Another way to examine the relationship between cash rent and land values is to calculate a “rent multiple” by dividing estimated land value by cash rent. USDA estimates of real estate tax per acre were subtracted from rent, and multiples calculated as shown in Figure 1 (USDA rent and land value data, 1967-76, Purdue data 1976-93). The estimated multiple on average land in 1993 was 16.3, much lower than the multiple of 21 to 22 in 1978-81 and slightly lower than the average of the fairly stable years, 1967-72. Land values fell faster than cash rents in the early 1980s, so the multiple fell to around 14 in 1986-87 and has risen since.
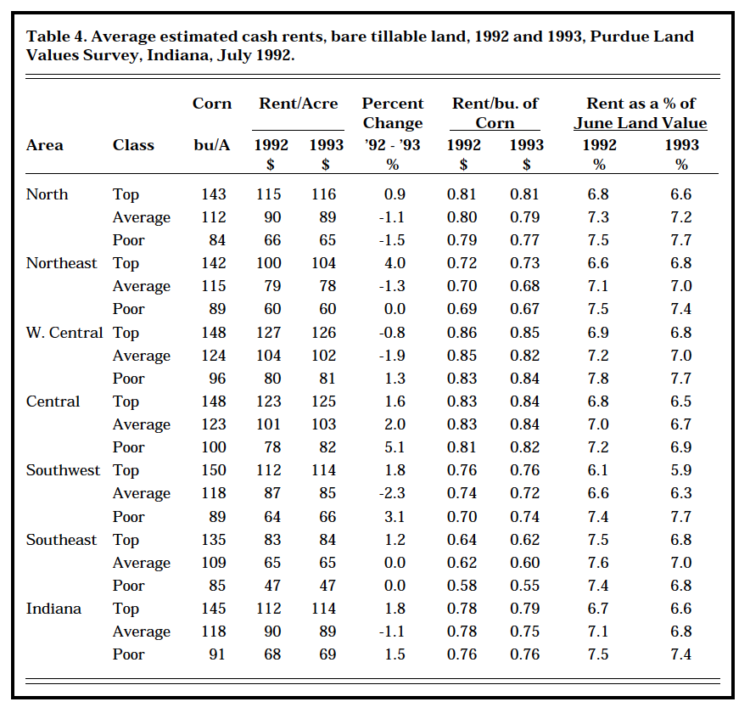
Table 4. Average estimated cash rents, bare tillable land, 1992 and 1993, Purdue Land Values Survey, Indiana, July 1992
Area Estimates
The value of farmland by areas (Figure 2) from December 1992 to June 1993 increased except on poor land in the north which registered a$5 per acre decrease. The greatest increase, 4.1%. was on top land in the central area (Table 1).
For the year ending in June 1993, the greatest increases in all classes of farm land values occurred in the southeast and central areas, ranging from about 6% to nearly 12% (Table 2). Declines were noted for poor land in the southwest and north, as well as for average land in the north and top land in the northeast. Increases in other land classes ranged from under 1% to 5%. Transition land values increased in all areas except the west central.
The estimated average value of top-quality farm land was about$1,920 per acre in both the central and the southwest areas. Next highest, $1,856, was in the west central area. The corn yield rating on top land was practically identical in these three areas.
The percentage increase from the lows of 1987 has been greater in the southwest than in other areas —60% on top land, 58% on average land, and 52% on poor land. In the other areas, top land has increased 44% to 47% in the southeast, north, west central, and central areas; 60% in the southeast; and 31% in the northeast. Increases for average were about the same as for top land in most areas. Poor land values rose more than values of top and average land in northeast and central areas, and less in the southwest.
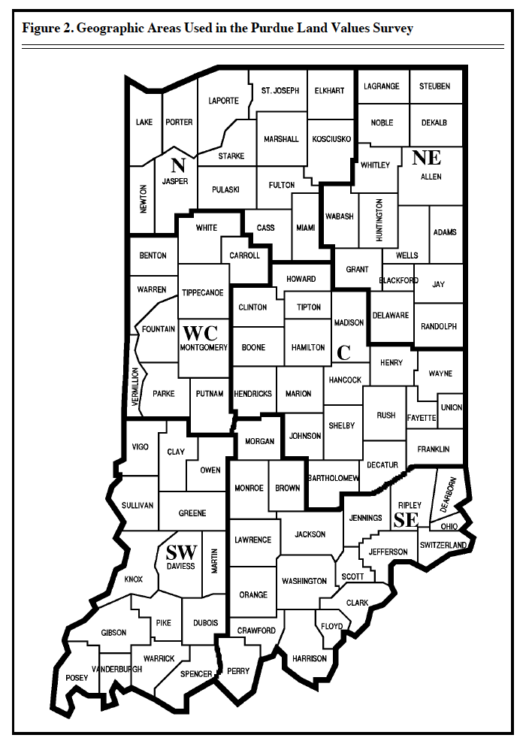
Figure 2. Geographic Areas Used in The Purdue Land Values Survey
Central Indiana top land with a 148-bushel corn yield rating had an average value of $1,920 per acre or$12.97 per bushel (Table 3). This per-bushel figure for top land was from$12.31 to $12.79 in the north, south-west, and west central areas; $10.70 in the northeast; and $9.16 in the southeast. These per-bushel figures declined as land quality declined.
Per-acre rents for top land increased $1 to $4 from 1992 to 1993 in all areas except the west central, where rents for top land were down by $1 (Table 4). Average land rents increased only in the central area. Rent for poor land increased by $1 to$4 in three of the six areas. In the southwest area, average land rent was up $2, and poor land rent was down the same amount. Only in the central area were rents up for all classes of land.
Cash rents were highest in the west central and central areas, with averages of $125-$126 per acre on top-quality land ($.84-$.85 per bushel). The per-bushel rent for the top land was $.81 in the north and$.76 in the southwest. The estimate was $.73 for the northeast and $.62 in the southeast. As land quality declined, rent per bushel also tended to decline, but by only a few cents per bushel.
Cash rent as a percentage of land value tended to decline from 1992 to 1993 (Table 4). This percentage declined on top land in the south-west from 6.1% in 1992 to 5.9% in 1993. Cash rent as a percentage of land values on top land in the other areas fell in the narrow range of 6.5% to 6.8%. In most cases, this per-centage increased as land quality declined.
Respondentsʼ Outlook
Respondents were a little more optimistic this year than last that farm-land values would rise by year-end. Forty-three percent expect some or all classes of land to increase, up from one-fourth last year; however, 50% of the respondents felt that there would be no change. The aver-age increase of 1.3% for top land was slightly higher than last year. Only 6% expected declines in some or all classes of land. Increases, mostly under 2%, were expected in all areas of the state for all classes of land except for poor land in the northeast (down 0.1%) and top land in the southeast (down 1.7%). The greatest average increase, 3.3%, was expected to occur on top land in the west central area.
Seventy-nine percent of the 1993 respondents expect land values to be higher five years hence, 17%expected no change, and 4%expected decreases. This year, the group expected an average increase of 7.4% for the five-year period, down from 9% last year. This 7.4%increase in 5 years is a compound annual rate of about 1.5%. Current cash rent minus real estate tax and a few dollars per acre for other ownership costs would result in a return of 6% or a little less. Total return would thus be about 7% to 7.5%. This rate of return compares favor-ably with current rates on certificates of deposit, especially given the fact that land investment is an inflation hedge and has the potential of increased returns over time.
Respondents were asked to estimate annual averages over the next five years for corn and soybean prices, the farm mortgage interest rate, and the rate of inflation. The projections they made for the past decade are shown below:
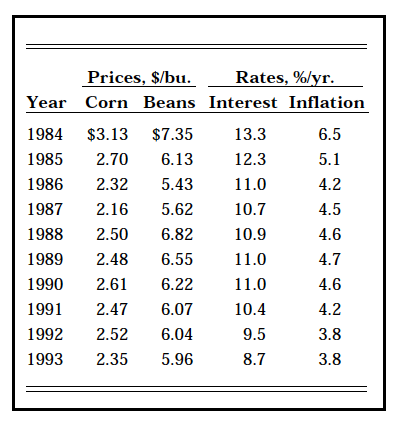
Figure 3. Estimated annual averages over next 5 years for corn and soybean prices, the farm mortgage interest rate, and the rate of inflation
The soybean price expectation has declined every year since 1988, although most of the decline ($.86) was over by 1991. This year’s $.17 decline in corn price expectation is the greatest since 1985. The interest rate expectation dropped for the fourth year in a row by nearly a full percentage point to 8.7%, the lowest level since this question was first asked in 1983. The expectation for inflation was 3.8%, the same as last year. The difference between the expected interest rate and the inflation rate, sometimes used as a rough measure of the “real” interest rate, was 4.9, down from the range of 6.2-6.4 from 1987-91.
Factors Affecting Land Prices
This year, like a year ago, only modest increases in land values are expected. Listed below are several factors which are likely to affect land values.
Positive Factors
➤ low interest rates
➤ good crop prospects in Indiana for 1993
➤ gradual increases in crop yields
➤ the shift to no-till
➤ land purchase by investors
➤ improving technology in both crop and swine production
➤ gradual increases in ethanol pro-duction
➤ potential reduction in trade bar-riers
➤ prospects for decreasing carry-over stocks of corn and beans
Negative Factors
➤ environmental protection costs
➤ prospects for higher interest rates
➤ keen competition for exports
➤ reduced government payments
➤ declining percentage return to land
Some of the above factors change slowly and exert a gradual influence on land values, for example, changing production technology and increasing crop yields. Others can change quickly and could result in either increases or decreases in land values in the short run.
Cautious investors would be well advised to assume that land values over the rest of the decade will do little more than keep up with inflation (little or no increase in “real” values); however, we believe that there is more upside potential in land values than there is downside risk, even though, in the short run, slight decreases might occur. Remember, too, that because of the imprecise nature of land value estimation, a reported change of 1-3% per year either up or down may simply indicate a stable market rather than a trend.
The land values survey was made possible by the cooperation of professional farm managers, appraisers, brokers, bankers, county extension educators, and persons representing the Farm Credit System, the Farmers Home Administration, ASCS county offices, and insurance companies. Their daily work requires that they keep well-informed about land values and cash rent in Indiana. The authors express sincere thanks to these friends of Purdue and Indiana agriculture. They provided 340 responses representing most of Indiana’s counties. We also express appreciation to Sandy Dottle of the Department of Agricultural Economics for her help in conducting the survey and to Professors Chris Hurt and John Kadlec for their review of this report and helpful suggestions.
![]()
![]()
![]()
![]()
![]()
