1992 Statewide Farmland Values Modestly Higher
August 1, 1992
PAER-1992-13
J.H. Atkinson, Professor and Kim Cook, Research Associate
GThe Purdue land values survey revealed a statewide increase of 1.5% in the value of average quality bare tillable land in the year ending in June 1992, about the same as the 2% estimate by USDA for the year ending January I. The Federal Reserve Bank of Chicago survey of bankers also indicated a 2% increase for the year ending March 31.
According to the Purdue survey, this is the fifth consecutive year of increasing Indiana land values. Top-quality land values are now 40% above the low levels of 1987, according to the Purdue study, but are still 38% below the high of 1981. Furthermore, inflation of about 23% reduces the “real” increase in top and average land values since 1987 to 11%.
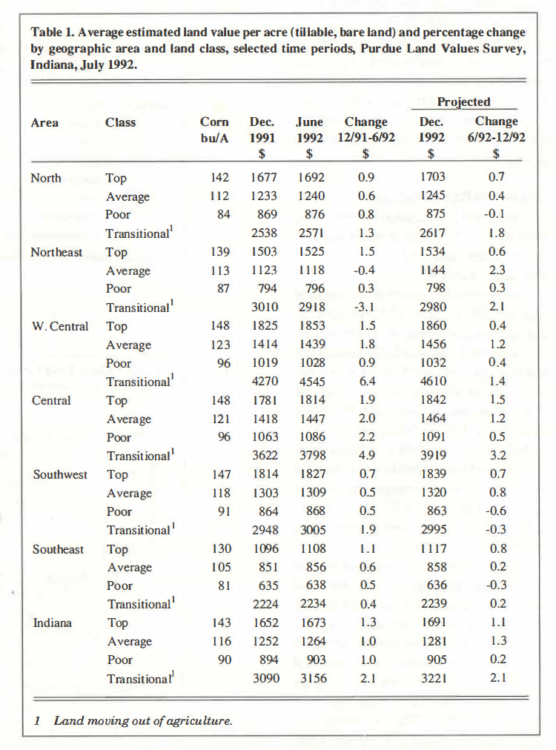
Table 1. Average estimated land value per acre (tillable, bare land) and percentage change by geographic area and land class, selected time periods, Purdue Land Values Survey, Indiana, July 1992
Statewide Land Prices
The survey showed statewide average increases for the six months ending in June 1992 of 1.3% on top land and 1.0% on average and poor land, a little less than the slight increases reported for the same period a year ago. Thirty-eight percent of the respondents reported that most classes of land increased during the six-month period, 6% reported declines, and 52% felt there was no change in land values. These estimates are about the same as last year.
The statewide increase in value for the year ending in June 1992 was 2.4% on top land, 1.5% on average land, and 1.1 % on poor land (Table 2). These increases are the smallest since land values turned up in 1987.
Statewide, land rated at a long-term com yield of 143 bushels per acre had an average estimated value of $1,673 per acre (Table 1) or $11. 70 per bushel (Table 3). Average land (116 bushel yield) was valued at $1,264 per acre, while the 90-bushel poor land was estimated to be worth $903 per acre. Land values per bushel of yield were $10.90 on average land and $10.03 on poor land. These per-bushel figures are $.20 higher than last year on top land, $.17 lower on average land, and $.1 I higher on poor land.
Transition land moving into nonfarm uses was estimated to have a value of $3,156 per acre in June 1992, about the same as a year earlier (Table 2). Only about 40% of the respondents report on transition land values – the range in estimates is quite wide and the reliability of the averages is not as good as with farmland.
Statewide Rents Increase Slightly
Cash rents increased statewide from 1991 to 1992 by $2 per acre on top land and average land and $1 per acre on poor land (Table 4).
The estimated cash rent for average land was $90 per acre, $112 on top land, and $68 on poor land. Rent per bushel of estimated yield was $.78 on both top and average land, and $.76 on poor land. Cash rent on average land in 1992 was 15% below the record 1981 level and equal to the 1977 estimate (Figure I).
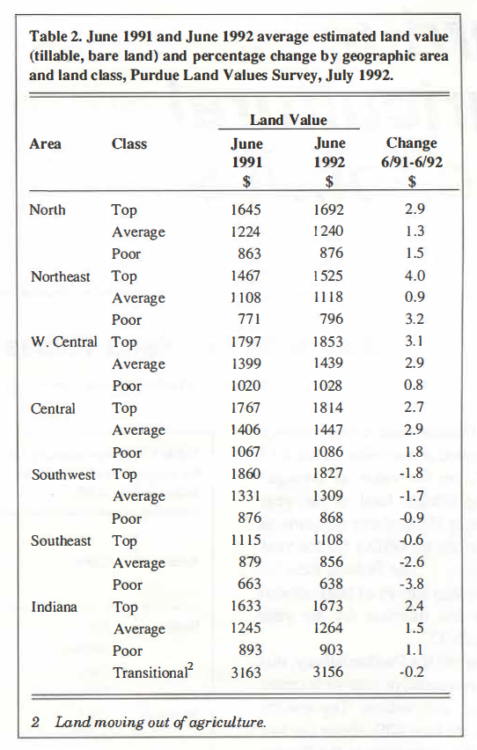
Table 2. June 1991 and June 1992 average estimated land value (tillable, bare land) and percentage change by geographic area and land class, Purdue Land Values Survey, July 1992
Statewide, cash rent as a percentage of estimated land value has not changed for three years. Average figures are 6.7% for top land, 7.1 % for average land, and 7 .5% for poor-quality land (Table 4).
Another useful way to examine the relationship between cash rent and land values is to calculate a rent multiple by dividing estimated land value by cash rent. USDA estimates of real estate tax per acre were subtracted from rent, and multiples calculated as shown in Figure 1 (USDA rent and land value data were used prior to 1976). The estimated multiple on average land in 1992 was 15.6, much lower than the multiple of 21 to 22 in 1978-81. Land values fell faster than cash rents in the early 1980s, so the multiple fell to around 14 in 1986-87 and has risen since.
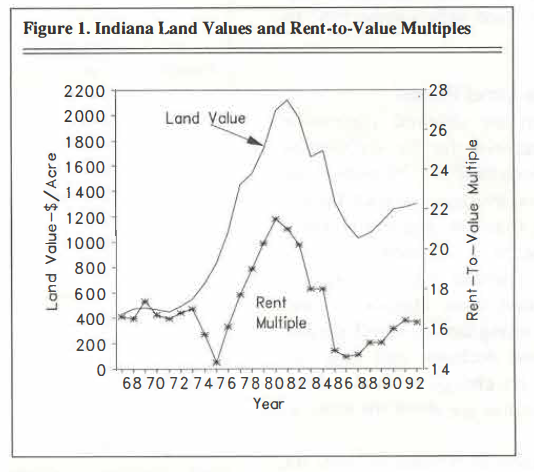
Figure 1. Indiana Land Values and Rent-to-Value Multiples
Area Estimates
Farmland value increases from December 1991 to June 1992 were mostly under 1.5% in all areas of the state except central Indiana (Figure 2) where increases were around 2.0% (Table 1).
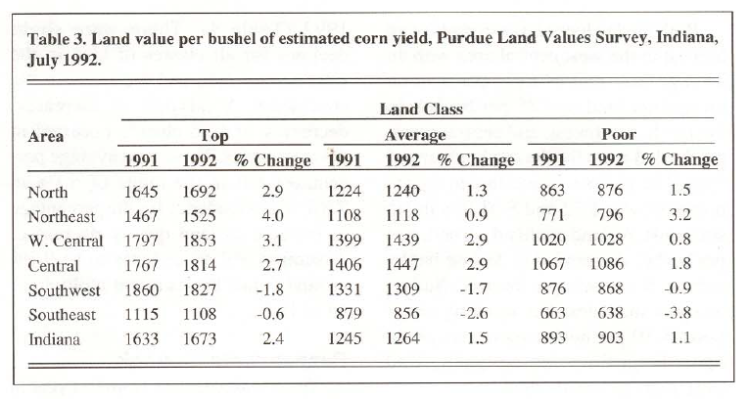
Table 3. Land value per bushel of estimated corn yield, Purdue Land Values Survey, Indiana July 1992
For the year ending in June 1992, small decreases occurred in all classes of farm land in the two southern areas (Table 2). Increases were noted in all classes of land in the other areas with the greatest at only 4%, or less than half of the greatest increase a year ago. Increases in other areas fill in the narrow range of about 1-3%. Transition land values declined from 3% to over 8% in all areas, except central Indiana where there was an increase of 8.3%, perhaps caused by considerable development activity north of Indianapolis.
The estimated average value of topquality farm land at $1,853 per acre in the west central area was the highest of all areas. Southwest Indiana was second at $1,827 per acre, followed by $1,814 in the central area. The corn yield rating on top land was practically identical in these three areas, and the estimated land values varied by less than $40 per acre.
The percentage increase from the lows of 1987 has been greater in the southwest than in other areas-51 % on average and poor land and 57% on top land. In the other areas, top land has increased 31 % in the northeast and southeast, 35% in the central area, 41 % in the north, and 46% in the west central area. This range was greater for average land, 27-47%, and poor land, 29-54%. However, these big percentage increases are from a low base. Also keep in mind that the 1992 values in all areas are lower than they were 15 to 16 years ago.
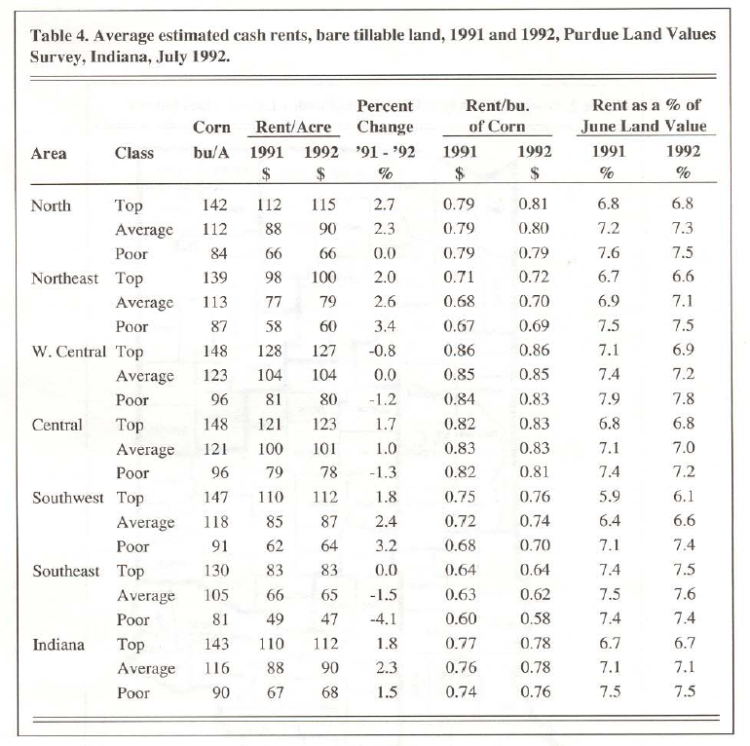
Table 4. Average estimated cash rents, bare tillable land, 1991 and 1992, Purdue Land Values Survey, Indiana July 1992
West central Indiana top land with a 148-bushel corn yield rating had an average value of $1,853 per acre or$12.52 per bushel (Table 3). This perbushel figure for top land was from $11.92 to $12.26 in the north, southwest, and west central areas, $10.97 in the northeast, and $8.52 in the southeast. These per-bushel figures declined as land quality declined.
In all areas except the southeast and west central, per-acre rents for top and average land typically increased $1-2 from 1991 to 1992(Table 4). There was no change in top land rent in the southeast and on average land in the west central area. Average and poor land rents in these areas declined $1-2.
Both land values and cash rents were highest in the west central area with an average cash rent of $127 per acre on top-quality land or $.86 per bushel. In the north, southwest, and central areas, per-bushel rents for the top land ranged from $.81 to $.86. The estimate for the northeast was $.72 and $.08 less in the southeast. As land quality declined, rent per bushel also tended to decline but by only a few cents per bushel. Budget analysis indicates that in many situations, $.10 per bushel more rent could easily be justified for top-quality land over average-quality land.
Cash rent as a percentage of land value changed very little from 1991 to 1992 (Table 4 ). There were slight declines for all classes of land in the west central area and increases in the southwest. A mixture of increases, decreases, and no change occurred in the other areas. These area average percentages fell in the range of 6.1 % to 7 .8% with a tendency for the percentage to increase as land quality decreased. Assuming real estate taxes to be 0.7% of land value, this is a rent multiple of 14 to 18.5.
Respondents’ Outlook
There was a decline from last year in expectation that farmland values would rise by year-end. Only a fourth of the respondents expect some or all classes of land to increase, down from 39% last year. The average increase of 1.1 % for top land was about the same as last year. Only 7% expected declines in some or all classes of land, while over half expected no change. Increases, mostly under 1.5% on top and average land, were expected in all areas of the state.
Eighty percent of the 1992 respondents expect land values to be higher five years hence, 17% expected no change, and 3% expected decreases. This year, the group expected an average increase of 9% for the five-year period, the same as last year.
Respondents were asked to estimate annual averages over the next five years for corn and soybean prices, the farm mortgage interest rate, and the rate of inflation. The projections they made in each year since 1984 are shown below:
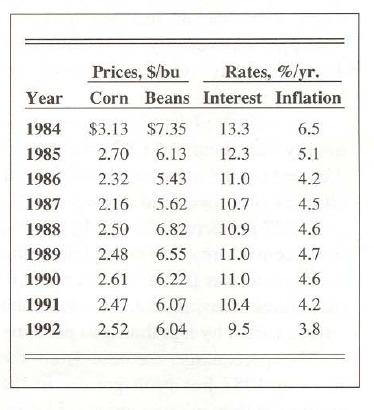
Response to annual averages per the next five years for corn and soybean prices.
The 1992 com price expectation of $2.52 per bushel was $.05 higher than in 1991 and for beans was $.03 lower. Since 1987 the range in expectations has been only $.11 per bushel for corn and$. 78 per bushel for soybeans. Interest rate expectations dropped for the third year in a row by nearly a full percentage point to 9.5%, the lowest level since this question was first asked in 1983. The expectations for inflation declined to 3.8%, in contrast to 6.5% expected in 1984. The difference between the expected interest rate and the inflation rate, sometimes used as a rough measure of the “real” interest rate, was 5.7, down from the narrow range of 6.2-6.4 from 1987-91.
Our Views of the Future
Our respondents’ consensus of a slight increase in land values by the end of the year appears reasonable as a continuation of the recent trend in values. The lowest interest rates in about two decades plus generally good crop prospects, even at lower prices, may provide stimulus for slight increases in land values by next spring, but probably at less than the inflation rate for the year.
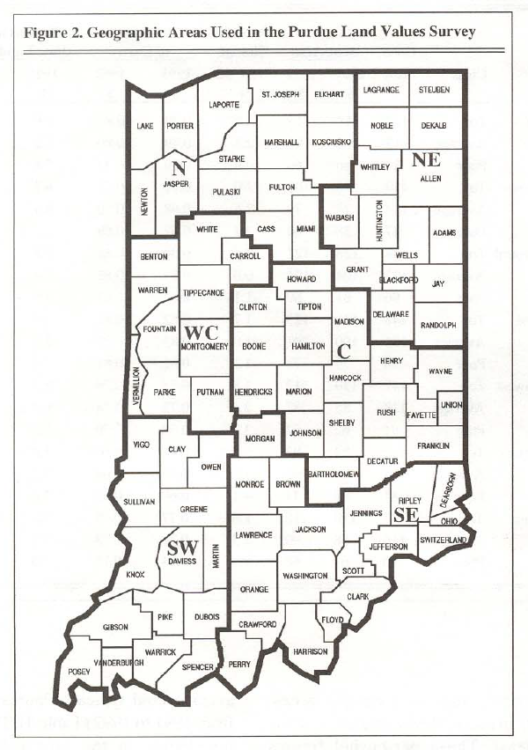
Figure 2. Geographic Areas Used in the Purdue Land Values Survey
Over the next several years, farmers’ costs of environmental protection will increase, caused either by increased expenses, lower yields, or both. Interest rates likely will increase a little from present levels, exports of grain will remain sluggish, and government payments to agriculture may decline. These factors, which exert a negative influence on farm earnings and thus on land values, will be at least partially offset by positive factors. Gradual increases in crop yields will continue from application of new technology in plant breeding, weed control, fertilization, and so on. The shift to reduced tillage increases the amount of land that can be farmed in a timely manner and tends to increase the demand for land. Investment in land by pension funds as a diversification strategy may also add to the overall demand for land. Important, but non-revolutionary technology probably will add to farm earnings. Examples are input control systems which permit site-specific placement of fertilizer and herbicides, biological pest control, and herbicide-resistant varieties. Small but continuing increases likely will occur in the use of com for ethanol production.
Overriding these plus and minus factors in the land market is the distinct probability of a major shortfall in grain and soybean production sometime within the next several years, possibly as early as 1993, according to some “El Niño” observers. When a reduction in world production of grain occurs, stocks will be drawn down, prices will rise, and a more optimistic view of the future of farm profits could develop. Land prices likely would rise in response to higher expected returns. In addition, the rent multiple tends to increase when a definite rising trend in earnings is identified.
The cash rent multiple in Indiana and several other Com Belt states is well below the recent high records of the late 1970s to early 1980s. Although the multiple is higher than the low levels of 1985-88, it is a little lower than the average of the fairly stable period of 1967-72. Thus, there is the probability that the effect on land values of a few years of increasing returns to land could be magnified by a simultaneous increase in the value rent multiple.
Cautious investors would be well advised to buy and finance land assuming that land values over the rest of the decade will do little more than keep up with inflation (little or no increase in “real” values); however, we believe that there is more upside potential in land values than there is downside risk even though, in the very short run, slight decreases might occur. Remember, too, that because of the imprecise nature of land value estimation, a reported change of 1-3% per year either up or down may simply indicate a stable market rather than a trend.
********************
The land values survey was made possible by the cooperation of professional farm managers, appraisers, brokers, hankers, and persons representing the Farm Credit System, the Farmers Home Administration, ASCS county offices, and insurance companies. Their daily work requires that they keep well-informed about land values and cash rent in Indiana. The authors express sincere thanks to these friends of Purdue and Indiana agriculture. They provided over 350 responses representing most of Indiana’s counties. We also express appreciation to Sandy Dottle of the Department of Agricultural Economics for her help in conducting the survey, and to Ag Econ Professors Chris Hurt and Mike Boehlje for their review of this report and helpful suggestions.
