Taxes, the Budget, and the 2007 Session of the Indiana General Assembly
June 18, 2007
PAER-2007-4
Larry DeBoer,* Professor
![]()
![]()
![]()
![]()
![]()
The 2007 session of the Indiana General Assembly finished its chores on time. Legislators passed a balanced budget with significant increases in education funding. They provided property tax relief for homeowners and provided new revenue options for local governments.
This article asks some questions, and attempts some answers, about the budget and tax policies passed by the 2007 Indiana General Assembly. Has the state’s budget climbed back to fiscal health? Will Indiana be ready if another recession comes sooner rather than later? And, did the legislature make substantial changes in Indiana local finance, or was the property tax relief a mere short-term fix?
* Larry DeBoer is a leading expert on Indiana taxation issues. He routinely assists the Indiana Legislative Services on Indiana tax matters.
The State Budget as a Checking Account
It’s useful to look at the state budget as if it were a checking account. Table 1 takes budget figures from various sources and arranges them in checking account form. The state starts the fiscal year (every July 1) with money in the bank, the Start of Year Balances. During the fiscal
year, revenues arrive from the state’s taxes and other sources. Appropriations are authorized by the state’s budget, and the money is spent. The state can make adjustments to revenues and spending, by transfer- ring money from other accounts, by spending less than the budget authorizes (reversions), or delaying payments to future fiscal years. Start of year balances, plus revenues, less expenditures, plus adjustments, equal End of Year Balances. Balances are kept in several different funds, including the general fund and the rainy-day fund. The total is shown here. A measure of fiscal health is balances as a percent of revenues, or of budget size. Ten percent is a prudent level; 5% is the recommended rock-bottom-minimum. The state keeps track of the total payments it has delayed as part of adjustments, in the Payment Delay Liability.
Data are combined from several sources to make this table. The revenue figures are from the state’s April forecast. The 2007 revenues will change slightly at the July closeout. The 2008 and 2009 revenue figures are good until the December revenue forecast. The appropriations figures are from the Legislative Services Agency’s fiscal note, prepared after the session ended. Balance and payment delay figures require some guesswork. It appears that more of the payment delays will be reversed in 2007 than had been estimated at the beginning of the fiscal year. The next official balance data will be available at the July closeout. The balance figures here are preliminary tabulations from the State Budget Agency.
Revenues and Appropriations
The state’s checking account shows that sales, individual income and gaming tax revenue are expected to grow faster in 2008 and 2009 than they did in the current biennium. Corporate income tax revenue is expected to grow more slowly. All Other revenue is expected to drop slightly. One reason for this is that added earnings from higher interest rates, and the tax amnesty program, increased other revenues in 2006 and 2007. These will not add to other revenues in 2008 and 2009.
The two big revenue changes during this past session don’t show up in this table, because they aren’t included in the general fund. The cigarette tax increase from 55.5 cents per pack to 99.5 cents per pack will raise an additional $200 million a year. This revenue will go mostly for health insurance for low income people, which is not a general fund appropriation. The two “racinos” (that’s the State House name for the horse tracks with slot machines) are expected to pay $500 million in fees over the next two calendar years. That revenue will be devoted to property tax relief, in a program not included in the general fund or property tax replacement funds shown here.
Overall, revenue is expected to continue to grow in the next two years as it has during the current biennium. This was a disappoint- ment, because the December forecast had predicted more rapid sales and income tax growth. The April forecast revision reduced the revenue forecast by about $150 million over the three forecast years, 2007, 2008 and 2009. The Indiana economy is growing more slowly than expected.
Appropriations for K-12 and higher education will grow faster in the 2008-09 budget. Increases are 4.3% annually for K-12 education in 2008 and 2009, and 5.7% for higher education. This compares to 1.4% and 2%, respectively, in the tight budgets of 2006 and 2007. General fund spending on property tax relief is expected to decline in 2008 and 2009 from past levels. This is because this budget’s property tax relief program is funded outside the general fund budget. Appropriations for the new insurance program for low income people also are not included in the general fund. Other appropriations increases were in line with the current budget. The All Other category has grown so rapidly in the past two biennia in part because of rising insurance costs for state employees.
Total appropriations are scheduled to increase 3.5% per year during the coming biennium. This is more than in the current biennium, but still slower than during the previous three budget cycles. Once again, this slower growth is due partly to the exclusion of the health insurance and property tax relief programs from this budget. All-in-all, the coming fiscal years will be more like past than the 2006-07 budgets.
Balances and Fiscal Health
The budget is balanced in both 2008 and 2009. This is shown by the positive numbers on the “Current Year Surplus/Deficit” line. This table sums the numbers somewhat differently than the Budget Agency does, but the claims of a balanced budget get no argument here. If these projections come true, Indiana will have had a balanced budget four years in a row, after many years of deficits before that.
Balanced budgets put Indiana on the road to “fiscal health.” How will we know when we get there? Here’s a two-part definition of fiscal health for Indiana.
The state keeps balances to help it pay its bills on time, and to guard against unexpected revenue shortfalls. Payments go out on one schedule, revenues come in on another. A rule of thumb is that a state needs a minimum of 5% of its budget in balances for this “cash flow” reason. Balances also help when recessions hit. The state can maintain services and avoid tax hikes by drawing on balances. The State Budget Agency would like to see balances at ten to twelve percent of the budget to cover revenue shortfalls.
Another way of handling a recession is to use payment delays, which should rightfully be called a “fiscal gimmick.” It’s a useful gimmick, though. The state pays billions of dollars a year to local governments for property tax relief, and to schools in state aid. It pays monthly or bi-monthly. The gimmick works because the state runs on a July through June fiscal year, while the local governments use a calendar year. The state can reduce its appropriations by delaying payments to locals from one fiscal year to the next, while still paying locals the full amount promised during their fiscal year.
In fiscal 2002 and 2003, the state postponed a bit more than $700 million in local aid payments. Fiscal health requires that past delays be paid in full so that the payment delay gimmick can be used in the next recession. As of the end of fiscal 2007 (this June), the state will still have $282 million to re-set.
A simple definition of fiscal health is to have balances equal to ten percent of the budget, and
to have the payment delays reset.
The legislature intends that the payment delays will be re-set by the end of fiscal 2009. Unfortunately, the other part of the fiscal health prescription will not be met. By the end of fiscal 2009 Indiana is expected to have balances of $865 million, only 6.4% of the budget (see Figure 1). Ten percent would be $1.35 billion in 2009. Balances in 2009 will be more than $450 million short of ten percent.
This is an improvement over 2007. Balances are expected to fall short of ten percent by about $380 million at the end of fiscal 2007. Add the payment delay liability, and that’s more than $650 million. We’ll move $200 million closer to fiscal health by the end of 2009, if all the estimates pan out.
Should a recession occur before 2010, however, Indiana will not be ready. At the start of the last recession the state had balances of almost two billion dollars. This reduced the need for tax hikes and budget cuts. If a recession occurs before 2010, tax hikes and budget cuts will have to be considered right away.
The new state budget is balanced in both fiscal years, 2008 and 2009. It increases appropriations for K-12 and higher education by a lot more than during the 2006 and 2007 fiscal years. It resets the local government payment delays, so they’ll be ready to use in the next recession (whenever that is). But it falls well short of the prudent range for balances as a percentage of the budget, by more than $450 million.
We’ll have more education spending over the next two years. But this budget will be in big trouble if a recession comes sooner rather than later.
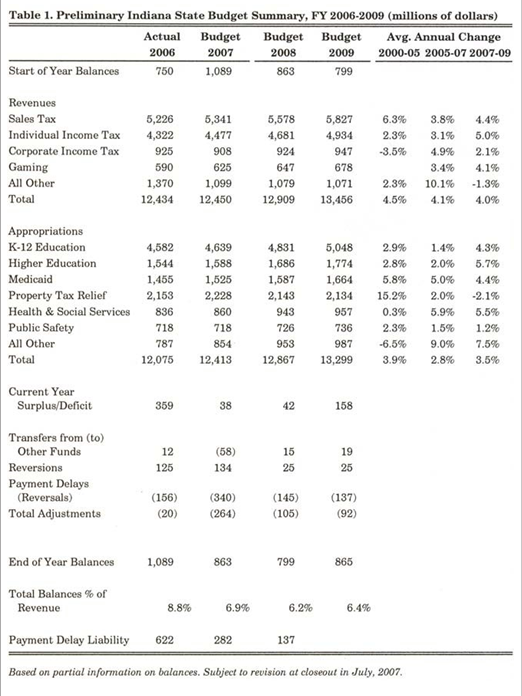
Table 1. Preliminary Indiana State Budget Summary, FY 2006-2009 (millions of dollars)
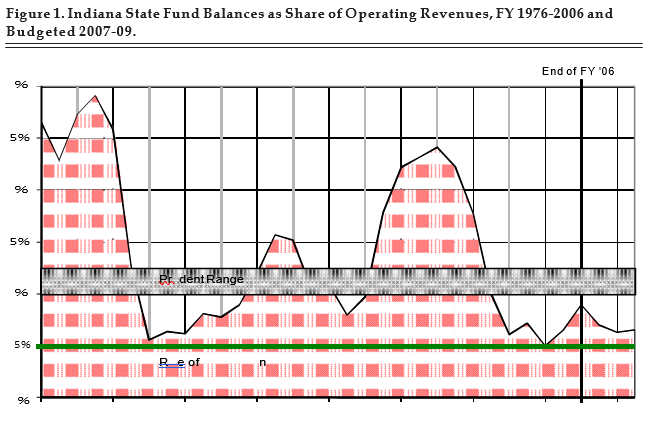
Figure 1. Indiana State Fund Balances as Share of Operating Revenues, FY 1876-2006 and Budgeted 2007-09.
Property Taxes in 2007
Estimates prepared in March 2006 showed that 2007 property tax bills for Indiana homeowners would increase a lot. Late in the legislative session revised estimates showed that homeowner taxes would increase even more. The General Assembly responded to this problem with a short term fix, but also with more substantive changes in local finance which could have far-reaching effects.
Tables 2 and 3 show a breakdown of estimated property tax bill changes for owners of various classes of property, for 2007 and 2008 respectively. These estimates are produced with an elaborate model of the Indiana property tax, based on assessment data from millions
of property parcels and tax levy and rate data from thousands of Indiana local governments. Assessed values and levies are extrapolated to the future based on past trends, and then the effects of policy changes are simulated.
The Agricultural column shows the estimated statewide average tax bill change for owners of agricultural residences, and agricultural land, buildings and equipment. The All Residential column includes owner-occupied primary residences, known as homesteads, along with rentals and second homes. The Commercial, Industrial and Utility columns show tax bill changes for classes of business property.
The last column in Tables 2 and 3, Average Homestead, shows the effect of each policy on an average homestead, an owner-occupied primary residence with a market value of $122,000 in 2006, using the homestead deduction and the mortgage deduction. After trending in 2007 and 2008 its assessed value is $156,000. It differs from the Residential Homestead column because the average homestead is assumed to be unchanged between 2006 and 2007. The Residential Homestead column includes the value of new construction, as well as the effects of several smaller home- owner deductions. Legislators were particularly interested in the effects of policies on the average homestead.
The baseline tax change estimates include the effects of annual tax levy increases by local governments, the effects of new construction and other changes in the property tax base,
and the combined effects of a host of smaller tax policy changes. In 2006 and 2007 the General
Assembly allowed school corporations to increase their property tax
levies, to offset the smaller than usual increase in the state aid. Bigger than usual increases in welfare and juvenile detention levies were also projected. New deductions for business equipment shifted taxes from businesses to other taxpayers. The baseline estimates show larger-than-usual increases in property tax payments for all classes of property in 2007.
Three major policy changes enacted prior to the 2007 session made the estimated 2007 tax bill increase for homeowners particularly large. Two more changes had big effects, but they offset one another. The policy effects are shown in Table 2. Each of these policy changes was modeled separately, to show its individual effect on tax bills. The individual effects do not always
sum to the total change because some of these policies interact when used together.
- In 2007 51 counties will exempt inventories from property taxes for the first time, joining 41 counties that had exempted inventories earlier. Taxes formerly paid by owners of inventories will shift to owners of other kinds of taxable property, including homeowners. Inventory tax elimination is projected to add 3.7 percentage points to the homeowner tax bill increase statewide. It provides a significant tax break to owners of commercial and industrial property.
- In 2007 assessors will adjust real property assessments for changes in market values from 1999 to 2005. Trending data now available for 41 counties show that in many counties residential real property assessments are being trended upward much more than non-residential real property assessments. This creates a tax shift from non-residential property owners to residential property owners. Trending is estimated to add 10.5% to the homeowner tax bills statewide.
- In 2007 state property tax relief payments will be capped at just over two billion dollars. Tax relief has become the second largest item in the state budget, after K-12 education (see Table 1). In 2006 the General Assembly placed an upper limit on these credit payments. The cap will reduce tax credit rates by about 8%, so taxpayers will pay more. The cap is expected to add 3.7% to the average homeowner tax bill increase, statewide.
- To reduce homeowner tax increases in 2006, the General Assembly passed an increase in the home- stead credit from 20% to 28% of eligible levies. This cost the state budget about $100 million. In 2007 the credit was scheduled to drop back to 20%, and this would add about 5.5% to homeowner tax bills. It has no effect on taxes paid by businesses, because the credit reduces homeowner tax payments after tax rates are calculated.
- To offset this decrease in the homestead credit, for 2007 taxes the homestead deduction was increased from $35,000 to $45,000. This cuts 5.1% off the baseline tax bill increase of the average home. It adds to the tax bill increases of agricultural and business property, because the added deduction subtracts from the assessed value of home- stead property. Tax rates must increase to raise the authorized tax levy. Non-homestead taxpayers pay more.
Combined, the baseline tax bill increase and the five major policy changes are expected to increase the average homeowner’s tax bill by 23.6%. The legislature had been advised in March 2006 that the increase would be large (the estimate was 15%). New data on trending became available by the last week of the session, and the homeowner tax bill estimate increased to nearly 24%.
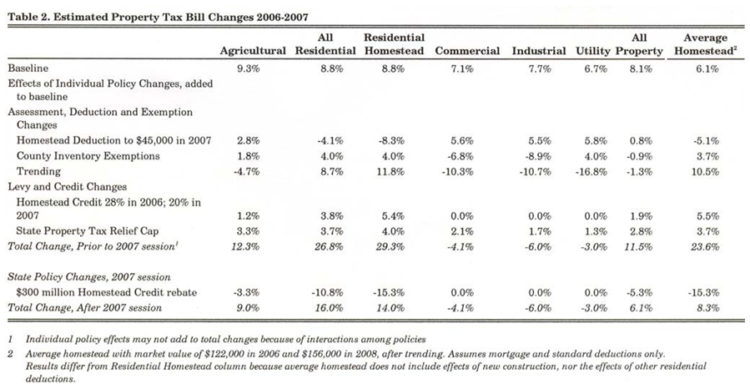
Table 2. Estimated Property Tax Bill Changes 2006-2007
Property Taxes in 2008
Estimated tax changes for 2008 are much smaller than in 2007, but still larger than usual (see Table 3). The baseline changes are smaller because most of the policy effects that raise the baseline in 2007 will have run their course. Trending and the state property tax relief cap add to homeowner tax bills, but less than in 2007. Trending has a much smaller effect because assessors will be advancing values by one year instead of six. Two policy changes have big effects in 2008.
The homestead deduction was scheduled to drop back to $35,000 in 2008. This would have increased the share of homestead property in the tax base, adding 5.3% to homeowner tax bills, but subtracting similar amounts from non-homeowner tax bills.
In 2008 the base rate assessment of a farm land acre will increase 30% from $880 to $1,140. This number is the starting point for the assessment of farm land. Land assessments are then adjusted for soil type and other features such as forest cover and flooding. Farm land is not assessed based on market value, but based on its “use value” in agriculture. This protects farmers from speculative land value increases.
But the base rate is subject to trending. It will be re-calculated each year starting with taxes in 2008, based on a capitalization formula, which measures net income per acre and divides by an interest rate. Increases in commodity prices, particularly corn, are raising farm income in this formula. This increase in farm land assessments is estimated to add 8.3% to the average agricultural property owner’s tax bill in 2008.
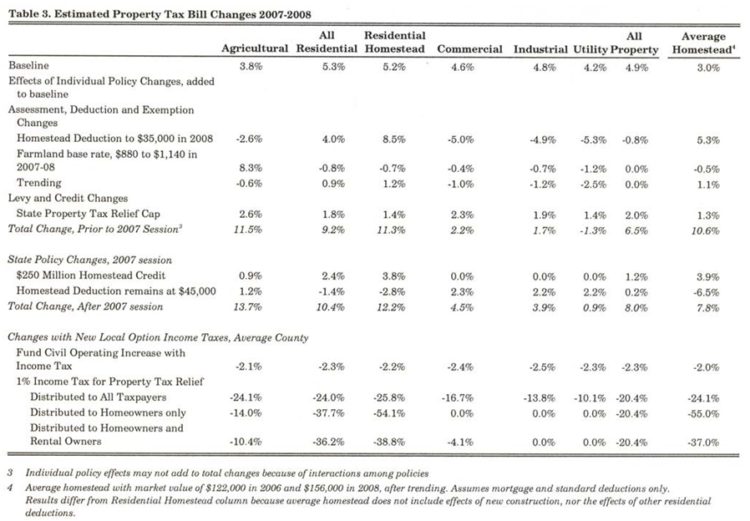
Table 3. Estimated Property Tax Bill Changes 2007-2008
State Tax Relief Passed in 2007
The General Assembly could not allow homeowner property taxes to rise an average of 24%. Legislators responded by pledging $300 million in new tax relief for homeowners in 2007, and $250 million in new relief in 2008. In 2007 homeowners will receive special rebate checks towards the end of the calendar year. In 2008 the homestead credit percentages will be increased, reducing homeowner tax bills. This new property tax relief is estimated to cut the 2007 average homeowner tax increase from 23.6% to 8.3%. The average rebate check is expected to be about $235.
Indiana has never delivered property tax relief through rebate checks before, and this procedure was criticized by some members of the General Assembly. At least one legislator admitted that the move was political, to make sure that taxpayers gave the legislature credit for delivering tax relief.
Legislators have complained that in past years substantial tax relief has been provided-state property tax relief spending has doubled since 2002-but because it reduced very big tax hikes to merely big tax hikes, many taxpayers did not realize that tax relief had been increased. Unfortunately, the rebates may create the appearance that local officials caused the large tax bill increases for the legislature to remedy. In fact, the larger part of the tax bill increases were caused by legislative changes in assessment and credit provisions. Some of these changes were forced by the 1998 Supreme Court decision which required the state to replace the old true tax value assessment system with the new market value system.
There are at least two non-political reasons for the rebate procedure. First, new higher homestead credits require the recalculation of tax bills. The counties that have already mailed their 2007 tax bills would need to recall them and issue new bills. This would create confusion.
The rebates allow tax billing to go forward as usual. However, some counties anticipated legislative changes and delayed their tax billing. In many other counties billing has been delayed by problems with trending, so fewer counties than usual would have been affected if tax bills were changed this late in the billing process.
Second, the state won’t have the money for the rebates until late in the year. Tax relief will be financed by the sale of slot machine licenses to the two race tracks, turning them into “racinos.” The first installments of these two $250 million payments are expected in the summer or fall. An additional $300 million tax relief payment before the racino money arrives would strain state balances.
In Table 3, the $250 million in homestead credits in 2008 is shown adding 3.9% to homeowner tax bills. This is because $250 million represents a reduction in credits from the $300 million to be delivered in 2007. This illustrates a problem that the legislature creates when it delivers property tax relief. Once relief is started it must be continued or tax bills will increase. Note, however, that without the $250 million in 2008 homeowner tax bills would increase by about 20% over all. The relief in 2008 represents a substantial reduction in homeowner taxes, just not as big a reduction as in 2007.
The added tax relief in 2008 will be provided by keeping the homestead standard deduction at
$45,000 for 2008, instead of allowing it to drop back to $35,000. The deduction will be reduced by $1,000 a year until it reaches $40,000 for taxes in 2013. This subtracts 6.5% from homeowner tax bills in 2008.
Homeowner tax bills are estimated to increase 7.8% in 2008, less than the 10.6% estimated prior to the 2007 policy changes. For non-residential property owners, however, the policy changes increase tax bills. The higher homestead deduction reduces the tax base and so raises tax rates. Tax bills increase for property owners who are not eligible for the deduction.
New Local Income Tax Options
The 2007 General Assembly offered local governments three new local income tax options. These could make substantial changes in the mix of property and income taxes that fund local government in Indiana, should local governments decide to use them.
First, local governments can decide to fund the annual increase in civil government property tax operating levies (that is, non-school, non-debt-service levies) with local income tax increases instead. This decision would be made by the county council in counties with the county adjusted gross income tax, and the COIT council in counties with the county option income tax. The COIT council is made up of the fiscal bodies of counties, cities and towns, with votes based on population.
Table 3 shows an estimate of the effect of this option in the average county. Property taxes
would be lower by 2% to 2.5% across all property tax types. (This shows, by the way, that civil government operating costs are not the primary drivers of property tax increases. Taxes go up, for the most part, for other reasons than added spending by counties, cities and towns on employees and other day-to-day costs.)
Second, the county council or COIT council may adopt an income tax to reduce property taxes. The maximum rate is one percent, and the money may be distributed in three ways. It can be used to reduce taxes of all property owners. It can be used to reduce the property taxes of homeowners only. Or, it can be used to reduce the taxes of homeowners and owners of rental housing. The county may select any combination of these three tax relief formulas.
Table 3 shows the estimated effects of this tax option, under all three distribution formulas. The estimated reduction in property taxes overall is 20.4% under all three formulas. Statewide, a one percent income tax raises about $1.3 billion. The total net property tax levy is about $6.3 billion, so a one percent income tax would reduce property taxes by about 20%.
The choice of a distribution formula makes a substantial difference in which taxpayers receive relief. If relief is distributed to all taxpayers, homeowner and agricultural taxes are reduced by about a quarter; business taxes by less. This is because the new local tax relief would be distributed based on the property tax replacement credit formulas, and business equipment receives a lower credit than do land and buildings.
If relief is distributed to homeowners only, the average homeowner could see his or her property tax bill cut in half. Owners of agricultural homesteads also benefit. Business property owners see no tax relief under this distribution formula. If the relief includes homeowners and owners of rental housing, home- owner taxes would fall by more than one-third. Large apartment houses are counted as commercial property, which is why that category of property sees some tax relief under this formula.
A third local income tax option raises new money for local budgets. The county council or COIT council can adopt an added income tax to raise new revenue for public safety. Public safety is broadly defined, as police and fire, emergency medical services, corrections and juvenile services, and includes current operating costs, debt service and pension obligations. The maxi- mum rate is 0.25%, and most counties must adopt the two property tax relief income taxes to be allowed to adopt the public safety rate.
The deadline for adopting local income taxes will now be August 1. It had been April 1. The legislature wants counties to be able to consider these options this year, for taxes
in 2008.
Income Taxes and Property Taxes
The local income taxes could deliver substantial property tax relief. But those same taxpayers may pay higher income taxes. How much taxpayers benefit overall from local income taxes depends on what they own, what they earn, where they live,
and how their county decides to distribute tax relief.
The most important factor is the comparison of a taxpayer’s taxable income and the assessed value of his or her property. Taxpayers with more assessed value and less taxable income tend to benefit when income tax rates rise and property tax rates fall. People who pay less generally include farmers, retired homeowners and property owners who live outside the county. This latter group includes most corporate businesses. People with more income and less property tend to pay more when income taxes increase to reduce property taxes. People who pay more include renters (at least at first), and, generally, employed homeowners.
We can estimate a “break-even” income for the average employed homeowner. In 2008, the average homestead in Table 3 has an assessed value of $156,000 and a net tax bill of $1,714 after deductions and credits. This homeowner’s tax bill would fall 24.1% if a one percent income tax was distributed to all property taxpayers. That’s a $413 saving. However, with a one percent income tax, any homeowner with a taxable income of more than $41,300 would pay more in total. A majority of employed homeowners would end up paying more total taxes. (Remember, these are statewide averages. The “break-even” income will vary depending on local property tax rates and the amount a one percent income tax raises in each county.)
If the tax relief is distributed to homeowners exclusively, though, the tax bill is cut by 55%, $943. Home- owners with taxable incomes less than $94,300 would see total tax cuts. A large majority of homeowners would fall into this category. If the relief is also distributed to owners of rental property, the break-even homeowner income is $63,400. Again, most homeowners would pay less overall.
Unless tax relief is distributed to all property owners, those taxpayers who have income in the county but do not own residential property will probably pay more overall.
Such property owners receive no tax relief when it is distributed to residential property only, but would pay higher income taxes. Income earned by large corporations is not subject to local income taxes, so those businesses would not see an effect from either tax.
Renters own no property, but may pay income taxes. An income tax that reduces the property tax will increase the total tax bills of renters. But it’s possible for renters to benefit from property tax relief. Lower property taxes paid by landlords make rental property more profitable. In pursuit of these profits, more rental property may be made available. This added supply of rentals could reduce rents, or at least slow their increase, as landlords bid to attract renters. Low income renters, who pay little in added income taxes, could benefit if lower property taxes create a boom in rental housing.
Where taxpayers live also matters. There are different property tax rates in different parts of a county, but the added income tax rate would be the same for the whole county. Suppose local governments decide to pay for their levy increase with an income tax instead of property taxes. The localities that have the highest levy increases receive more of the added income tax from all county taxpayers, no matter where the taxpayers live. Taxpayers would
pay for services in jurisdictions other than where they live.
Band-Aid or Substantial Change?
The tax relief passed for 2007 and 2008 might be called a band-aid, in that it merely postpones the problem for another two years. The new homestead credits are not funded for 2009. If this $250 million in property tax relief disappears, homeowner tax bills are likely to rise 10% or so, in addition to the increases that will occur because of levy increases, the drop in the homestead standard deduction and trending. A 15% increase is plausible. In other words, by mid-2008 we’ll be right where we were in mid-2006, looking ahead to a big homeowner property tax increase. It’s a problem postponed.
What will the General Assembly do in 2009? Perhaps legislators will find money in the state budget to extend homeowner tax relief for additional years, as they have so often in the past.
Or perhaps the 2007 General Assembly has handed the property tax problem to local governments. The new income tax options allow counties to deliver a large amount of property tax relief to homeowners or taxpayers more broadly. The options also allow local governments to freeze non-school operating levies at current levels, funding levy increases with income taxes instead. If legislators do not fund added tax relief, local governments may face pressure to fund it with local income taxes.
When the next homeowner property tax problem hits in 2009, the General Assembly may act. Or, state legislators may say to local officials: it’s your problem now.
If so, Indiana’s system of local finance will undergo substantial change. Depending on what state and local governments do in 2009, this year’s tax legislation may be way beyond a band-aid.
![]()
![]()
![]()
![]()
![]()
