The 2008 Farm Bill ACRE Program: Overview and Analysis for Indiana
May 18, 2009
PAER-2009-6
Roman Keeney, Assistant Professor and Tamara Truax, Graduate Student
![]()
![]()
![]()
![]()
![]()
The Food, Conservation, and Energy Act of 2008 (2008 Farm Bill) was debated and enacted into law during a period of record high prices for many crop commodities. With market forecasts for prices that were considerably higher than target prices, the U.S. Congress turned its attention to reorienting farm commodity policy to bolster the farm revenue safety net. This resulted in a new optional counter‑cyclical revenue program named Average Crop Revenue Election (ACRE). Beginning with the 2009 crop year, farmers with pro‑ gram crop base acreage may choose to enroll any of their Farm Service Agency (FSA) farms in this program in return for foregoing counter‑cyclical payments (CCP), 20% of their direct payments (DP), and 30% of the loan rates used to trigger loan deficiency payments (LDP) and marketing loan gains (MLG). Farmers who choose not to enroll in ACRE will remain eligible for counter‑cyclical payments and will not be subject to the reductions in direct payments and loan rates—a continuation of the 2002 Farm Bill program.
ACRE Program Basics
The option to enroll in ACRE is avail‑ able for each FSA farm. The signup period for ACRE for the 2009 crop year began in late April and must be completed by August 14, 2009. Farmers who decide not to enroll in ACRE in 2009 will again have the option to enroll in remaining years of the program’s authorization (2010‑2012). However, once a FSA farm is enrolled it must stay in the ACRE program through 2012 and all crops grown on a FSA farm are subject to the ACRE rules for payments. The irrevocable nature of ACRE means that all interested parties (including cash‑rent landlords for the particular farm) must consent to the enrollment in ACRE.
ACRE works as a counter‑cyclical revenue program that makes payments when per acre crop revenue falls short of benchmark levels. The size of the payment gets larger as the revenue shortfall becomes greater (up to a cap of 25% of the state benchmark revenue). Similar to farm payments with target prices, ACRE employs crop revenue benchmarks to determine when and at what level payments are made. Under ACRE, two benchmarks are used, one at the state level and one at the farm. The first benchmark requires that, on average, actual crop revenue falls short of 90% of the expected level for the state for a particular crop. If crop revenue exceeds this benchmark, no producer in the state is eligible for an ACRE payment for that crop. If the state’s producers are eligible due to a state revenue shortfall, producers must also fail to meet the farm number specific benchmark revenue to qualify for an ACRE payment for that particular crop.
The fact that ACRE payments are triggered by revenue shortfalls means that the program works as a safety net against declining revenue due either to low prices or poor yields relative to historic averages. By design, the program is intended to smooth out year to year changes in revenue, allowing producers the opportunity to weather years when revenue is far short of expectations. Despite the appeal of this concept, the irrevocability of ACRE enrollment and the two trigger payment system complicates the decision to enroll in ACRE. The up‑to four year (2009‑2012) commitment to be in the program means that producers must form an estimate of the long‑run benefit of the program in an era of uncertain output and input prices and convince partners and landlords that these benefits favor enrollment. As part of this, the producer must also form some expectation about how farm‑level yields will evolve over the next four years relative to the state average. Under the dual‑trigger system an individual farm can have a poor revenue year, yet be shut out of ACRE payments if the state, on average, meets crop revenue expectations. Thus, ACRE is not a direct substitute for crop insurance on individual farms.
Payment Triggers and Calculation for ACRE
Table 1 provides an example of calculating an ACRE payment. The first step is to evaluate whether any ACRE payments are made by checking actual state and farm per acre revenue against the program benchmarks. Line 6 of the table gives ACRE revenue benchmarks for the example calculated as the program yield multiplied by the price. The ACRE program yield (both state and farm) is calculated as an Olympic average (both high and low value dropped) of the most recent five years. The ACRE program price is calculated as the national aver‑ age price for the crop over the two most recent marketing years. Thus, if we assume the example values in Table 1 to be appropriate for an acre of corn on an Indiana farm in 2009, line 1 would be the average yield from 2004‑2008 (with the best and worst yield dropped from the calculation) for both the state and the farm. Line 2 shows us the national aver‑ age price for the 2007 and 2008 crop marketing years.
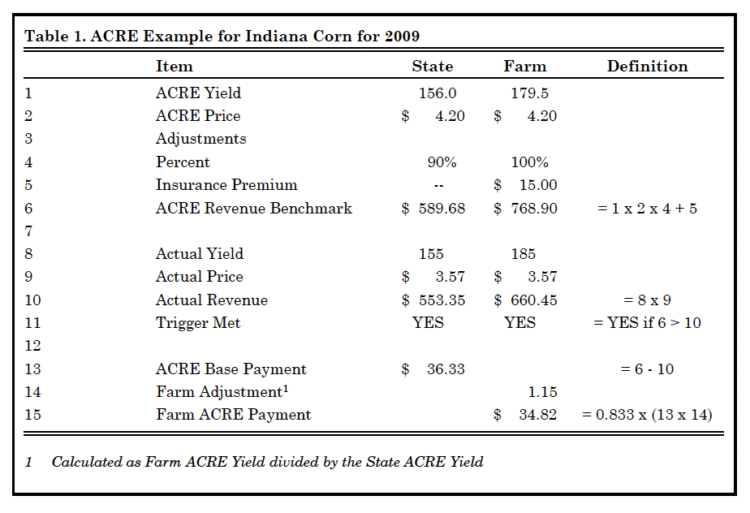
Table 1. ACRE Example for Indiana Corn for 2009
In calculating per acre revenue benchmarks, an adjustment is made to the (price x quantity) value for both the state and the farm. The state revenue benchmark is multi‑ plied by 90%, meaning that state corn revenue has to fall by more than 10% on average for any acre of corn to be eligible for a payment. No percentage adjustment is made at the farm level. In fact, farmers are allowed to add the per acre crop insurance premium they pay for the crop year in question (see the assumed value of $15.00 in line 5), which increases the chances that actual farm‑level revenue will fall short of the benchmark. Thus, there is an incentive to purchase crop insurance as a complement to ACRE, but there is no requirement to have crop insurance coverage to enroll in the ACRE program. With the bench‑ mark values set, all that is needed is the crop year revenue to determine payment eligibility.
In the example, we assume the corn price for the 2009 market year falls 15% to $3.57, from the $4.20 average of the previous two years (note that this is simply an illustration and not a forecast of the 2009 marketing year price). This price drop is enough with yields near the average level to generate both a state and farm‑level revenue shortfall, as indicated on line 11 of Table 1. If either benchmark had been exceeded by actual revenue, no ACRE payment would be made for corn on this farm. With revenues short of both bench‑ marks, we proceed to calculate the ACRE payment level as indicated in lines 13‑15.
The first step is to calculate the state level ACRE base payment, found by subtracting state actual revenue from state benchmark revenue (line 13). Then on line 14 the state level base payment is adjusted based on the ratio of the individual farm level benchmark yield to that of the state. For the example farm in Table 1, the farm’s corn yields are 15% higher than the state average and thus the acre base payment is multiplied by a factor of 1.15. Finally, the ACRE program just like counter‑cyclical and direct payments pays out on only 83.3% of base acres (a value that rises to 85% in 2012) so that a final adjustment is made in line 15 to get the ACRE payment of $34.82 per acre of corn planted or considered planted.
From the example in Table 1, we see that the key element in the decision to enroll in ACRE is the producer’s expected price for the coming year. In our example, if the corn price falls to only $3.80 instead of $3.57, the state benchmark is exceeded and no ACRE payments are made. If the price is below $3.80, ACRE payments are made, but may be too small to recover the direct payment amount foregone (20%). How much are those direct payments? If we assume this acre of corn annually receives $30.00 per acre in direct payments, the cost of enrolling in ACRE is $6.00. The national average market price must fall to $3.76 in order to trigger an ACRE payment of about $6.00 per acre in this example. But also keep in mind if prices, in this example, are above $3.76 one would be better to not be in ACRE for 2009. In May 2009, USDA was projecting 2009 corn prices to be in a range of $3.70 to $4.50 per bushel. However, this was very early in the growing season and more information will be available about the 2009 growing season before the final ACRE decision has to be made for 2009 by no later than August 14, 2009.
Factors Influencing ACRE Enrollment
The break‑even analysis conducted for the example farm highlights the importance of anticipating price changes in determining the benefits of ACRE enrollment. However, Indi‑ ana FSA farms will differ widely in their preference for ACRE due to the crop mix they have on their farm, the direct payment (DP) and counter‑cyclical payment (CCP) yields used as the basis for payments, and how closely related their yields are to the state average. Table 2 reports on these factors across the state for corn, soybeans and wheat, using the nine National Agricultural Statistics Service (NASS) Crop Reporting Districts (CRD).
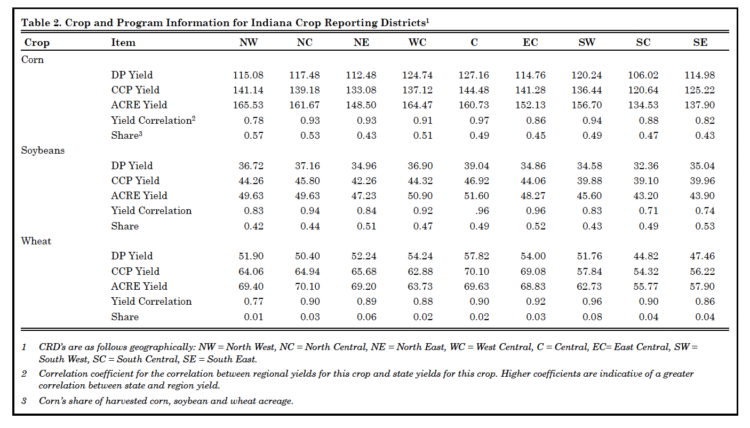
Table 2. Crop and Program Information for Indiana Crop Reporting Districts
We estimate the program yields reported in Table 2 at the CRD level by taking the average yield for 1985‑1989 (DP), 1997‑2001 (CCP) and 2004‑2008 (ACRE; an Olympic average). CRD and state yield correlations in Table 2 are calculated for 1999‑2008 to determine how closely crop yields track the state average for different regions.
The shares in Table 2 represent the portion of harvested acreage from 2004‑2008 in each CRD for each program crop. The shares in each region total to 1.00 or 100%. For example, corn accounted for 57% of the harvested acreage in the Northwest CRD (NW).
Table 2 shows that one benefit of enrolling in ACRE is the ability to update program yields to more recent crop years. For both corn and soybeans which take up the majority of acreage in Indiana, ACRE program yields in 2009 will be more than 30% higher than the yields used as the basis for direct payments and more than 10% higher than the yields used for CCP. This extension of coverage to relatively current yields carries forward as the ACRE program yield is updated annually to the most recent five‑year Olympic average. The state to CRD yield correlations shows consistent and strong positive correlations between changes in the state average yield and regional aver‑ age yields for most regions of Indiana. Higher correlations suggest that state and regional yields tend to move in the same direction. When the state has high yields, the CRD’s tend to have high yields, and the same is true for low yields. The maximum correlation is 1.0 which means the yields in a CRD move in lock step with the state yields. Generally, an individual farm’s yields will be less correlated with state yields than CRD yields are correlated with state yields.
Even with the advantage of updating program yield coverage, the most critical element likely to affect ACRE enrollment is the ability to obtain revenue coverage that is benchmarked to the strong market prices for 2007 and 2008. The 2007 and 2008 prices for corn, beans, and wheat that are built into the ACRE program’s revenue guarantee will be nearly double the CCP target price for those crops. In our example in the previous section, a corn price that fell to just $3.80 per bushel was enough to trigger an ACRE payment. In the regular program, the corn price must fall to $2.35 per bushel to generate CCP payments. From this, we see that prices would have to drastically drop to begin generating CCP payments. While several forecasts have prices holding reasonably steady over the coming four years, in the event they do fall drastically, the ACRE pro‑ gram has a built in limit to how much program benefits could fall as the state benchmark revenue is limited to a 10% change from year to year.
Analysis of ACRE for Indiana Crop Regions
To get an idea of how program benefits might vary across Indiana we use the information in Table 2 as representative farms from each region in the state and consider how ACRE performs under two price scenarios: one where prices are relatively flat (following the FAPRI forecasts**) and one where prices decline over the next four years at a constant 15% rate. These two scenarios are depicted in Figures 1 and 2. Using these prices for comparison and the ACRE decision tool developed at Texas A&M’s Agricultural and Food Policy Center (AFPC) we analyze the expected payments that ACRE would generate under each scenario.***
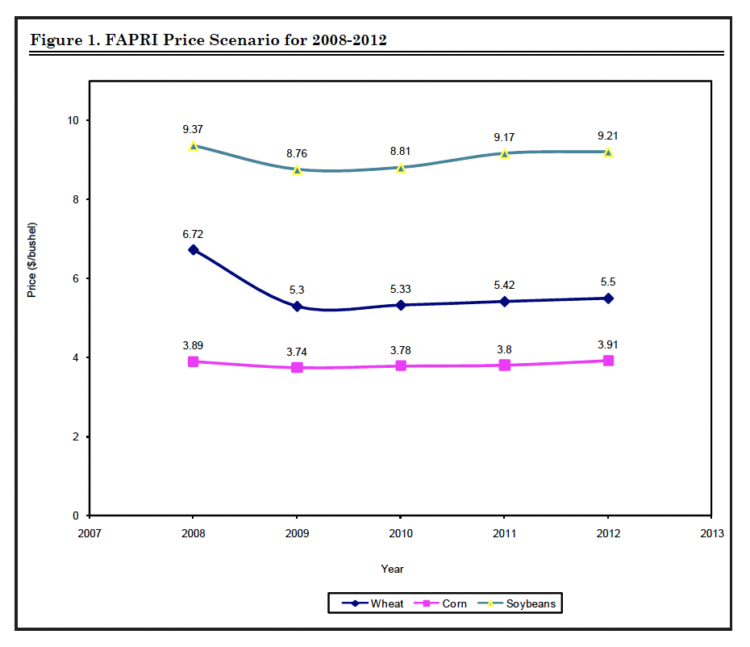
Figure 1. FAPRI Price Scenario for 2008-2012
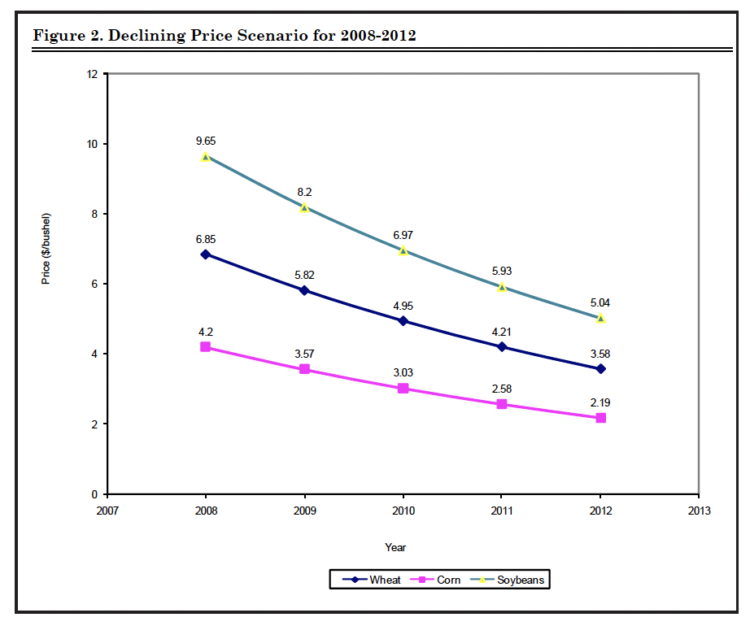
Figure 2. Declining Price Scenario for 2008-2012
The ACRE decision tool at AFPC allows farmers to input their own information on crop yields, acreage rotation, etc. to analyze each FSA farm. This AFPC decision tool is particularly well‑suited to this task because it considers uncertainty in future prices and yields in its calculation of the expected ACRE payments for a given farm. Given the differences across farms that will be important determinants of the benefits (and costs) of enrolling in ACRE, producers should conduct their own analysis. Our use of it here is just to provide an overview of the expected payments from ACRE relative to those from the regular Direct and Countercyclical Program (DCP) using historical data at the CRD level.
Table 3 reports the average difference per year in per acre government payment receipts (ACRE minus DCP) for each CRD in Indiana for the 2009‑2012 period, as well as this difference for the first and last year of the program. If prices hold fairly flat over the life of the ACRE pro‑ gram consistent with FAPRI projections, then the ACRE program is expected to generate between $11.00 and $15.00 extra dollars per acre per year in government payments for Indiana CRDs. If prices fall sharply and consistently, the expected gain in payments from being in ACRE increase to between $31.00 and $43.00. In our analysis of flat and falling prices, there was no year for a CRD in which the ACRE payment total was below that of the DCP program. Looking at the expected payment differences in the first and final year under each scenario, we see that a good deal of the advantage of the ACRE program are the relatively high 2007 and 2008 prices that set the initial revenue benchmarks.
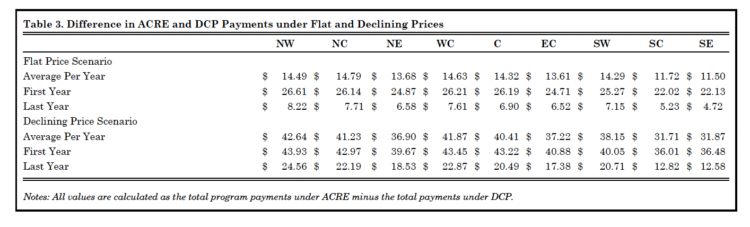
Table 3. Difference in ACRE and DCP Payments under Flat and Declining Prices
As prices stabilize or fall, these benchmarks generate large per acre payments that erode over time as the benchmark adjusts each year to new lower prices. With a large portion of potential benefits of ACRE built into the 2009 benchmarks, the importance of coming to an informed conclusion regarding ACRE in 2009 becomes apparent in spite of the fact that the irrevocable enrollment in ACRE may be undertaken any time in the next four years.
There is of course the possibility of rising prices in coming years. In this situation, the likelihood of receiving ACRE payments is small, and therefore staying out of ACRE could be the optimum decision because one would not incur the penalties of 20% lower direct payments and 30% reduction in loan levels.
Concluding Comments on ACRE
The fact that ACRE is offered as an optional enrollment program as opposed to a mandated change indicates that there is some uncertainty about the potential benefits across program crops. The analysis here shows that for the typical program crops in Indiana the ACRE program has the potential to generate significantly higher program payments if prices fall only slightly or steeply decline. Of course if prices for corn and soybeans increase, the ACRE program revenue benchmarks will be exceeded at the state level and no payments will be made and enrollees will lose 20% of their direct payments and loan levels are reduced by 30%. For most farms, the decline in direct payments will be in the range of $5 to $7 per acre, which can be viewed as the cost of ACRE’s revenue protection benefits. While these costs and benefits must be weighed by individual decision makers for each of their eligible farm numbers, the high current prices, ability to update yields, and the 10% limit on changes in benchmark revenue all represent structural incentives in the ACRE program that will encourage enrollment.
Specific facts and circumstances on a particular farm may overwhelm the ACRE incentives however. An obvious situation would be where a farm’s yields poorly track those of the state average. In this situation, one could imagine a farm in a drought‑stricken area that could incur significant revenue losses relative to its benchmark but receive no ACRE payments due to the state trigger not being met. This points out why ACRE is not a direct substitute for crop insurance.
Another situation likely to arise is a farm that has availed itself of the planting flexibility afforded by the direct payment program, moving to a rotation with a non‑pro‑ gram crop such as hay. Since ACRE requires all crops on an FSA farm to be enrolled, a significant amount of non‑program crops (relative to the program base acreage) means that ACRE benefits have to be even larger per acre for ACRE covered crops to overcome the cost of enrolling.
Since the signup deadline to enroll in ACRE for 2009 is not until August 14, 2009, this will provide added time to evaluate 2009 crop yield and price prospects. If yields and prices at that time appear high enough to not trigger ACRE payments, this will be a greater encouragement to not elect ACRE for 2009. The potential reason to stay out of ACRE in 2009 under this circumstance is the loss of 20% of 2009 direct payments and a 30% reduction in the loan rate. There will also be additional information on August 12 when USDA provides estimates of state and national yields. In addition, they will provide an update of their estimate of the national average prices received for the 2009/10 marketing year upon which the calculations for ACRE will be made. Producers who do not elect ACRE in 2009 can then re‑evaluate in 2010 whether to elect ACRE.
Of course the information available in early August 2009 could also more strongly encourage one to sign up for ACRE in 2009. This might be a situation where state yields and individual farm yields are expected to be low due to adverse weather in the summer of 2009, or, price prospects for the 2009 crop could be depressed. Either of these would increase the odds of triggering ACRE payments and encourage election of ACRE in 2009.
Most producers will want to continue to become familiar with the potential benefits of ACRE and also consider the costs of electing ACRE. It would also be valuable to use an ACRE Evaluation Tool such as was referenced in this article to examine each individual farm. Those who have not yet made a decision on ACRE for 2009 probably want to re‑evaluate their situation in early August when much more will be known about the 2009 crop yield and price prospects.
The USDA Farm Service Agency administers the program, so be sure to check with the local office on specific details regarding ACRE and with your individual questions.
** The Food and Agricultural Policy Research Institute (FAPRI) is a unique, dual-university research program (established in 1984 by a grant from the U.S. Congress). With research centers at the Center for Agricultural and Rural Development (CARD) at Iowa State University and the Center for National Food and Agricultural Policy at the University of Missouri-Columbia, FAPRI uses comprehensive data and computer modeling to analyze the complex economic inter-relationships of the food and agriculture industry. FAPRI projections provide a starting point for evaluating and comparing scenarios involving macroeconomic, policy, weather, and technology variables. These projections are intended for use by farmers, government agencies and officials, agribusinesses, and others for medium-range and long-term planning.
*** The AFPC’s ACRE decision tool can be accessed at http://www.afpc.tamu.edu/models/acre/index.php
![]()
![]()
![]()
![]()
![]()
