The Bears Control the 2015 Indiana Farmland Market
August 6, 2015
PAER-2015-08
Craig Dobbins, Professor of Agricultural Economics and Kim Cook, Research Associate
![]()
![]()
![]()
![]()
![]()
Last year at this time there were signals that the boom propelling crop agriculture upward for ten years was running out of gas. Since then, the continued low grain prices have begun to influence things other than net farm income. Purchases of machinery, buildings, farmland, and other capital items have declined. There has also been a steady flow of reports about declining farmland values in the Midwest.
This year’s Purdue Farmland Value Survey will be another such report. This survey has been conducted in June for more than 40 years. Farmland market professionals are surveyed to track changes in Indiana’s farmland market (The individuals surveyed include rural appraisers, agricultural loan officers, FSA personnel, farm managers, and farmers. The results of the survey provide information about the general level and trend in farmland values
Farmland Values
For the state as a whole, all qualities of farmland declined. Top, average, and poor quality farmland declined by 5.1%, 3.8%, and 4.8%, respectively (Table 1). Top, average, and poor farm land quality had a per acre value of $9,266, $7,672, and $5,863, respectively. This is the first time since 2009 that all three farmland quality classes declined. In 2009, there were small declines of 0.2%, 1.2%, and 1.7% for top, average, and poor quality land, respectively.
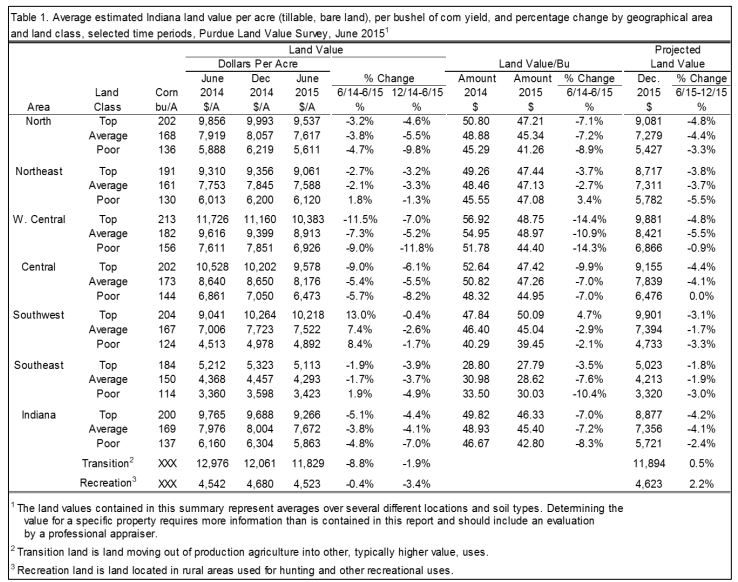
Table 1: Average estimated Indiana land value per acre (tillable, bare land), per bushel of corn yield, and percentage change by geographic area and land class, selected time periods, Purdue Land Value Survey, June 2015
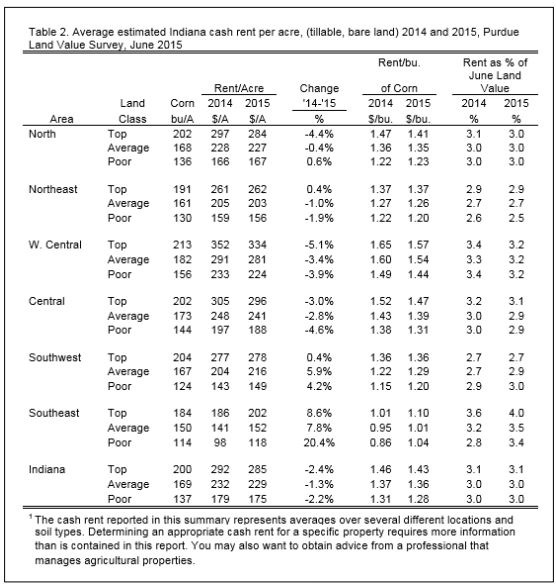
Table 2. Average estimated Indiana cash rent per acre, (tillable, bare land) 2014 and 2015, Purdue Land Value Survey, June 2015
The state average corn yield for each farmland quality was up again this year. Top, average and poor farmland had expected yields of 200, 169, 137 bushels per acre, respectively. Dividing value by bushels per acre results in a cost per bushel of $46.33, $45.40, $42.80, respectively for top, average, and poor land. On a per bushel basis there was only a difference of $3.53 between the per bushel cost of top quality land and poor quality land. Higher yields and lower per acre values resulted in lower cost per bushel in 2015. The decline per bushel ranged from 7.0% to 8.3%.
As always, there were differences by region of the state. The state was divided into the six regions shown in Figure 1.
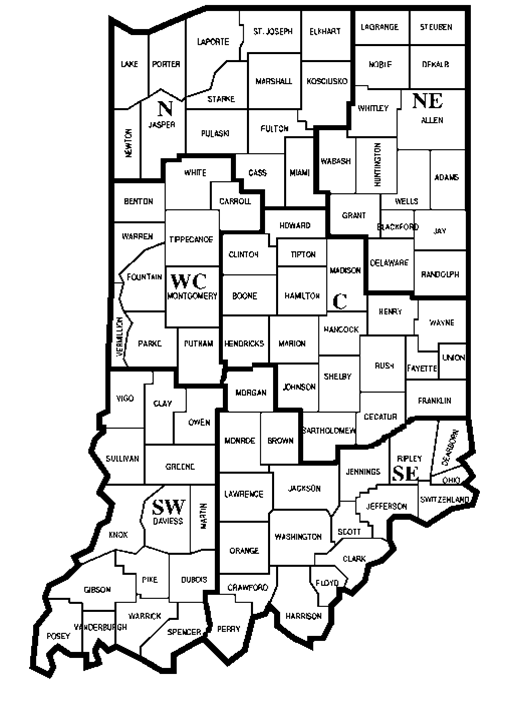
Figure 1. County clusters used in Purdue Land Value Survey to create geographic regions
Figure 1. County clusters used in Purdue Land Value Survey to create geographic regions. As with farmland values, there were differences by region of the state.
Regions of the state that have historically seen the highest farmland values, the West Central and Central regions, experienced some of the larger declines (Table 1). In the West Central region per acre June farmland values declined 7.3% to 11.5%. In the Central region, June per acre farmland declined 5.4% to 9.0%. In both cases, top quality farmland declined the most. In discussions of changes in farmland values, you often hear statements expressing the sentiment that top quality farmland is holding its value better than poor land. Data from these two regions do not support this conventional wisdom.
In the Southwest, farmland values were up. This is the only region to report an increase for all three farmland qualities.
The North, Northeast, and Southeast regions reported declines of 1.7% to 4.7% except for poor quality land in the Northeast and Southeast. Poor land in these two regions increased nearly 2.0%.
The highest per acre farmland values continue to be in the West Central region of Indiana. Top, average, poor quality farmland had values of $10,383, $8,913, and $6,926, respectively. For top quality farmland, the next highest was the Southwest region with a per acre value of $10,218. For average and poor quality land the second highest values were in the Central region. The Southeast region continues to have the lowest per acre farmland values.
The value per bushel of corn declined in all regions and land qualities except for top quality land in the Southwest region. This region reported an increase of 4.7% for high quality farmland.
Cash Rents
On a state-wide basis cash rents for all farmland qualities were lower in 2015 than 2014. Top, average, and poor quality farmland had a cash rent of $285, $229, and $175 per acre, respectively. These were decreases of 1.3% to 2.4%. This is the first time since 1999 that the survey reported a decline of all three farmland qualities. With an increase in yields and a decrease in cash rent, cash rent per bushel declined. The decline per bushel for top, average, and poor quality land was $0.03, $0.01, and $0.03, respectively.
As with farmland values, there were differences by region of the state. Some the largest declines in cash rent were in the West Central where cash rents declined 3.9% to 5.1%. Contrary to the conventional wisdom that says higher quality farmland holds it value better than poor quality farmland, the largest decline was in high quality farmland. The central region reported declines in cash rent of 2.8% to 4.6%.
In the North and Northeast regions the changes in cash rent were mixed. With the exception of high quality farmland in the North, the declines were small, ranging from 0.4% to 1.9%. The poor quality farmland in the North and top quality farmland in the Northeast reported small increases in cash rent.
Both the Southwest and Southeast continue to report increases in cash rents. The southern portions of the state had the most favorable 2014 yields in relationship to their long-term trends.
Transition and Recreation Land, and Rural Home Sites
Transitional land represents farmland moving out of production agriculture and typically into a higher value use such as residential housing or commercial uses. While both the housing market and the overall general economy show signs of stronger growth, the average value of transition farmland declined by 8.8% for the state. Since last year’s survey indicated a 22.6% increase in average value, this year’s decline is more likely a downward correction than a change in the direction of an upward trend. State-wide there was almost no change in the value of recreational land (Table 1).
These two markets are highly specialized. Values are strongly influenced by the planned use, tract size and location. Values in these markets have a very wide range. In June 2015, transitional land reports ranged from $2,800 to $35,000 per acre. Recreational land reports ranged from $1,500 to $10,500.
Because of the wide range of values in these markets, the median value (the median is the middle observation in data arranged in ascending or descending numerical order) may give a more meaningful picture than the arithmetic average. On a state-wide basis, the median value of transitional land in June 2015 was $10,000 per acre, the same value as reported in 2014. The median value for rural recreational land in June 2015 was $3,500 per acre, $375 less than in 2014.
Respondents were asked to estimate the value of rural home sites located on a blacktop or well maintained gravel road with no accessible gas line or city utilities. Like transitional farmland and recreational farmland these properties have a very wide range in value. Because of this wide range, median values are reported. The median value for five-acre home sites ranged from $8,000 per acre in the Southeast region to $11,000 per acre in the West Central and Central region (Table 3). Reported per acre median values of the larger tracts (10 acres) ranged from $8,250 per acre in the Southeast region to $11,000 per acre in the West Central, region. For 2015, the home site data indicate that the change in values was mixed. The number of regions with an increase were just about the same as the number of regions with a decrease from June 2014 to June 2015.
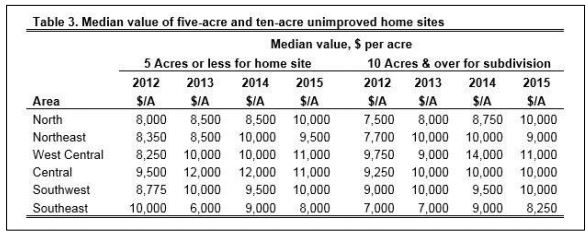
Table 3. Median value of five-acre and ten-acre unimproved home sites
Range of Responses
Tables 1 and 2 provide information about the averages of the survey responses. Averages are helpful in establishing a general value for farmland and cash rent and the direction in which values and rents are moving across time. However, it is important to remember that an average is developed from a number of responses about perceived values and cash rents.
In some cases, responses might be closely clustered around the average. In other cases, the responses may be widely dispersed because of a wide difference in the respondent’s perceptions. It is possible to have the same, or nearly the same, average with either type of dispersion. Figure 2 illustrates these properties for farmland values. The top of the vertical lines is the maximum price reported. The bottom of the vertical lines indicates the minimum price reported. The square on the line is the average.
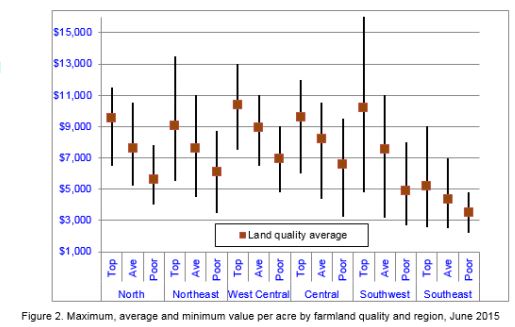
Figure 2. Maximum, average, and minimum value per acre by farmland quality and region, June 2015
Figure 3 illustrates the same information for cash rents. In both the case of farmland value and cash rent, the survey provides a general guide to values or rents but does not indicate a farmland value or cash rent for a specific farm. Arriving at a value or cash rent for a specific farm requires additional research and maybe some assistance from a professional.
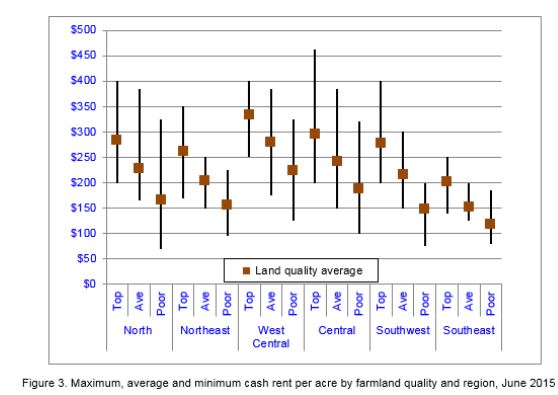
Figure 3. Maximum, average, and minimum cash rent per acre by farmland quality and region, June 2015
Cash Rent and Farmland Value
There are many factors that influence farmland values. One very important influence of farmland values is the net return generated for the farmland owner. Cash rents are used as a proxy for the owner’s return. Dividing the farmland value by the cash rent provides the farmland value to income multiple. Some refer to this as the price-earnings ratio for farmland. Regardless of the label, this measure represents how much market participants are willing to pay for $1 of annual farmland income.
This multiple has been steadily increasing from a value of 12.4 in 1986. It reached an all-time high in 2014 at 34.4. In 2015, the multiple declined to 33.5. This is only the fourth time since 1986 that the multiple has declined. (Figure 4)
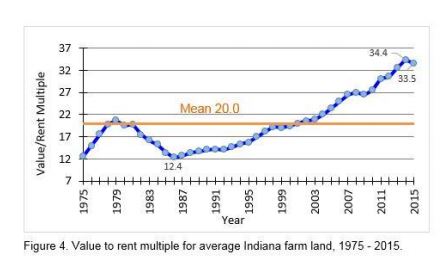
Figure 4. Value to rent multiple for average Indiana Farm land, 1975-2015
What might lead people to pay 2.7 times more for $1 of annual income on farmland in 2015 as in 1986? Three possibilities include: 1) the decline in interest rates. Economics indicates that as interest rates decline, the discount rate will decline and market participants will value future income more highly; 2) increasing expectations about the growth in the net return. Given the high margins experienced over the past several years and discussions about the need to feed a growing world population, it is likely that buyers become more optimistic about the growth rate of returns; and 3) buyers may view farmland purchases as less risky than alternative investments. This lowers the risk premium required for farmland purchases and increases the amount buyers are willing to pay for farmland.
Market Drivers
To obtain additional insight into the drivers influencing current farmland values, respondents were asked to rate eleven different items.
These items included: 1) current net farm income, 2) expected growth in returns to land, 3) crop price level and outlook, 4) livestock price level and outlook, 5) current and expected interest rates, 6) returns on competing investments, 7) outlook for U.S. agricultural export sales, 8) U.S. inflation rate, 9) current inventory of land for sale, 10) cash liquidity of buyers, and 11) current U.S. agricultural policy.
Respondents used a scale from -5 to +5 to indicate the effect of each item on farmland values. A negative influence is given a value from -1 to -5, with a -5 representing the strongest negative influence. A positive influence was indicated by assigning a value between 1 and 5 to the item, with 5 representing the strongest. An average for each item was calculated.
In order to provide a perspective on the changes in these influences, data from 2013, 2014, and 2015 are presented in Figure 5.
Respondents’ expectations of net farm income, growth in returns, and crop prices have become negative.
Expectations for some forces influencing farmland prices are still positive, but their strength has declined. These include livestock prices, interest rates, and the supply of farmland on the market. The cash position of buyers remains positive but is much less positive than in 2013 and 2014.
Another noticeable change in market drivers is agricultural policy. Agricultural policy is currently viewed as not having much influence on farmland values. In the past, agricultural policy has been an important contributor to increasing values or a mechanism for supporting farmland values.
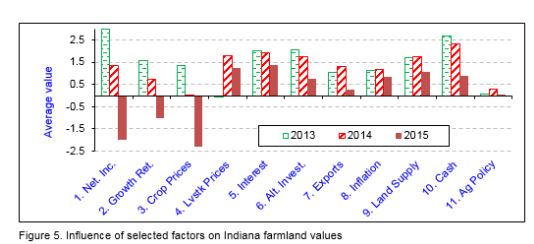
Figure 5. Influence of selected factors on Indiana farmland values
Future Expectations
The 2015 Purdue Farmland Value Survey indicates farmland values have changed directions for at least one year. To obtain a sense for what respondents see happening in the future, they were asked to forecast farmland values for the last half of 2015 and for five years into the future.
Table 1 contains the forecast for December 2015. On a state-wide basis, respondents expect farmland values to continue to move downward. State-wide farmland values of top, average, and poor farmland are expected to decline 4.2%, 4.1% and 2.4%.
On a regional basis, the expected decline in farmland values varies. The larger declines are expected in the North, Northeast, West Central and Central regions. The smaller expected declines are expected in the Southwest and Southeast. This again is likely because of very favorable 2014 yields in the Southern portion of the state.
When asked to forecast farmland values five years from now, 26% of the respondents expect farmland values to be higher. There was a smaller number of respondents in this group when compared to 2014 when 40% expected farmland values to increase. The expected increase in farmland values in 2015 was 8.6% compared to 13% in 2014. If this change is realized, this increase will be much smaller than the historical five year increase.
Twenty-six percent of the respondents expected farmland values to be the same in five years. Forty-eight percent of the respondents expect farmland values to decline. This compares to 40% in 2014. The expected average decline was 14%.
Expectations about future market conditions have a strong influence on farmland values. To obtain information about their future expectations, survey respondents were asked to provide an estimate of the average corn and soybean price for the period 2015 to 2019. On average, survey participants expect corn prices to average $4.02 per bushel, a decline of $0.68 from their 2014 estimate (Table 4). The estimated five-year soybean price decreased $2.26 to $9.76 per bushel. Both of these prices are likely to be less than the break-even price for corn and soybeans. These price expectations have quickly changed. In 2013, corn was expected to average $5.52 per bushel and soybeans $12.16 over five years.
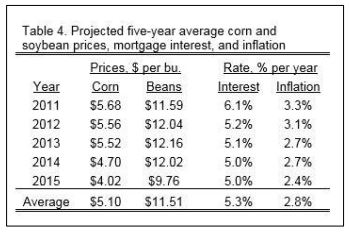
Table 4. Projected five-year average corn and soybean prices, mortgage interest, and inflation
Interest rates have important implications for real estate markets. As interest rates decline, the price of real estate tends to increase. There has been a general decline in interest rates for the past 30 years. Interest rates have reached a level where there seems to be little possibility of further declines. Signals from the Federal Reserve Bank indicate they plan to begin to raise interest rates this fall. The FED’s long-run target is to add 4% to interest rates. Survey respondents’ expectations about the average long-term interest rate over the next five years indicates an expectation that interest rates will remain low.
Inflation does not seem to be a worry. The expected inflation rate for the next five years is expected to be 2.4%. This is a decline of 0.3% from the 2014 estimate.
Given the high grain prices of the past several years and the large increase in farmland values, a period of steady or declining farmland values would not be surprising. The wet summer weather in the Eastern Corn Belt appears likely to shorten the 2015 corn and soybean crop, which may influence Indiana land values. The path that farmland and cash rent values take in 2016 will also depend on the global supply and demand for grains and oil seeds.
Concluding Comment
Lower crop prices and continued high costs have led farmland values and cash rents to decrease. In 2015 farmland values declined statewide by 3.8% to 5.1% depending on land quality. Survey respondents expect further declines in the last half of 2015.
Statewide cash rents for 2015 decreased 1.3% to 2.4%.
Based on prices for corn and soybeans in the futures market for 2016, 2017, & 2018 and the current costs of corn and soybean production, crop prices are below the total cost of production for many farmers. This means that the economic profits of the past several years have become economic losses.
Farmers will be looking for ways to reduce their cost of production per bushel and lower land costs will be one of the places they will look. For Purdue crop costs estimates, see the 2015 Purdue Crop Cost & Return Guide.
Purdue Land Value and Cash Rent Survey
The Purdue Land Value and Cash Rent Survey is conducted each June. The survey is possible through the cooperation of numerous professionals knowledgeable of Indiana’s farmland market.
These professionals include farm managers, appraisers, land brokers, agricultural loan officers, Purdue Extension educators, farmers, and persons representing the Farm Credit System, the Farm Service Agency (FSA) county offices, and insurance companies. Their daily work requires that they stay well informed about land values and cash rents in Indiana. These professionals provide an estimate of the market value for bare poor, average, and top quality farmland in December 2014, June 2015, and a forecast value for December 2015. They also provide an estimate of the current cash rent for each farmland quality. To assess the productivity of the land, respondents provide an estimate of long-term corn yields.
Respondents also provide a market value estimate for land transitioning out of agriculture and recreational land. Responses from 204 professionals are contained in this year’s survey representing all but nine Indiana counties. There were 29 responses from the North region, 33 responses from the Northeast region, 45 responses from the W. Central region, 48 responses from the Central region, 25 responses from the Southwest region, and 24 responses from the Southeast region. Figure 1 illustrates the counties in each region.
Appraisers accounted for 27% of the responses, farm loan professionals represented 32% of the responses, farm managers and farm operators provided 21% of the responses, 12% government service, and other professionals provided 8% of the responses.
We express a special appreciation to the support staff of the Department of Agricultural Economics. Tracy Buck coordinated survey mailings and handled data entry. Without her assistance and the help of others the survey would not have happened.
The data reported here provide general guidelines regarding farmland values and cash rent. To obtain a more precise value for an individual tract, contact a professional appraiser or farm manager that has a good understanding of the local situation.
![]()
![]()
![]()
![]()
![]()
