The Family Business: Differentiation in Fairness by Leadership Type
February 15, 2017
PAER-2017-4.0
Anna Josephson, PhD Candidate of Agricultural Economics and Maria I Marshall, Professor of Agricultural Economics
![]()
![]()
![]()
![]()
![]()
Succession planning is a logical component in the life cycle of a family business. For business owners who want to continue operations, even after they are no longer able, it is an imperative element of planning. Part of that planning process is determining how the successor will be treated.
Much literature has focused on the importance of determining a successor and the process involved in doing so. Mishra and El-Osta (2007), as well as Mishra, El-Osta, and Johnson (2004), highlight the importance of succession planning by determining the potential failures possible resulting from not planning for retirement. These include issues such as financial insecurity, personal and family dissatisfaction, as well as unplanned capital losses. Smith (2010) confirms these factors, as well as potential loss of expertise and knowledge, loss of business, and damaged employee and client relationships. Morris et al. (1997) find, among other factors, that the relationships between family members are important in identification of successors, suggesting that fairness may have a role in pinpointing a successor.
A business owner’s definition of fairness may be an important component of determining a successor. Depending on how a business owner evaluates and practices fairness within his or her business will likely have an impact on how the successor is selected. In this article, we consider the differences in perceptions of fairness across various groups of family business owners. We first consider the differences in fairness between those who have not identified a successor and those who have. Then, we consider the differences between male and female family business owners, followed by the differences between copreneurial and non-copreneurial couples.
We first consider which leadership types have identified a successor. We then, with considerations of these differences, compare male owners with female owners, as well as copreneurial couples and non-copreneurial couples. In this article we define a copreneurial family business as a couple working together day-to-day in the management of the firm.
To consider these different groups’ perceptions of fairness in business, we use the 2010 Intergenerational Farm and Non-Farm Family Business Survey. The 2010 Intergenerational Farm and Non-Farm Family Business Survey was a 30-minute telephone survey of rural family businesses. The data set is a sample of 2,097 small and medium sized farms from Illinois, Indiana, Michigan, and Ohio; plus a random sample of 1,059 small Indiana businesses. The final sample consisted of 3,156 cases. The majority of the survey considered farm businesses with the Farm sample having 653 observations and the Non-Farm 83 observations. Overall, the sample consists of 736 family businesses.
We use a section of the survey which asks the business owner to determine what the perceptions of fairness in the business are, from a list of five options. These five options are:
a. Treat each according to his/her own needs
b. Treat each according to his/her own contribution
c. Treat all individuals the same
d. The business has no definition
e. Don’t know
We use these five choices to analyze the differences in fairness between the various groups of business owners.
We first consider the differences between business owners who had identified a successor and business owners who had not identified a successor. In our sample, 521 business owners had not identified a successor and 204 business owners had identified a successor. In Table 1 we sub-categorize business owners who had and had not identified a successor, by gender, as well as copreneurial status. This table suggests that business owners who had a successor identified were largely male and were involved in a copreneurial relationship. These relationships are worth reflection as we explore fairness throughout this paper.
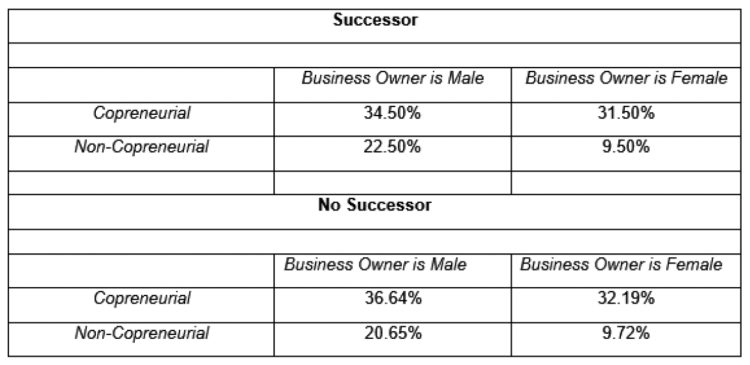
Table 1. Business Owner Types
There are some differences between leadership type and identification of a successor. These can be seen in Figure 1. Those who had identified a successor were more likely to treat each according to their needs and also more likely to treat all the same. Conversely, those who had not identified a successor were more likely to treat according to their contribution or to have no definition at all. For example, 23% of those without a successor treat each according to their contribution compared with 17.99% who had a successor. However, almost a quarter of each group have no definition of fairness; with 25.5% of those without a successor and 23.79% of those with a successor, having no definition of fairness.
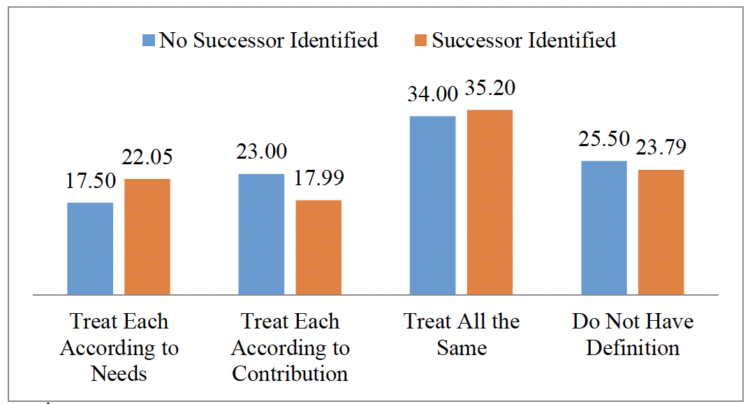
Figure 1: Differences in Fairness: No Successor Identified v. Successor Identified
Together, these results suggest that the differences in the definition of fairness between those who had not identified a successor and those who had are relatively small. If such definitions play a role in the decision of determining a business successor it is likely through percentage discrepancies between the statements of “treat according to needs” and “treat according to contribution”.
Next, we consider the differences between male and female business owners. In our sample, we have 423 male business owners and 292 female owners. Discrepancies exist between all determinations of fairness. This can be seen in Figure 2. Female business owners were far more likely to treat each according to their needs, with 29.45%, compared with 14.66% of male owners. Male owners are slightly more likely to use every other definition. Male owners treat each according to their contribution with 20.57%, compared with 17.12% of female business owners. Similarly, for those who treat all the same, 36.64% are male owners and 32.88% are female owners. Male owners are also more likely to have no definition, with 28.13%, compared with 20.54% of female owners.
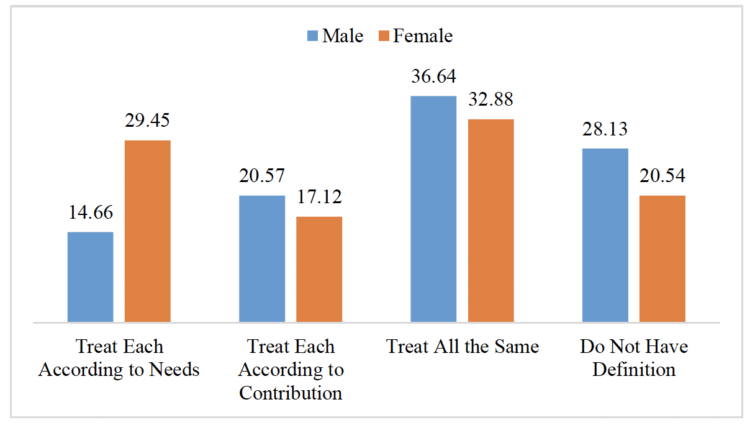
Figure 2: Differences in Fairness: Male v. Female Business Owners
Taken together, these results indicate that male and female business owners are quite different in their definitions of fairness in their business. It also indicates that gender may have a role in determining succession planning. Although this is suggested in Table 1, with fewer female business owners having a successor identified, compared with male business owners.
Finally, we consider the differences between copreneurial and non-copreneurial couples. In our sample, there are 211 non-copreneurial couples and 481 copreneurial couples. The differences are relatively small in all categories. This can be seen in Figure 3. Copreneurial couples were slightly more likely to treat each according to their own needs, with 21.41% compared with 19.43% of non-copreneurial couples. Additionally, copreneurial couples were more likely to treat all the same, with 35.14%, compared with 33.18% of non-copreneurial couples. Non-copreneurial couples were more likely to treat each according to their contribution, with 21.80%, compared with 17.88% of copreneurial couples. Both groups are almost exactly likely to have no definition.
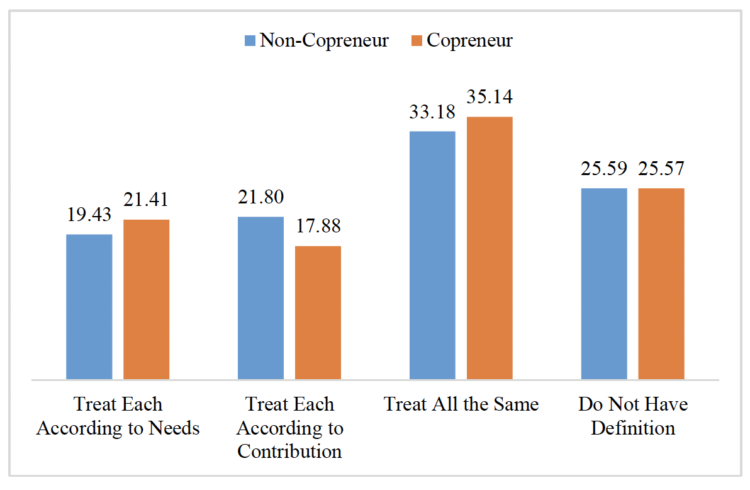
Figure 3: Differences in Fairness: Copreneurial Couples v. Non-Copreneurial Couples
Together, these results suggest that copreneurial couples and non-copreneurial couples may not be very different in determinations of fairness.
Summary
How do small business owners view fairness? For some situations there are minimal differences in definitions of fairness between two groups of family business owners, including: 1) those who had identified a successor and those who had not and 2) copreneurial couples and non-copreneurial couples. The differences between those who had identified a successor and those who had not, as well as copreneurial and non-copreneurial couples, are relatively minor.
However, the differences in views on fairness between male and female family business owners is much larger. Women are more likely to treat each according to needs, and men are more likely to treat each according to contribution. Interestingly, a similar trend among all groups is the approximate 25% that have no definition of fairness. This may cause longer term problems in the family business if the perception of how successors are treated is inconsistent because there is no set definition of fairness.
These results do not tell us everything that we might want to know about differences between these management groups, particularly in terms of management style, implementation of fairness, or ultimate outcomes. Future research into the implications of fairness on family business outcomes would be beneficial for determining its role in management of family firms.
References
Mishra, A.K., H.S. El-Osla, and J.D. Johnson, (2004). “Succession in Family Farm Business: Empirical Evidence from the U.S. Farm Sector”, Selected Paper Presentation at the AAEA Meeting in Denver, Colorado. August 1-4, 2004.
Mishra, A.K., and H.S. El-Osla, (2007). “Factors Affecting Succession Decisions in Family Farm Businesses: Evidence from a National Survey” Journal of the A.S.F.M.R.A. 2007: 1-10.
Morris, M.H., R.O. Williams, J.A. Allen, and R.A. Avila, (1997). “Correlates of Success in Family Business Transitions”, Journal of Business Venturing 12: 385 – 401.
Smith, S.M., (2010). “Legal Corner: Succession Planning for Family-Owned Businesses is
Critical for Rural America”, Rural Cooperatives, July / August 2010: pages 9 and 46.
![]()
![]()
![]()
![]()
![]()
