The Indiana Equine Industry
February 13, 2004
PAER-2004-3
Megan Garrett and Kevin T. McNamara
![]()
![]()
![]()
![]()
![]()
Indiana Equine Industry Structure
The Indiana equine industry (IEI) is comprised of 160,000 equine located on 34,000 operations around the state (2002 Indiana Equine Survey). Equine in Indiana serve a variety of needs and uses, including racing, showing, recreation, or work. Indiana equines are also used in breeding as either broodmares or stallions (Table 1).
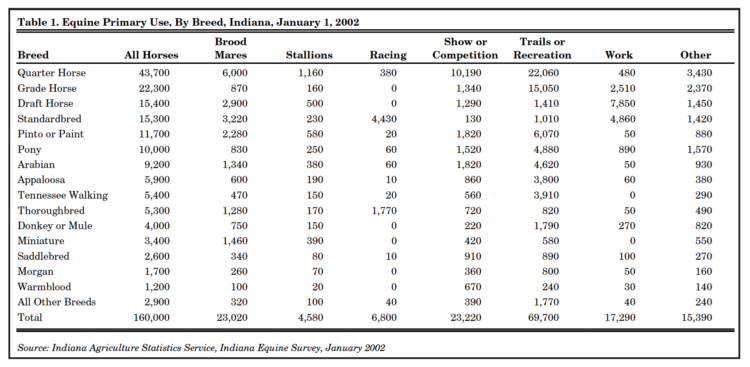
Table 1. Equine Primary Use, By Breed, Indiana, January 1, 2002
About 44 percent of the total Indiana equine population is used for trail or recreation activities. Horses classified as trail and recreation equines are generally used for pleasure riding. If an animal is kept for the intention of racing, whether in pari-mutuel or other racing events, its primary use is racing. Four percent of the Indiana equine population is used primarily for racing activities. A show or competition equine is one used primarily for showing, polo, eventing, and other equestrian sports other than racing. Nearly 15 percent of the Indiana horse population is used for showing or competition. Horses used for work, hauling, or transportation are classified as work equine. These horses generally perform agriculture related work tasks, such as hauling hay or pulling farm equipment for crop production. Work horses represent 11 percent of Indiana’s equine population. A broodmare is a female horse kept primarily for breeding. Broodmares account for 14 percent of the total Indiana equine population. Stallions are male horses kept primarily for breeding. Stallions account for 3 percent of the total Indiana equine population. All equine not classified as broodmares, stallions, show or competition, work, trail and recreation, or racing were classified as other. This category includes, but is not limited to, equine used for commercial carriage rides, police patrols, teaching, and retired horses. Nine percent of the Indiana equine population is classified by operators as equine for other uses (Figure 1).
Horses are bred and classified by breeds. Thirteen primary breed categories were identified by the Indiana Agriculture Statistics Service to classify the IEI. The breed categories are: Quarter Horse, Grade Horse, Draft Horse, Standardbred, Pinto or Paint, Pony, Arabian, Appaloosa, Thoroughbred, Donkey or Mule, Saddlebred, Morgan, and Warmblood (Figure 2).
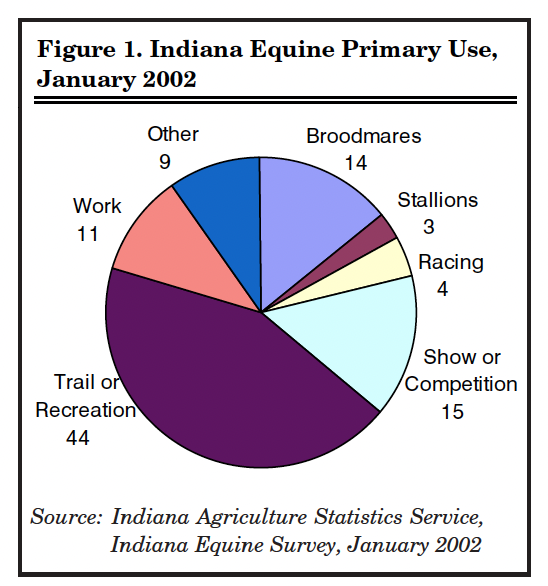
Figure 1. Indiana Equine Primary Use, January 2002
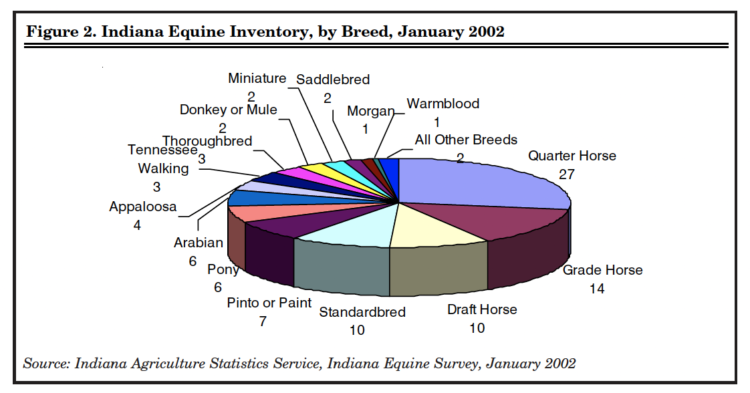
Figure 2. Indiana Equine Inventory, by Breed, January 2002
Equine Operations
A horse or equine operation is an establishment that has at least one resident horse. There are 34,000 equine operations in Indiana averaging 4.7 equine per operation. Operations are classified into four categories; Show or Competition, Work, Trail or Recreation and Other Use, and Racing (Table 2).
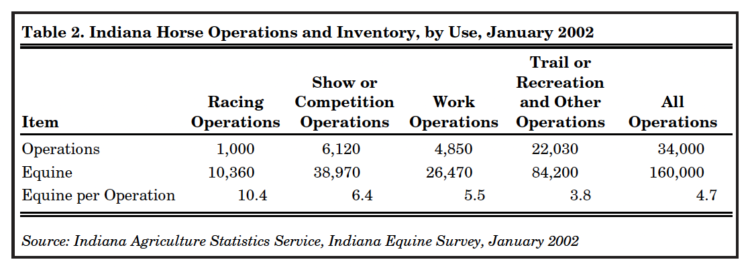
Table 2. Indiana Horse Operations and Inventory, by Use, January 2002
Trail or recreation operations are the most common type of equine operation in Indiana. Trail or recreation and other operations represent 65 percent of the 34,000 operations in Indiana (Figure 3). Fifty-three percent of the total Indiana equine population is on these operations (Figure 4).
A show or competition operation is one primarily used for showing, polo, eventing, or any of the non-racing equestrian sport competitions. Show or Competition operations represent 18 percent of the state’s equine operations (Figure 3). There are 6,120 show or competition operations in Indiana. Thirty-eight thousand, nine hundred seventy equine, 24 percent of the equine in Indiana, are located on show or competition operations (Figure 4).
Work operations have equine used for work, hauling, or transportation. There are 4,850 work operations in Indiana. Work operations account for 14 percent of the state’s operations (Figure 3). These work operations account for 26,470 equine. It is a common practice for work operations to also breed stock for sale into other equine sectors, such as racing. About 17 percent of total Indiana equines are located on work operations (Figure 4).
Racing operations keep horses primarily for the intention of racing, whether for pari-mutuel or other events. Of the Indiana horse farms, 1000, or 3 percent, are racing operations. Racing operations make up the smallest portion of operations, representing 3 percent of Indiana’s operations (Figure 3). These 1,000 racing operations have 10,360 horses, 6 percent of the Indiana equine population (Figure 4).
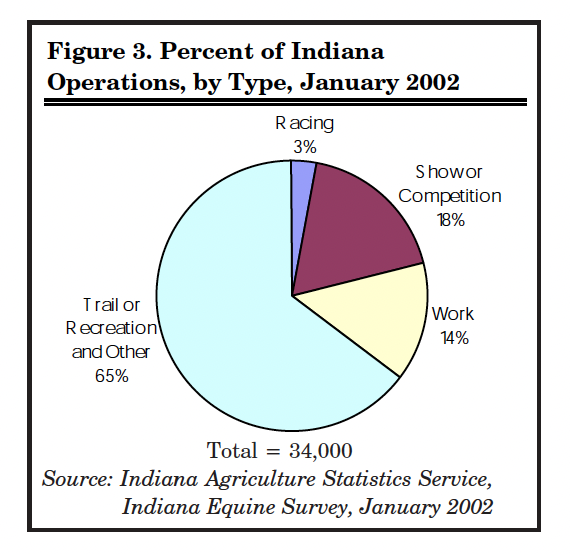
Figure 3. Percent of Indiana Operations, by Type, January 2002
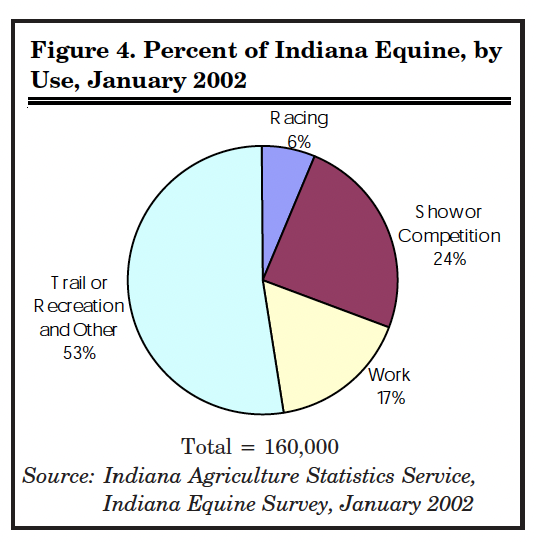
Figure 4. Percent of Indiana Equine, by Use, January 2002
Equine Industry Spending
The Indiana equine industry purchases a variety of goods and services in the Indiana economy. These purchases stimulate economic activities throughout Indiana. Total general expenditures for Indiana equine operations were $282,929,000 in 2001 (Table 3). Over 93 percent of general expenses were incurred within Indiana. Boarding and Training Fees were the largest general expense. The second largest general expense was hay. Ninety-six percent of hay expenses were incurred by operations with resident equine (Figure 5).
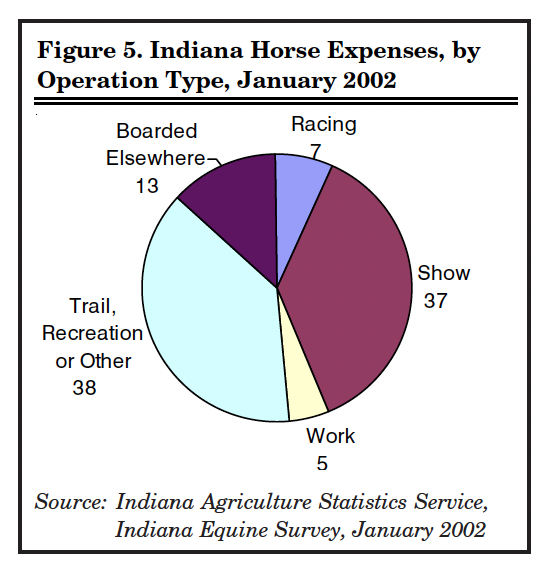
Figure 5. Indiana Horse Expenses, by Operation Type, January 2002
Total capital expenses came to $265,652,000 in 2001 (Table 3). Capital expenses included purchase of equine, equine land purchases, and equine buildings and equipment purchases. Most capital expenses, 62 percent, were equine building and equipment related. Operations with resident equine incurred 90 percent of the total capital expenses. Indiana equine operations reported total expenses in excess of $548 million in 2001.
Indiana Equine Industry Economic Impacts on the Indiana State Economy
Equine operations breed, train, recreational ride, raise, and race horses, all activities which result in economic activity. Equine operations pay fees, employ labor, and purchase feed, veterinarian services, and other goods and services to support their enterprises. This initial, or direct, economic activity stimulates spending in the economy as equine industry suppliers make purchases to support their businesses. Additionally, households that earn income from horse operations or their suppliers spend money in the economy creating impacts.
Indiana Equine Spending by Operation Type
Purchases made by owners, breeders, and trainers to support horse racing, show or competition, work, or trail or recreation and other operations make up the direct economic impact of the equine industry on the state’s economy. Total expenditures (Table 4) on equine operations (excluding labor) by operation type were surveyed to be $28,719,000 for racing; $135,293,000 for show or competition; $18,618,000 for work; and $158,063,000 for trail or recreation and other. The total expenditures for all operations with resident equine were $475,804,000 (Table 3).
Labor payments make up nearly 5 percent of the horse industry’s total expenditures. Total reported labor payments (Table 4) were $3,128,000 for racing; $10,097,000 for show or competition; $1,551,000 for work; and$7,301,000 for trail or recreation and other operations. Total labor payments by equine operations in 2001 were $22,077,000.
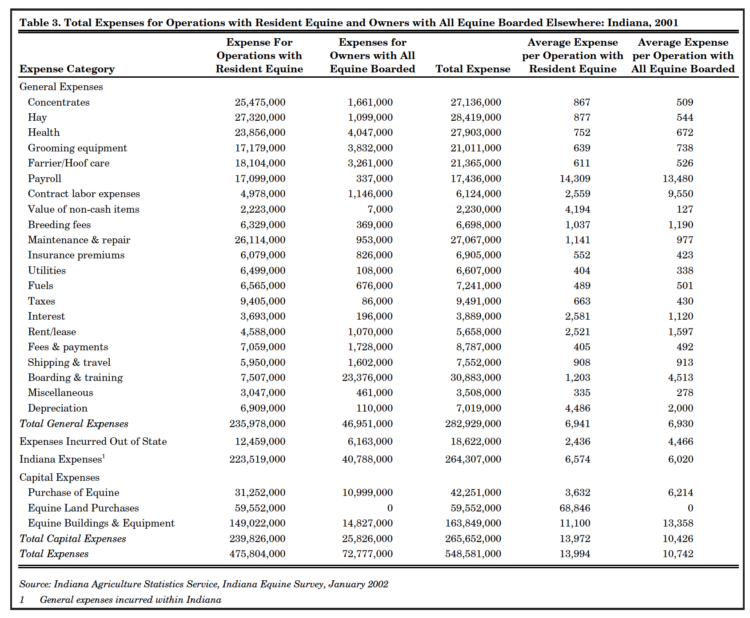
Table 3. Total Expenses for Operations with Resident Equine and Owners with All Equine Boarded Elsewhere: Indiana, 2001
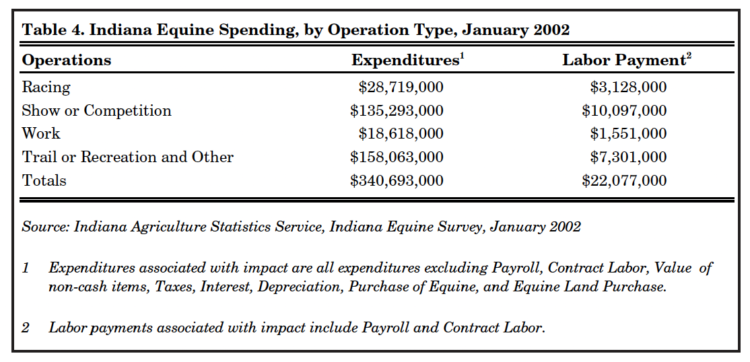
Table 4. Indiana Equine Spending, by Operation Type, January 2002
Equine Operation Income and Employment Impacts, Spending and Labor
The horse operation spending, the direct impact, stimulates additional spending in the economy as suppliers make purchases to supply horse operations, and retail and consumer service firms make purchases to service household spending income earned from equine operations. The direct impacts and the additional spending combined are the total impacts. Total income, and employment impacts associated with all equine operations in Indiana are estimated to be $197 million in total income and 8,861 jobs. These amounts represent the spending by the horse industry (direct impacts) plus the indirect and induced impacts. The annual salary earned per industry associated with these impacts is seen in Table 5.
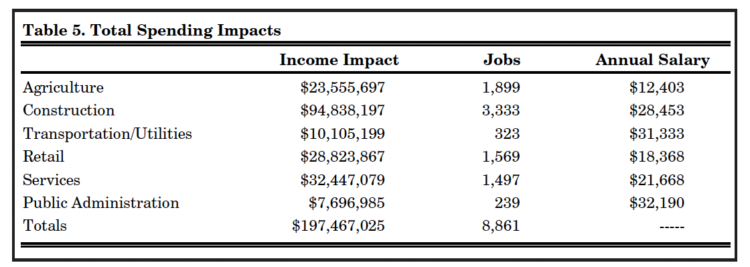
Table 5. Total Spending Impacts
Indiana equine operations have an estimated annual payroll of $22,077,000. Households earning this money use it to purchase household goods and services. Household spending of income earned in the horse industry stimulates a total impact of $9,763,021 in personal income and 361 jobs (Table 6).
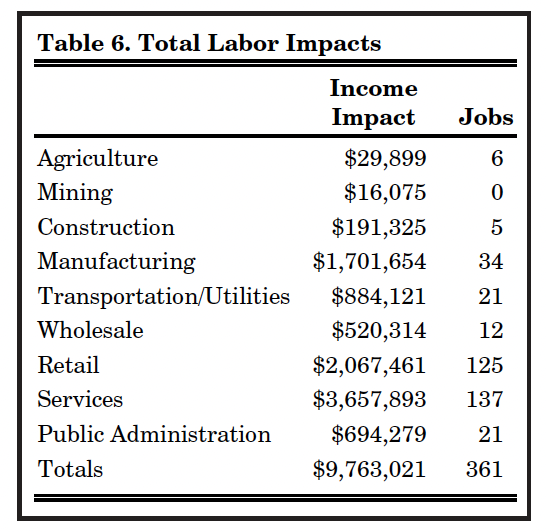
Table 6. Total Labor Impacts
Adding the impacts associated with the horse operation spending and the impacts associated with household spending of income earned from horse operations, the estimated annual impacts associated with the equine industry are $207,230,046 in total income and 9,221 jobs (Table 7).
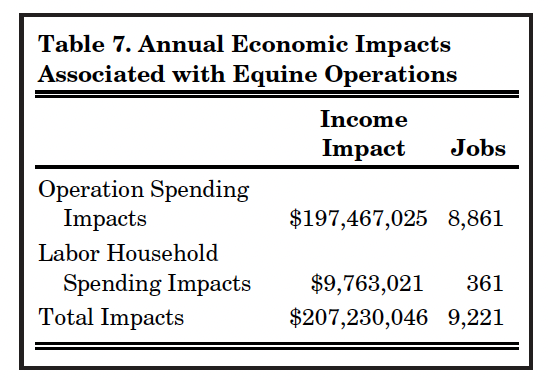
Table 7. Annual Economic Impacts Associated with Equine Operations
Conclusion
The Indiana equine industry is an important component of Indiana’s agriculture. The equine industry is a diverse agriculture sector that benefits the state’s economy through direct spending and job creation throughout Indiana.
![]()
![]()
![]()
![]()
![]()
