The Profitability of Transitioning to Organic Grain Crops in Indiana
February 20, 2010
PAER-2010-02
Samuel Clark, Graduate Student and Corinne Alexander, Associate Professor
![]()
![]()
![]()
![]()
![]()
Organic agriculture is a rapidly growing industry fueled by growing consumer demand. In 2006, breads and grains made up 9% of organic consumer food sales (Organic Trade Association 2007). The demand for organic fi eld grains is growing with the sales of breads and grains rising 19% from 2005 to 2006. The organic meat sector has seen the most growth in demand—55% in 2006. This growth in the meat sector translates into increased demand for organic feed grains by organic livestock producers. Thus, growth opportunities exist in the organic grains sector, and Indiana farmers have the potential to exploit these opportunities. Significant room for organic acreage expansion is present, as certified organic cropland and pasture amounted to only 5,156 acres statewide for 2005 (ERS 2005).
To take advantage of these opportunities, current organic farmers may expand, or new organic farmers may enter the market. Either way, producers will make business decisions. The basic tool for making crop business decisions is the crop budget. Conventional crop budgets are widely used and accessible to farmers in Indiana. Yet, organic crop budgets are not as common or accessible. Currently, there are no organic crop budgets specific to Indiana, and the limited numbers of existing organic budgets elsewhere are not regularly updated with current costs and prices.
Similar Organic/Conventional Studies
Previous studies have illustrated that organic farms can be profitable when compared to conventional farms (Chavas, Posner, & Hedtcke 2009; Mahoney et al. 2004). Research shows that the organic yield penalties associated with transitioning to organic production can be overcome in regards to profitability due to the lower direct costs that organic farms incur as compared with conventional farms (Delate and Cambardella 2004; Klepper, et al., 1977). In addition, research indicates that organic price premiums are very helpful and in some cases necessary for organic field crops to be more profitable than conventional crops. That said, none of these studies have been conducted in Indiana. However, this preliminary study modifies existing organic and conventional crop budgets in an attempt to apply them to typical Indiana farm operations. This will provide Indiana producers with more information regarding their production options, organic transition profitability, and optimal transition rotations.
Methods
The primary goal is to compare continued conventional production to an investment in transitioning to organic production using a net present value (NPV) analysis to compare each alternative. The NPV analysis takes cash inflows, outflows, and opportunity costs into account in order to determine a net return to land, labor, and management per acre for the entire analysis period. For each alternative, the analysis period is six years: 2009-2014, and we use a discount rate of 9.05% calculated as the weighted average cost of capital using metrics from the University of Minnesota FINBIN Farm Financial Database over the years 2003-2007.
The organic and conventional crop budgets utilized in the analysis are modified from existing crop budgets to be more representative of an Indiana farmer’s crop selection. The conventional production system (CPS) uses a two-year Corn-Soybeans rotation, while the organic production system (OPS) uses a Corn-Soybeans-Wheat/Alfalfa-Alfalfa four-year rotation. The National Organic Program (NOP) standards require a minimum rotation of three years, where each year a different crop is planted. In addition, the NOP requires that the land in transition to organic certification is managed under the NOP standards for three years before the crops can be sold as certified organic and be eligible for the premiums.
Organic Prices and Premiums
One of the main factors influencing the profitability of transitioning to organic production is the existence of organic price premiums. For corn, soybeans, and wheat, implied organic premiums were calculated using monthly data from the National Agriculture Statistics Service (2009) and the Agricultural Marketing Service (2009). Historically, organic corn premiums ranged from 81%-238% with an average of about 142%. Organic soybean premiums were from 65%-139% and averaged about 107%. Organic wheat premiums ranged from 14%-74% and averaged just over 47%. Alfalfa hay premiums were calculated using historical hay prices (USDA: NASS 2009) and assuming a 0%-20% premium based on industry and current producer recommendations (Anderson 2007; Reding, pers. comm.).
To capture the variation exhibited in the implied organic premium, we examine the impact on revenues of a premium at the low end, the average, and the high end of the observed premiums. Under each of the three scenarios, we apply the implied organic premiums to projected conventional cash crop prices to obtain future organic cash prices. The projected conventional cash prices are based on grain futures prices less an assumed basis. The organic and the respective conventional prices (Chicago Board of Trade 2009) are shown in Table 1.
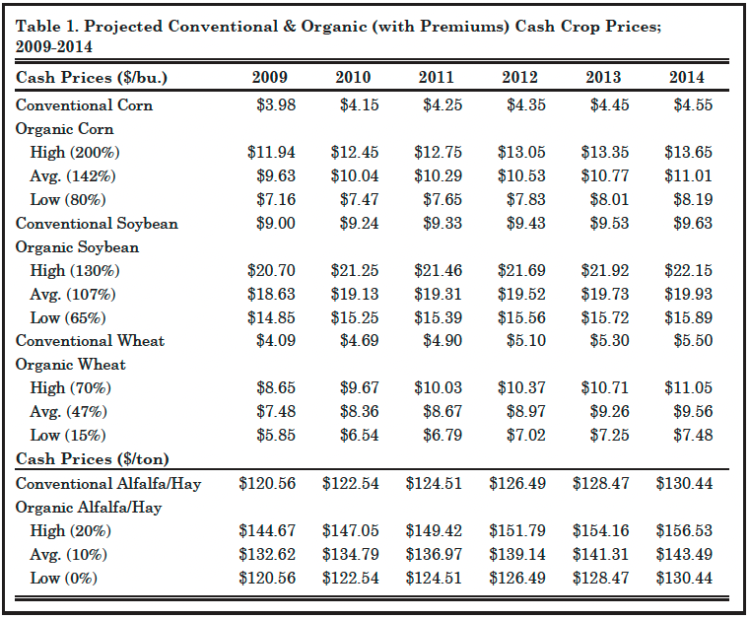
Table 1. Projected Conventional & Organic (with Premiums) Cash Crop Prices; 2009-2014
Organic Yield Penalties
Crop yields also affect profitability during transition. To predict yields for the organic system, we examine seven studies comparing organic and conventional yields. Without commercial chemicals and fertilizers, the OPS may experience increased weed populations and lower crop yields (Delate and Cambardella 2004). Thus, we project organic crop yields using an assumed organic yield penalty relative to conventional crop yields (Table 2).
After the initial transitional yield penalties, yields should return to the level of conventional yields due to the accumulation of organic soil matter (MacRae et al. 1990). However, the yield penalties could continue for as long as six years (Dabbert and Madden 1986). To be conservative, we assume the yield penalties continue for all six years. Conventional crop yields are projected using estimations calculated from historical Indiana yields collected by the USDA (2009). Table 3 shows the projected organic yields with their respective penalties and the projected conventional yields.

Table 2. Yield Penalties from Selected Organic Transition Studies
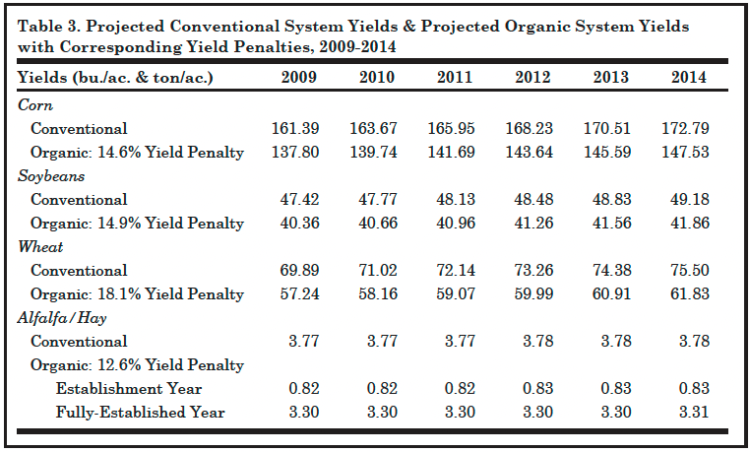
Table 3. Projected Conventional System Yields & Projected Organic System Yields with Corresponding Yield Penalties, 2009-2014
Crop Budgets
The Purdue crop budgets (Miller et al. 2009; Dobbins et al. 2007), with minor modifications to normalize fertilizer costs, are good representations of Indiana conventional crop budgets. Iowa State (Chase, Delate, and Smith 2008) and N.C. State (Bullen 2007) organic crop budgets were modified (added costs for fertilizer, cover crops, and seeding alfalfa) and combined to form representative Indiana organic crop budgets. After modifying the budgets to establish current crop budgets, we need to project budgets and input costs for the subsequent years. To do so, we increase the current input costs by an average yearly percentage change to capture inflation and the changing market for crop inputs. Not all crop inputs change by the same amount; therefore, we estimate the average percentage price increase for each input using the prices paid index from 2000-2006 (USDA: NASS 2009). Table 4 shows each crop input, which index we applied to it, and the average percentage change of that index.
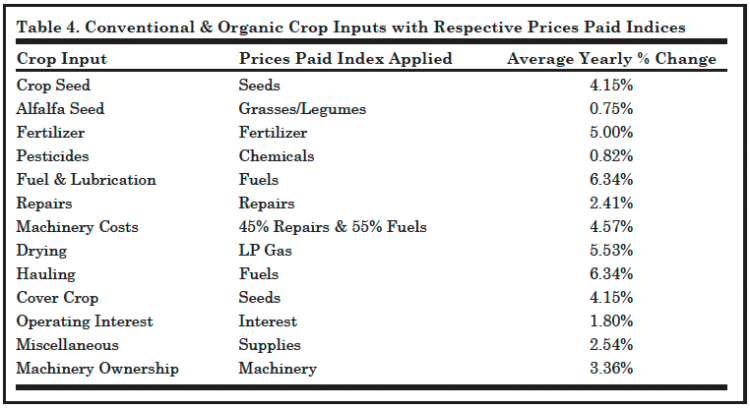
Table 4. Conventional & Organic Crop Inputs with Respective Prices Paid Indices
Combining these current and projected input costs with projected crop prices and yields results in projected crop budgets over the six-year analysis for both the CPS and OPS. Overall, there are five scenarios between the two production systems. Scenario A and B represent the two possible rotation combinations in the CPS and their respective costs and returns. Scenario A begins with corn, while B begins with soybeans. Table 5 represents the budget for Scenario A and illustrates an example of a complete crop budget and returns for the CPS.
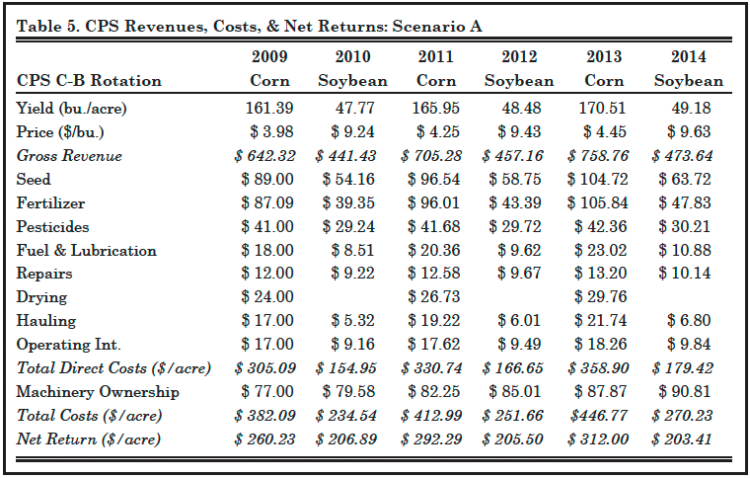
Table 5. CPS Revenues, Costs, & Net Returns: Scenario A
Scenarios C, D, and E represent the three possible rotation combinations in the OPS. Scenario C begins with corn, Scenario D with soybeans, and Scenario E with the wheat/alfalfa crop. Table 6 shows the costs for Scenario C and illustrates an example of cost portions of the budgets under analysis in the OPS. There are four organic premium cases for each scenario. The low alfalfa price premium is the same as no price premium case. In addition, prices are always at the zero premium level for 2009-2011, since the NOP standards require a 36-month transition period. Thus, we assume the 2012 crop is the first certified organic crop eligible for organic price premiums. Table 7 demonstrates the yields, prices and premiums, revenues, and net returns for Scenario C. This also is an example of how these measures were computed for Scenarios D and E in the OPS.
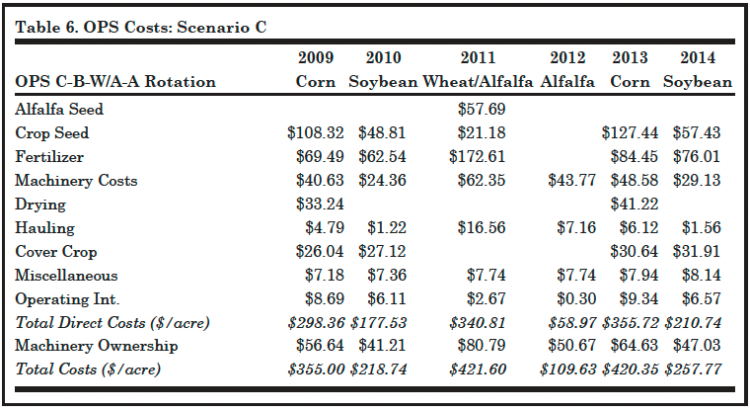
Table 6. OPS Costs: Scenario C
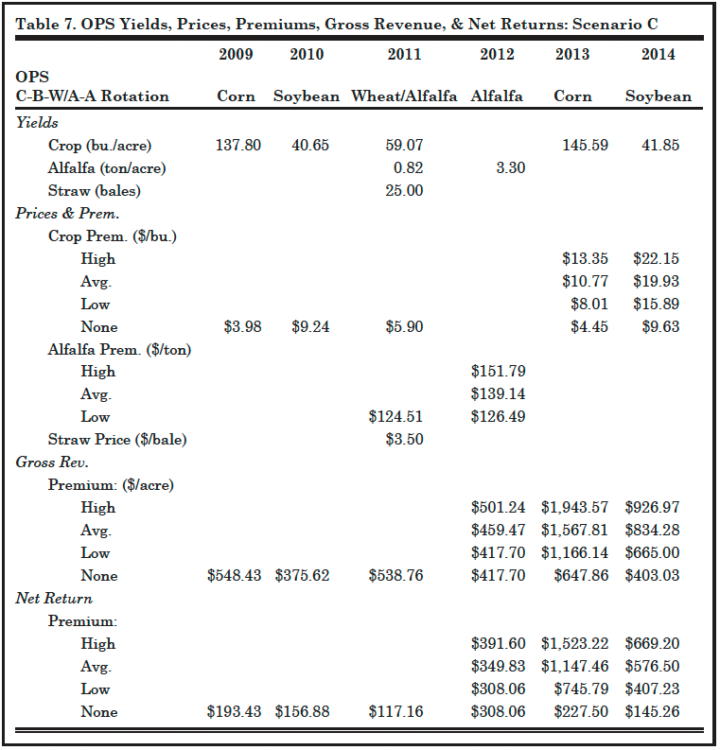
Table 7. OPS Yields, Prices, Premiums, Gross Revenue, & Net Returns: Scenario C
Results
After computing all of the net returns per acre each year for each scenario, we calculate a final NPV for each scenario under each of the three price premium cases. Computing the NPV allows you to compare the profitability of all five of the scenarios. Table 8 shows the computed NPV for each scenario under the different price premiums.
Scenario D has the highest NPV in the positive premium cases. In this rotation, the higher-value corn and soybean crops are the first to receive organic premiums. In Scenario E, there is no certified organic corn crop and there are two years each of the organic wheat/alfalfa and established alfalfa crops, which do not receive as high an organic percentage premium as organic corn and soybeans. However, scenario E has the highest NPV in the zero premium case when compared to Scenarios C and D.
The organic corn and soybeans consistently have lower organic total costs when compared with the conventional corn and soybeans. On average, total expense for corn is $26.70 lower, while soybeans are $14.48 lower. Although the organic system has slightly lower costs, the yield penalties associated with organic production reduce the overall net return. A comparison of average net returns excluding any premiums shows that the conventional corn and soybeans are more profitable than the organic corn and soybeans. Conventional corn has revenue about $77.01 higher per acre on average, while conventional soybeans are about $53.05 higher per acre on average.
Once price premiums are introduced, organic corn and soybeans generate higher net returns than conventional corn and soybeans. An explanation for the significantly higher returns in the OPS compared with the CPS is that the net returns do not explicitly reflect labor costs, as they are returns to land, labor, and management. Organic production tends to be more labor intensive and may require additional managerial time. Without chemical herbicides, labor-intensive, mechanical weed control is much more prevalent.
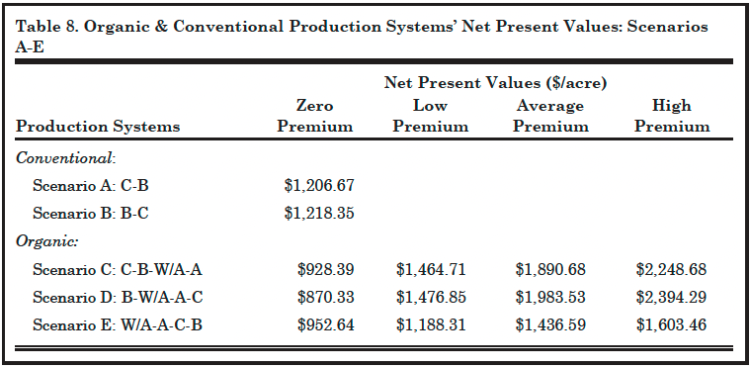
Table 8. Organic & Conventional Production Systems’ Net Present Values: Scenarios A-E
There can also be a learning curve associated with organic production, and there is additional work for organic certification. According to Lang (2005), labor costs average about 15% higher in organic systems. Also, Hanson, Lichtenberg, and Peters found that hired and family labor costs together averaged about 26.6% higher in OPSs (1997). If these additional labor costs were included, organic corn and soybeans would have similar to higher total costs compared with conventional corn and soybeans. The lower returns to organic production without premiums and the additional labor costs suggest that some price premium is necessary for farmers to grow organic crops.
The price premiums received during the last three years of organic production compensate for the reduced organic yields. If there are no opportunities for organic price premiums, the conventional Scenario B has the highest NPV. With opportunities for organic price premiums, Scenario D has the highest NPV in all three premium levels.
Concluding Points
Premiums Provide Profitability
This analysis provides evidence that organic crops with yield penalties can be profitable and competitive with conventional crops. The lower organic production costs coupled with adequate organic price premiums make organic production competitive and profitable. These findings regarding lower organic costs and profitability with premiums are consistent with previous organic/conventional comparison studies.
Rotational Transition Strategies
In addition, this analysis provides strong evidence that it is important to plan the transition to certified organic production so that corn and soybeans, which receive the highest premiums, are the first crops to receive organic premiums. Scenario D, in which corn and soybeans are the first and second crops in the organic system, has the highest profitability followed by Scenario C where corn and soybeans are the second and third organic crops. Scenario E where wheat/alfalfa and alfalfa are the second and third crops to receive organic premiums clearly has the lowest profits.
Subsequent Work & the Future
Besides the two take-home points previously mentioned, certain aspects of the study might warrant further research. In regards to profitability, fertilizer costs, both commercial and manure, are a large, and variable, part of the total cost in grain production. Labor expenses are another cost that can be quite variable and have a significant effect on net returns. Further investigation involving these costs and their specific effect on both conventional and organic transitional profits would be beneficial. Likewise, future research should investigate both long-term organic/conventional profitability, as this research only examines transitional profitability.
References
Anderson, L. 2007. “Organic Hay Demand Grows, Conference Speaker Says.” Retrieved February 10, 2009, Hay & Forage Grower: http://hayandforage.com/news/ conference-organic-hay-demand/
Archer, D.W., and H. Kludze. 2006. “Transition to Organic Cropping Systems Under Risk.” Paper presented at the AAEA annual meeting, Long Beach, CA, 23-26 July.
Bullen, G. 2007. “Organic Grain Crop Budgets”. Retrieved March 7, 2009, North Carolina State University: http://www.organicgrains. ncsu.edu/production/cropbudgets.htm
Center for Farm Financial Management, University of Minnesota. 2008. “Whole Farm Financial Summary: All States, Crop Farms, 2003-2007.” Retrieved March 4, 2009, FINBIN Farm Financial Database: http://www. fi nbin.umn.edu/output/136982.htm
Center for Farm Financial Management, University of Minnesota. 2008. “Whole Farm Summary Income Statement: All States, Crop Farms, 2003-2007.” Retrieved March 4, 2009, FINBIN Farm Financial Database http://www.finbin.umn.edu/output/136982.htm
Chase, C., K. Delate, and M. Smith. 2008. “Organic Crop Production Enterprise Budgets.” File A1-18, Iowa State University.
Chavas, J.P., J.L. Posner, and J.L. Hedtcke. 2009. “Organic and Conventional Production Systems in the Wisconsin Integrated Cropping Systems Ttrial: II. Economic and Risk Analysis 1993–2006.” Agronomy Journal 101 (2):288-295.
Chicago Board of Trade. 2009. “CBOT-Agricultural.” Retrieved January 27, 2009, Chicago Board of Trade: http://www.cbot.com/cbot/ pub/page/0,3181,963,00.html
Creamer, N., M. Barbercheck, M. Bell, C. Brownie, A. Collins, K. Fager, J. Gruver, H. Shuijin, L. Jackson, N. Kuminoff, M. Linker, F. Louws, D. Monks, P. Mueller, D. Orr, J. Seem, C. Tu, A. Wossink, S. Koenning, and M. Wagger. 2005. “Organic Transitions Experiment Weed & Yield Data.” Retrieved March 10, 2009, OFRF Networks-The Organic Agriculture Consortium: http: //ofrf.org/networks/oac_abstracts/ 11_organic_creamer.pdf
Dabbert, S., and P. Madden. 1986. “The Transition to Organic Agriculture: A Multi-Year Model of a Pennsylvania Farm.” American Journal of Alternative Agriculture 1(3):99-107.
Delate, K., and C. Cambardella. 2004. “Agroeconsystem Performance during Transition to Certified Organic Grain Production.” Agronomy Journal 96:1288-1298.
Dobbins, C.L., W.A. Miller, T.J. Vyn, and S.P. Conley. 2007. “2007 Purdue Crop Cost & Return Guide.” Dept. Ag. Econ. ID-166-W, Purdue University.
Hanson, J.C., E. Lichtenberg, and S.E. Peters. 1997. “Organic Versus Conventional Grain Production in the Mid-Atlantic: An Economic and Farming System Overview. American Journal of Alternative Agriculture 12(1):2-9.
Klepper, R., W. Lockeretz, B. Commoner, M. Gertler, S. Fast, D. O’Leary, and R. Blobaum. 1977. “Economic Performance and Energy Intensiveness on Organic and Conventional Farms in the Corn Belt: A Preliminary Comparison”. American Journal Agricultural Economics 59:1-12.
Lang, S.S. 2005. “Organic Farming Produces Same Corn and Soybean Yields as Conventional Farms, but Consumes Less Energy and No Pesticides, Study Finds.” Retrieved April 14, 2009, Cornell University News Service: http://www.news.cornell.edu/stories/ July05/organic.farm.vs.other.ssl.html
MacRae, R.J., S.B. Hill, G.R. Mehuys, and J. Henning. 1990. “Farm-Scale Agronomic and Economic Conversion from Conventional to Sustainable Agriculture.” Advances in Agronomy 43:155-198.
Mahoney, P.R., K.D. Olson, P.M. Porter, D.R. Huggins, C.A. Perillo, and R.K. Crookston. 2004. “Profitability of Organic Cropping Systems in Southwestern Minnesota.” Renewable Agriculture and Food Systems 19:35-46.
McBride, W.D., and C. Greene. 2008. “The Profitability of Organic Soybean Production.” Paper presented at the AAEA annual meeting Orlando, FL, 27-29 July.
Miller, W.A., C.L. Dobbins, B. Erickson, B. Nielsen, T.J. Vyn, and B. Johnson. 2009. “2009 Purdue Crop Cost & Return Guide.” Dept. Ag. Econ. ID-166-W, Purdue University.
Organic Trade Association. (2007). “Organic Trade Association’s 2007 Manufacturer Survey Executive Summary.” Retrieved April 23, 2009, http://www.ota.com/pics/ documents/2007ExecutiveSummary.pdf
Porter, P.M., D.R. Huggins, C.A. Perillo, S.R. Quiring, and R.K. Crookston.2003. “Organic and Other Management Strategies with Two- and Four-Year Crop Rotations in Minnesota.” Agronomy Journal 95(2):233-244.
Reding, G. 2009. Personal Communication. U.S. Department of Agriculture: Agricultural Marketing Service (AMS). 2009. “Eastern Cornbelt Organic Grain & Feedstuffs Report.” Retrieved January 2009, Livestock & Grain Market News: http://www.ams. usda.gov/mnreports/gx_gr120.txt
U.S. Department of Agriculture: Economic Research Service (ERS). 2005. Organic Production Data Sets. Retrieved April 23, 2009, http://www.ers.usda.gov/Data/organic/ index.htm#tables U.S. Department of Agriculture: National Agriculture Statistics Service (NASS). 2009. Crops & Plants-Field Crops: Hay Alfalfa (Dry).
U.S. Department of Aariculture: National Agriculture Statistics Service (NASS). 2009.
U.S. & All States Data-Crops: Planted, Harvested, Yield, Production, Price (MYA), Value of Production. U.S. Department of Agriculture: National Agriculture Statistics Service (NASS). 2009. U.S. & All States Data-Prices: Annual Average Index Numbers of Prices Paid
U.S. Department of Agriculture: National Agriculture Statistics Service (NASS). 2009. U.S. Price History. Retrieved January 15, 2009, University of Illinois Farmdoc: http://www. farmdoc.uiuc.edu/manage/uspricehistory/ us_price_history.htm
![]()
![]()
![]()
![]()
![]()
