The Role of Grain Markets in the Boom-Moderation Cycle
June 15, 2018
PAER-2018-09
Author: Chris Hurt, Professor of Agricultural Economics
![]()
![]()
![]()
![]()
![]()
An early lesson in economics is that commodity markets, and the prices they help generate, send signals to producers of how much to produce, what to produce, and when to produce. A good illustration are the signals sent to the world’s grain producers during the recent boom-moderation cycle that all farmers are familiar with.
The boom period began with the 2006 crop as grain prices began to rise. This was the 2006/07 marketing year. The moderation period began with the 2014/15 marketing year with prices falling sharply and were generally below total costs of production for many.
During the boom phase, grain prices and revenues rose quickly. Costs were also rising but at a slower rate. Rapid rising revenues and slower rising costs meant that profit margins were extremely favorable.
During the moderation phase starting with the 2014/15 marketing year, grain prices and revenues fell quickly. Costs on the other hand were slow to decrease, but did eventually move lower. In the moderation phase rapidly falling grain prices and slower falling costs meant large losses.
Acreage Response: How Much to Produce
Market economics suggest that strong profitability during a boom phase should cause a “supply response” among producers. High profitability encouraged grain farmers around the world to increase production. There are two primary ways to increase production. The first is to intensify production by applying more technology on existing acres to increase yields per acre. The second is extensive, and that is to simply bring more acres into production. The focus of this article is on the global acreage increase due to high prices and profitability.
To do this we looked at the number of acres harvest- ed globally for 13 major crops that include the major grains, oilseeds, and cotton. The data is available from USDA: Foreign Agricultural Service in a data-base called “Production, Supply, and Distribution” (PS&D). The data base is updated monthly and the data for May 2018 was used for this article.
The base year was the 2005/2006 marketing year. This was the year immediately preceding the start of the crop price boom in 2006/2007. The final year in the analysis is 2018/19 which are USDA’s estimates for the U.S. crops that will be harvested in 2018 and marketed into 2019.
How much did world harvested acreage expand? From the 2005/06 base marketing year to the esti- mates for the 2018/19 marketing year, world harvested acreage for these 13 major crops expanded by 194 million acres. For perspective, 194 million new harvested acres in the world is roughly equal to all of the U.S. acres harvested for corn, soybeans, and wheat-our three biggest acreage crops. World harvested acreage expanded by 8%.
How much of this expansion came during the boom phase from 2006/07 to 2014/15? Much like economics would suggest, 91% or 177 million of the 194 million came during the boom phase. The negative returns in crop production in the moderation phase after 2014/15 dramatically slowed and then virtually stopped growth as global acreage leveled off.
It is logical to ask the question of why crop production losses in recent years of the moderation phase did not cause world acre- age to decrease. Another economic principle called “irreversible supply” helps explain this. This simply means that once crop land is brought into production, it requires extremely low prices and enormous losses to move that land out of cultivation. You can think of this in regard to clearing forest land in South America for soybean production. Once the land is cleared and put into soybean production it rarely would go back to forestation.
What is the irreversible supply? A period of high prices brings about an increase in new acres, but a corresponding period of low prices does not drive that same land out of production.
Where Were the New Acres?
You may be thinking there were no new acres moving into production in your neighborhood, so where did these new acres come from? The globe is a large place and there were plenty of opportunities for land investors and farmers to expand acreage by 194 million acres as shown in Figure 1.
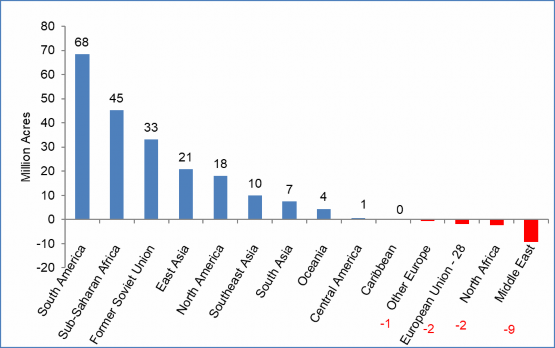
Figure 1: Change in Area Harvested for 13 major World crops 2018/19 vs. 2005/06 (Million Acres): Total = +194 million acres
It is no surprise that South America was the region most able to respond to the markets call for more acreage with 68 million new acres from 2005/06 to 2018/19. On the other hand, most are startled to see the area with the second largest acreage expansion was in Africa south of the Sahara Desert (45 million new harvested acres). Africa has large areas of land that have not been developed for crop production. Lack of infrastructure, tribal disagreements, and governmental issues can make development difficult. But strong financial incentives from high world crop prices and investment capital from the Middle East and China were the drivers. Much like South America, Africa will have continued opportunities to expand acreage if financial incentives are ever strong enough again.
Countries in the Former Soviet Union were the third largest area of new acres. Collective farms were the structural model of Soviet agriculture. After the breakup of the Soviet Union in the early 1990s global crop returns were generally low in the 1990’s and early 2000’s. The boom period starting in 2006/07 increased those returns and provided financial incentives to more rapidly reorganize the collective farms and to get productive land into cultivation.
East Asia was the fourth largest area bringing 21 million new acres into production. East Asia is dominated by China and China is dedicated to feeding their people. China has continued to increase agricultural output. They have done that with land reform, increased intensity of production, and by adding more acreage.
Finally, we get to North America as the 5th largest area of land expansion at 18 million acres. Remember that North America includes Canada and Mexico as well as the U.S. The primary contributor to added acres in North America came from the U.S. in the form of reductions in Conservation Reserve Program acres (CRP). Congress reduced the size of the CRP which had reached over 36 million acres in 2006 and 2007 to a maximum of 24 million acres in the 2014 Farm Bill.
From 2007 to 2018, CRP acreage was down over 13 million acres. Land owners taking land out of CRP were not required to put the land back into crop prduction. But, given the strong returns of the boom period, much of the former CRP land did find its way back into production. In the Dakota’s as an example, harvested acres of corn, soybeans, and wheat rose by 4.5 million acres from 2005 to 2017.
Markets Tell Global Farmers: What to Produce
Markets not only told global producers how much to produce but what crops to produce. Figure 2 breaks out the 194 million acre global acreage increase from 2005/06 to 2018/19 by which crops had increasing acreage and which crops had declining acreage. There were two main drivers of the boom period. The first was the global biofuels expansion and the second was the rapid growth of Chinese incomes that drove rapid increases in soybean usage.
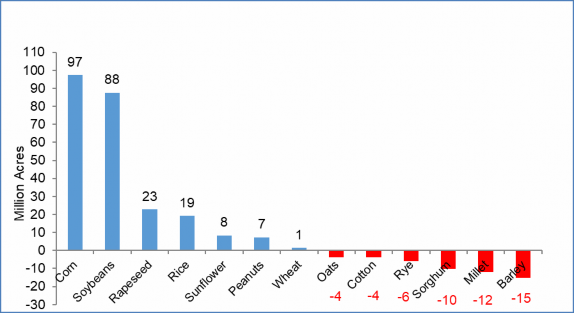
Figure 2: Change in World Harvested Area 2018/19 vs. 2005/06 (Million Acres)
The biofuels expansion made large new demands for corn and vegetable oils. In the U.S. that meant the need for more corn and soybean acres, In Europe, their biofuels program was primarily based on the expansion of rapeseed to make biodiesel.
Global corn acreage increased by 97 million acres during this period, with soybean acres increasing by 88 million. Rapeseed acres increased by 23 million, the third largest of any crop.
You can also see from Figure 2 that the high de- mand growth crops not only encouraged 194 mil- lion new acres of these 13 crops, but that markets provided incentives to substitute higher return crops for lower return crops. Declining acreage over this time period included: oats, cotton, rye, sorghum, millet, and barley.
Summary
Commodity markets are powerful forces. One of the primary functions of the commodity market is to discover prices. Prices then direct global producers in what to produce, when to produce, and how to produce.
The recent boom-moderation cycle was used as an example. During the boom phase, crop prices gave global farmers and land investors the signal to expand production. This article described how global producers expanded harvested acreage in response to higher prices and strong profitability during the boom phase. From the 2005/06 marketing year to 2014/15 the grain boom stimulated new world harvested acreage of the 13 major crops examined in this analysis. The moderation phase after 2014/15 caused a rapid slowdown in new acreage expansion and then a leveling off. Total global acreage expansion from 2005/06 to the 2018/19 marketing year was 194 million acres in the 13 major crops examined. Of the total expansion in acres, 91% occurred during the boom phase.
During the moderation phase starting in 2014/15 and continuing to today, crop prices and crop returns have been weak, yet acreage growth leveled off, but did not decline. In economics this is known as the irreversible supply curve-a situation where a period of rising prices draws more land into production, but a subsequent period of lower prices does not move that same land out of production.
Markets also told global farmers what to produce. The two huge demand surges that created the boom were global biofuels policies and growth of Chinese incomes. Biofuels policies were huge stimulants to corn production and rapeseed production in Europe (biodiesel), while the growth of Chinese incomes accelerated Chinese soybean imports. The vast majority of the global acreage growth was in corn, soybeans, and rapeseed.
References
Abbott, Philip C. & Hurt, Christopher & Tyner, Wal- lace E., 2008. “What’s Driving Food Prices?” Issue Reports 37951, Farm Foundation. https://www.farmfoundation.org/webcontent/Farm-Foundation-Issue-Report-Whats-Driving-Food-Prices-404.aspx
USDA: Foreign Agricultural Service: Production, Supply and Distribution database. https://apps.fas.usda.gov/psdonline/app/index.html#/app/home
![]()
![]()
![]()
![]()
![]()
