Today’s Demographics and Farm Characteristics of Large Producers
May 18, 2009
PAER-2009-8
Maud Roucan-Kane, Research Associate and Michael Boehlje, Distinguished Professor
The results of the 2007 Census of Agriculture show the new trends in agriculture (more farms, more smaller farms, more Internet use, more women operators, … ). The 2008 survey of commercial producers by Purdue University’s Center for Food and Agricultural Business complements the US census. It provides information on current demographics and farm characteristics, looks at general attitudes of producers and their use of communications media, and focuses on large farms.
The Survey
The 2008 Commercial Producer Project was undertaken with the goal of providing insight into this rapidly evolving group of commercial producers ‑ a group that accounts for the majority of agricultural inputs purchased. The Purdue University Center for Food and Agricultural Business (CAB) surveyed 2,574 producers in the following enterprises: corn/soybean, wheat/barley/canola, cotton, swine, dairy, beef, in early 2008. This survey is a follow‑up to similar studies completed in 1993, 1998, and 2003.
The producers‑respondents were located across the U.S., with the sample selected from those key states accounting for 75% of total U.S. pro‑ duction for each of the seven enterprises represented. The focus of this study is the “commercial” farmer (see Table 1).
For the purpose of this summary, producer’s size is defined based on 2007 planted acres or 2007 head marketed (see Table 1). After the responses were received and tabulated, the commercial producer category was divided further to determine if there were differences in the attitudes and opinions of the very large producers. The largest 15% of the commercial operations (termed “large”) have been grouped together and compared with the remaining commercial producers (85%). A total of 252 producers were categorized “large”, 1,185 were considered “commercial” with another 910 considered “mid‑size”.
Demographics
More than 86% of the respondents were the primary farm decision maker. Primary farm decision makers were less likely to be the respondent in the corn/soybean segment and in the under 35 age group. Compared to previous survey years, fewer respondents held the role of primary farm decision maker.
Nearly 89% of the respondents were male. The female respondents were more numerous in the corn/soybean, in livestock, and in mid‑size farms. Compared to previous surveys, female respondents were more numerous and more likely to be the spouse of the primary farm decision maker suggesting that spouses of the farm decision maker may have taken over the responsibility of responding to surveys.
The corn/soybean and hog enterprises were managed by younger farmers (53 years old on average) while the wheat/barley enterprises were operated by older farmers (57 year old on average). Larger farmers tended to be younger than the mid‑size farmers.
The majority of the respondents had graduated from high school, a two‑year college, or a technical/trade program. Cotton producers tended to be the most educated and dairy producers the least. As size increased, respondents were more likely to have received a higher level of education.
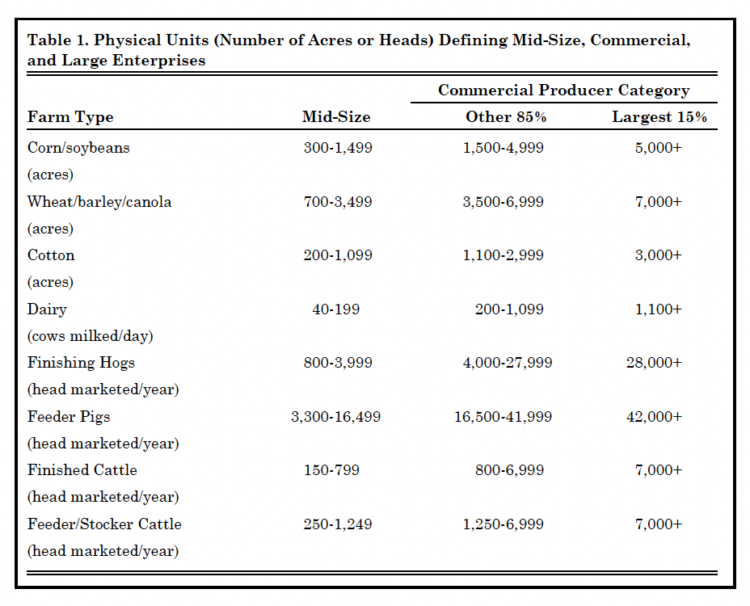
Table 1. Physical Units (Number of Acres or Heads) Defining Mid-Size, Commercial, and Large Enterprises
Farm Characteristics
Most of the respondents generated between $100,000 and $999,999 in gross farm sales. High growth producers (those expecting to grow more than 50% in size over the next 5 years) reported greater gross farm sales than their counterparts. Com‑ pared to previous surveys, gross farm sales had increased dramatically (see Figure 1).
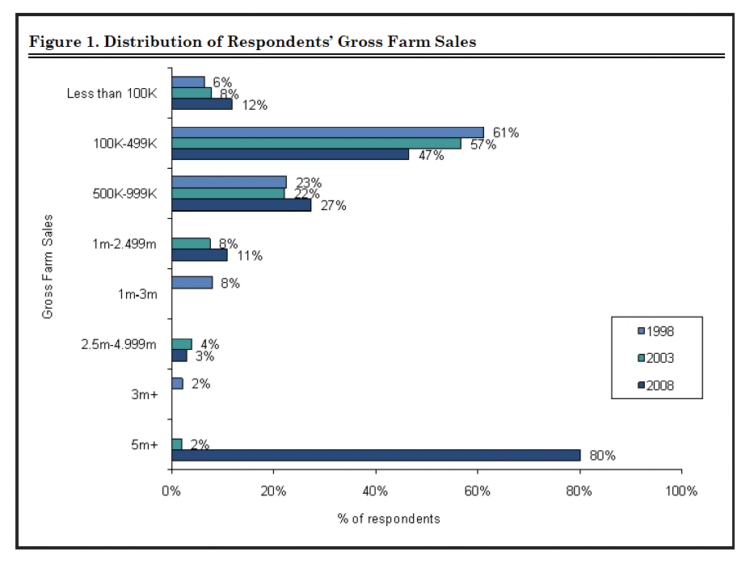
Figure 1. Distribution of Respondents’ Gross Farm Sales
Respondents were asked to report the percentage of crop and livestock production activities (fertilizer application, pesticide application, seeding, harvesting, row crop tillage, livestock handling, livestock finishing, and raising of breeding stock replacement) performed on their farm that were hired out to retailers, other farmers, or private custom service providers in 2007. Table 2 presents the percentage of respondents contracting some or all of their crop and livestock production activities. Results show that in general as size increases, producers were less likely to outsource their crop production activities but more likely to outsource their livestock production activities. Many corn/soybean producers out‑ source their crop production activities while fewer cotton producers did. Hog producers were more likely to outsource waste handling. Relative to previous surveys, there was less outsourcing for pesticide application and harvesting.
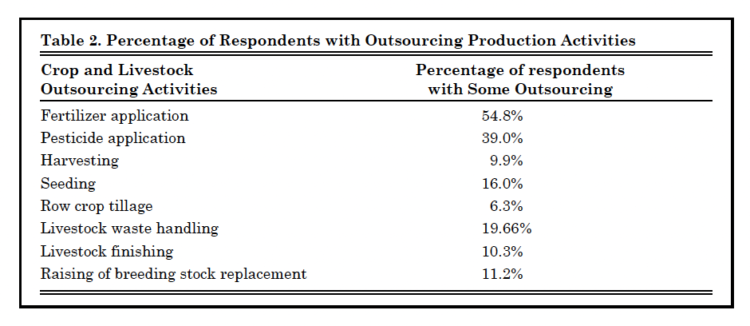
Table 2. Percentage of Respondents with Outsourcing Production Activities
Respondents were asked to report the percentage of their crop and livestock production produced under contract in which the buyer/contractor sets guidelines for at least one input. About 20% of the respondents contracted some or all their crop production. This number was slightly lower for livestock production under contract: about 18%. Large farms were more likely to use contracts for some of their crop production while fewer mid‑size farms contracted their livestock production. Corn and hog operations were more likely to pro‑ duce under contract. Farmers under 35 years old used crop contracting the least, while those 65 and older employed it the most. However, older producers used livestock contracting the least. There were significantly fewer respondents running their crop operations under contract in 2008 than in 2003.
Respondents were also asked to report the percentage of their crop and livestock production
that would be certified organic over the next five years; about 5% of the respondents expected to do so in crop production versus 7% for livestock production. Interestingly, 11% of the under 35 age group reported that they will have between 75 and 100% of their livestock production certified organic over the next five years.
Production
Respondents were asked to report their number of acres or head marketed in each enterprise for 2007 and their expectations for 2012. Compared to the 2003 survey, overall farm sizes had increased modestly; finishing hogs and feeder pigs had seen the most change.
Using the responses of the respondents for their 2007 production and their expected 2012 production, we computed the growth rate for the respondents’ primary enterprise. Commercial corn/soybean and dairy producers anticipated the most growth. Commercial cotton producers and cattle producers foresaw the least growth. Significant growth was expected for the largest finished hog operations. Not surprisingly, younger producers anticipated more growth. Relative to previous surveys, much slower growth was anticipated for all respondents.
To grasp better the anticipated change over the next five years, beyond a numeric growth rate, respondents were asked to describe how their farming operation may change in business enterprise focus over the next five years. The majority selected the category “remain the same”. This was particularly true for cattle producers. High growth producers were more likely to become more specialized. Relative to previous surveys, the category “remain the same” was selected more often this time.
When asked how they anticipate their crop rotation will be determined over the next five years, over 55% of the respondents selected “historical crop rotation patterns”. For cotton producers, historic crop rotation pat‑ terns were less likely to determine their crop rotation. For wheat producers, and for the under 35 and 65+ age groups, crop prices during pre‑plant planning were much less important.
Prices were more important for high growth producers. Weather conditions at planting time were less of a criterion for corn/soybean producers.
General Attitudes
Overall respondents were confident in their farming ability (see Figure 2). They considered themselves success‑ ful, particularly younger producers. They believe they were achieving most of their goals, particularly again younger producers. They were optimistic about their farming future, particularly as size increases and again for younger producers. Relative to other survey years, this year marked more optimism and more agreement with those general attitudes. High growth producers also tended to be more optimistic and positive regarding those general attitudes. Respondents were also asked to rate their agreement with the statement “other producers often ask my opinion”. They tended to agree with this statement, particularly as size increases, and particularly for younger and high growth producers. However, fewer than in the past agree that others ask for their opinion.
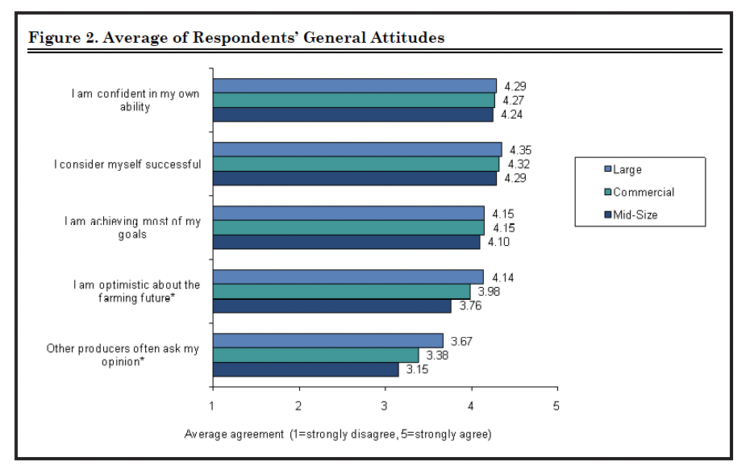
Figure 2. Average of Respondents’ General Attitudes
Turning to issues that these producers consider challenges, the following question was asked: “Over the next 5 years, describe the single biggest management challenge facing farming operations like yours?” Profitability (managing costs, low prices/margins, making capital investments, etc.), marketing (pricing, promotion, etc.), and management (market fluctuations, disease and pest control, paperwork, technology) issues dominated the list of concerns for producers. Profitability was more of
a concern for large (see Figure 3), hog, and wheat/barley farms. Com‑ pared to normal growth producers, high growth producers were less concerned by profitability and more by marketing. When the study was completed, market volatility in nearly all agricultural commodities was much on the minds of farmers making marketing more of an issue than in past surveys. Compared to the 2003 survey, management was also mentioned more frequently in this survey.
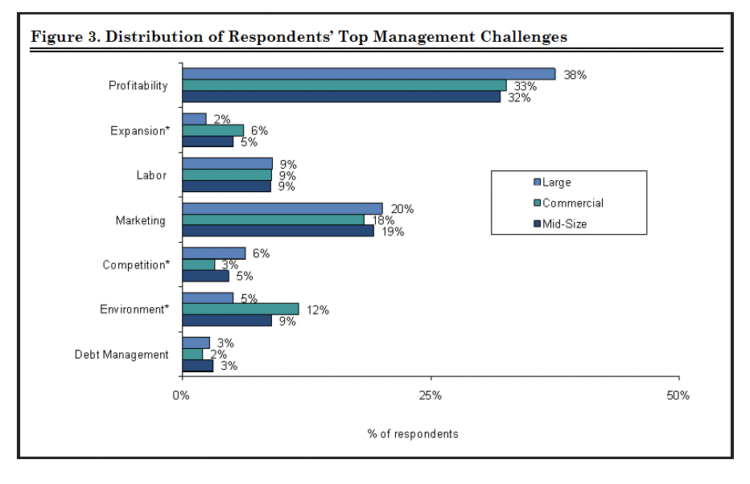
Figure 3. Distribution of Respondents’ Top Management Challenges
Finally, the types of management tools and techniques that producers are using to help achieve their goals and address the above management challenges were explored. A total of nine different tools and techniques were considered. Crop insurance, membership in a cooperative, and for‑ ward pricing for products produced or inputs purchased were the most frequently cited by producers. In most cases, the larger the farm business, the more likely they were to use a specific tool/technique (see Figure 4).
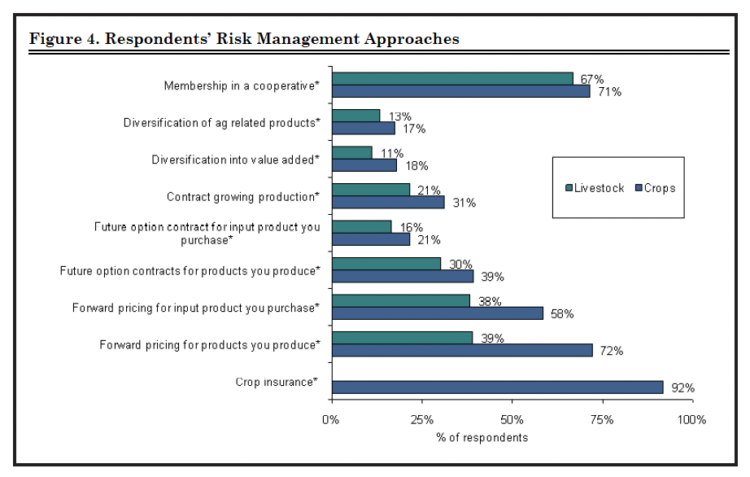
Figure 4. Respondents’ Risk Management Approaches
Younger producers (under 35) were more likely to attend management/business seminars and technical seminars, and more likely to have written marketing plans and written long‑term goals. Those producers over 65 were more likely to have written management and ownership succession plans. Forward pricing was more popular in 2008 than in 2003. Forward pricing was also more employed by crop producers, particularly by corn/soybean farmers. High growth producers were more likely to use these tools and techniques (except for future option contracts on purchased inputs).
Communications Media
Input suppliers, extension educators, and associations have many avenues through which to communicate with producers. The survey indicates that producers preferred messages delivered through printed materials (see Figures 5 part 1 and 5 part 2). More than one‑half of producers indicated that they never or rarely find agricultural e‑mails or Web sites useful. Just less than three‑fourths of respondents indicated that they find general farm publications and agricultural newspapers sometimes, often or always useful. Ag websites and emails were not found as useful by the 65+ age group. Interestingly, all communication medias (except Ag TV programs) were found less useful than in past surveys.
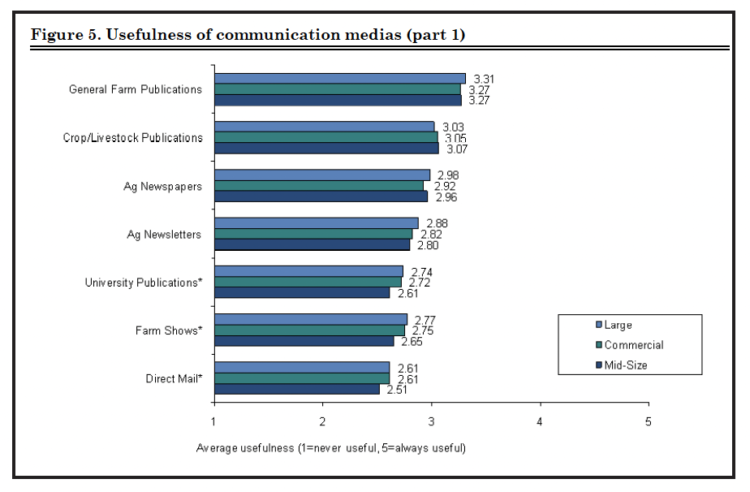
Figure 5a. Usefulness of communication medias (part 1)
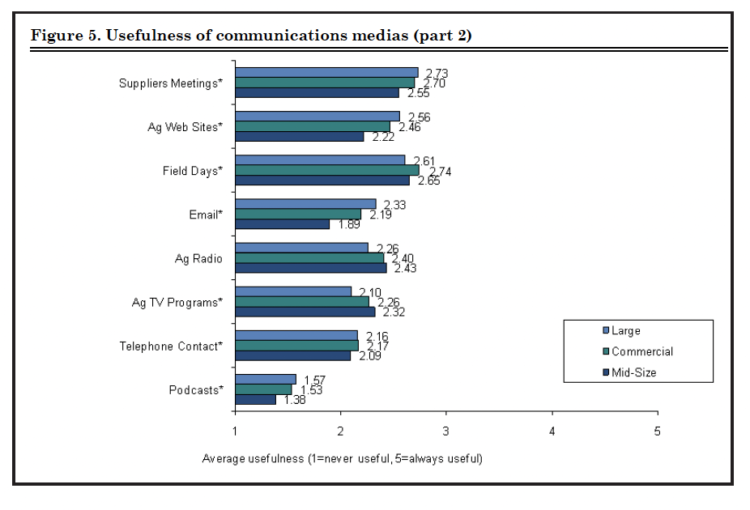
Figure 5b. Usefulness of communications medias (part 2)
Conclusion
The 2008 survey occurred at a time of high agricultural prices and margins. Hence, producer attitudes likely reflected those market conditions. Compared to 2003, they found themselves more confident, more successful and more likely to achieve their goals. Such attitudes have important implications for suppliers’ sales and marketing strategies. Producers are likely to welcome products, services and information. And, the larger the operation, the more closely other producers watch them.
Consequently, getting a new product on a large farm is likely to generate word‑of‑mouth promotion benefits with other producers.
Given these uncertain times, farmers are likely to be more interested in risk management tools, such as forward pricing. Helping today’s producers means assisting them with their management and marketing issues, along with offering risk management tools. These tools will probably become more critical to farmers as the economic crisis continues. Choosing the right communication channel to deliver this message will also be important – traditional communications media such as farm publications still count.
