Trends and Changes in Agricultural Job Opening Salaries
May 15, 2024
PAER-2024-13
Joshua Strine, Doctoral Student
![]()
![]()
![]()
![]()
![]()
Introduction
Between 2020 and 2025, an estimated 59,400 annual job openings are expected in the agricultural job sector (Fernandez et al., 2020). To fill these positions, hiring companies must get connected with individuals on the job market. There are many different factors that job-seeking individuals consider when looking for a new job. These factors may include location, salary, company review, or benefits, amongst other job details (Glassdoor, 2018). An analysis of the job market can provide insight into the current conditions that influence job-seeking individuals’ decisions, as well as how job market conditions have changed over time. According to the job boards Monster and Glassdoor, 61 – 67% of job-seeking individuals say salary is the most important factor when looking for a new job (Glassdoor, 2018; Monster, 2022). Since salary is commonly regarded as the most important factor when considering a job, in this analysis, we will seek to describe trends and changes in job market salaries.
Data
One of the most efficient ways to connect job seekers and hiring companies is through online job boards. There are many different formats of job boards. Some large companies, such as John Deere or Corteva, have company-specific job boards on their websites. Additionally, companies can pay to have their openings posted on general job boards, such as Indeed, Glassdoor, or ZipRecruiter. To cast a wider net, companies may also post to multiple job boards, which may include company-specific job boards or multiple general job boards. Google Jobs is unique in that it collects job postings from other websites and compiles them into one list on the Google Jobs website. Any posting on a job board that shares information with Google Jobs is also on the Google Jobs website. By using Google Jobs, job-seeking individuals can search multiple job boards at once. Additionally, it provides a sample of current job openings to evaluate current job market conditions.
Using SerpApi, Google Jobs has been scraped for agricultural jobs in the United States every four weeks since June 16, 2021. The scrape provides information such as job title, company, location, posting source, job description, and salary. Figure 1 provides an example search of Google Jobs for agricultural jobs in Indiana on January 31, 2024. The first four postings are from four companies and four different job boards. Only one of the postings includes salary information. By searching for keywords in the job titles and descriptions, we can place jobs into one or more agricultural subsectors, or specific job qualifications can be identified. Each collection can serve as a snapshot of the job market that we can compare to previous and future collections to find changes in the job market over time.
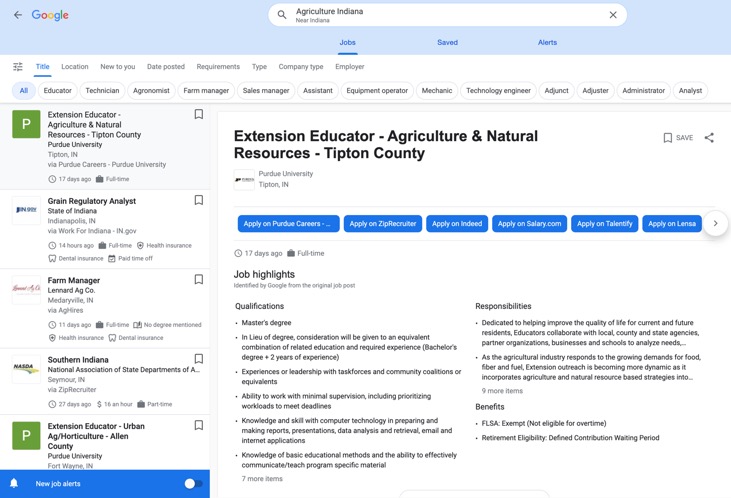
Figure 1. Example Google Jobs search for agricultural jobs in Indiana.
Figure 2 shows the number of job openings for each collection date. Active job openings have varied significantly over the last two years. On June 16, 2021, I collected 3,808 agricultural job openings from Google Jobs. This number climbed to 6,308 by May 2022 before decreasing to 2,838 in September 2022, the lowest number of job openings throughout the data collection timeframe. Since then, there has been a trend of increasing active job openings leading up to the most recent collection of 4,786 jobs. Not every job opening collected from Google Jobs contains salary information. At any specific collection date, no more than a third of job openings have included salary data. There has, however, been a trend of increasing percentages of job openings posting salary information. On June 16, 2021, 15% of collected openings (578 of 3,808 agricultural job openings) included the job’s salary. The most recent collection on January 24, 2024, had 31% of collected openings (1,469 of 4,786 collected openings) that included the job’s salary. I will use this subsample of jobs containing salary information to describe the average pay of agricultural job openings.
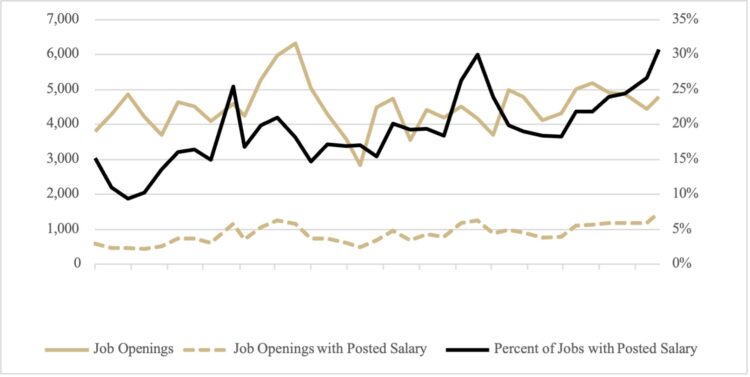
Figure 2. Current agricultural job openings and openings containing salary information at each collection date.
Results
Figure 3 depicts the average and median posted salary for agricultural job openings. The start of each year is marked on the graph by vertical lines. The average posted salary reached a series maximum of $63,945 on January 27, 2023, and had a minimum of $42,247 on February 4, 2022. Most recently, the average salary was $53,594 on January 24, 2024. Multiple trends exist in the data. First, an increase in posted salaries from 2022 to 2023 is present. The average salary of job openings across all scrapes in 2022 and 2023 were $49,373 and $56,147, respectively. Only once in 2023 was the average posted salary less than the average posted salary one year prior, which occurred in October. Contrarily, posted salaries were consistently higher in 2021 than in 2022.
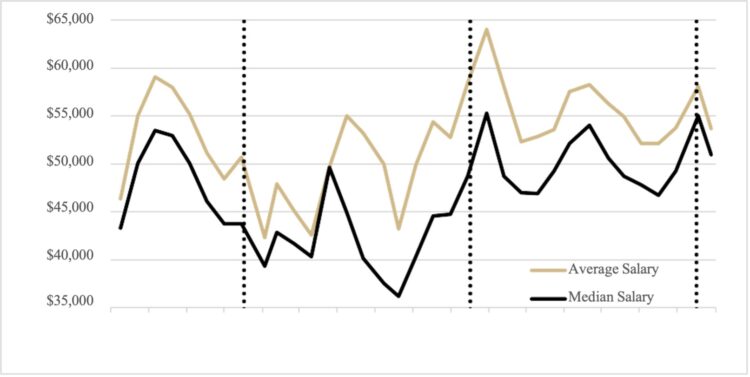
Figure 3. Average and median posted agricultural job opening salary delineated by year.
The average salary across all scrapes in 2021 was $52,051. One possible explanation is the increased demand for employees as companies transitioned back to full operation following the pandemic. Companies may have had to increase the wages they were offering to recruit more workers. Another observable trend is an elevated average agricultural job opening salary during summer. Salaries reached summer peaks of $59,012 in August 2021, $54,939 in June 2022, and $58,179 in July 2023. Any trend continuation into 2024 is yet to be observable, but the average salary of agricultural job openings for January 2024 was lower than the average salary in 2023. Thus far, the average salary for 2024 job openings is $55,929. The median salary of agricultural job openings follows a similar trend to the average salary.
Conclusions
Based on the data collected from Google Jobs, the average salary of agricultural job openings has changed over time and demonstrates long-term trends. A year-over-year increase in salary is observed between 2022 and 2023. This is not the case between 2021 and 2022, which may be explained in part by the disruptions caused by the pandemic. Additionally, average posted salaries are elevated during the summer months of each year. It is important to reiterate that these results are based on a sample of jobs collected from Google Jobs. The average salary calculated from the collected job openings may not reflect the average salaries of all agricultural job openings. Changes and trends in the collected salaries may represent the changes and trends in the agricultural job market.
References
Fernandez, J. M., Goecker, A. D., Smith, E., Moran, E. R., & Wilson, C. A. (2020). Employment Opportunities for College Graduates in Food, Agriculture, Renewable Natural Resources and the Environment; United States, 2020-2025. United States Department of Agriculture, National Institute of Food and Agriculture. https://www.purdue.edu/usda/employment/
Glassdoor. (2018). Glassdoor study reveals what job seekers are looking for. https://www.glassdoor.com/employers/blog/salary-benefits-survey/
Monster. (2022). Monster Poll: Workers Want Pay Transparency. Available online at: https://hiring.monster.com/resources/blog/workers-want-pay-transparency/
![]()
![]()
![]()
![]()
![]()