Trends in Land Prices, Cash Rents, and Price to Rent Ratios for Iowa, Illinois, and Indiana
August 6, 2016
PAER-2016-11
Michael Boehlje; Michael Langemeier
![]()
![]()
![]()
![]()
![]()
Farmland prices declined over much of the Corn Belt region during the last couple of years. However, farmland prices remain substantially above historical prices. For example, despite having dropped approximately 12% since 2014, average farmland prices in Indiana are still approximately six times what they were in 1990 and approximately double what they were in 2007 (Dobbins and Cook, 2016). Concerns are still being expressed that farmland prices are higher than justified by the fundamentals. One justification for this concern is that previous research has established the tendency of the farmland market to over-shoot its fundamental value.
This paper examines recent trends in cash rents and farmland prices for Iowa, Illinois, and Indiana, and examines the relationship between farmland price and cash rent for each state. We use USDA-NASS farmland price and cash rent data for each state from 1973 to 2015 to examine recent trends, and to compute farmland price to cash rent ratios. To further examine trends in farmland prices and cash rents, we use data from surveys by Iowa State University (Ag Decision Maker), the Illinois Society of Professional Farm Managers and Rural Appraisers, and Purdue (Dobbins and Cook).
Trends in Cash Rents and Land Values
Table 1 reports peak years and percentage declines from the peak to 2015 for cash rent and farmland prices in Iowa, Illinois, and Indiana. Using the USDA-NASS data, the peak years occurred one year later than that reported using state surveys. Also, the percentage declines, using the USDA-NASS data, were smaller for each state than they were using the state surveys. Using the state surveys, cash rents and farmland prices peaked in 2013 in Iowa and Illinois, and 2014 in Indiana. Percentage declines in cash rents from the peak year to 2015 ranged from 1.3% in Indiana to 12.3% in Illinois. For farmland prices, the percentage declines from the peak year to 2015 ranged from 3.8% for Indiana to 17.1% for Illinois.
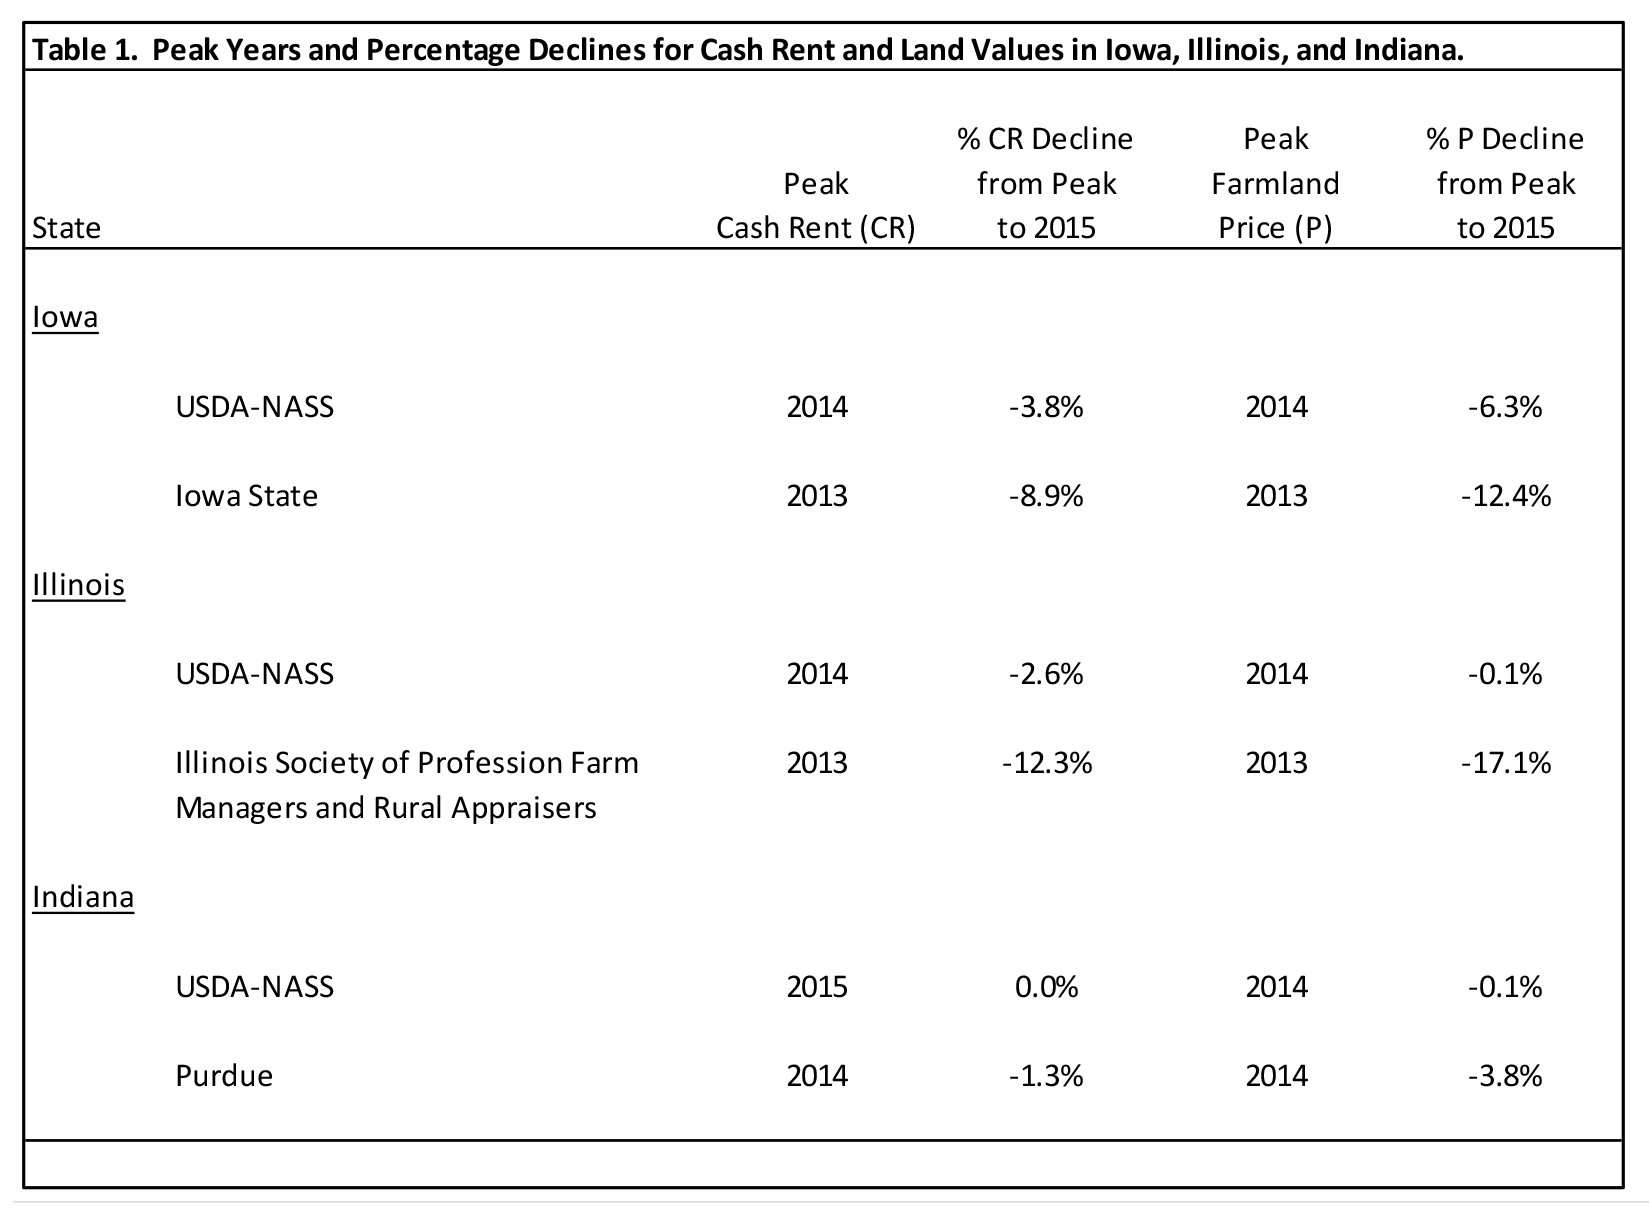
Table 1. Peak Years and Percentage Declines for Cash Rent and Land Values in Iowa, Illinois, and Indiana.
State survey cash rent data for 2016 is available for Iowa and Indiana, and state survey farmland price data for 2016 is available for Indiana. Percentage declines in cash rent from the peak year through 2016 were approximately 15% in Iowa and approximately 12% in Indiana. Farmland prices have declined approximately 12% since 2014 in Indiana.
The percentage declines reported above for the past two years are substantially smaller than those experienced in a 6-year period of the 1980s. Using USDA-NASS data, cash rents and farmland prices
increased dramatically during the 1970s. Peak farmland prices for the 1980s were reached in 1981 in Iowa, Illinois, and Indiana. Due to low earnings per acre and high interest rates, cash rents and farmland prices dropped significantly from the peak year through 1987. From 1981 to 1987, cash rent and farmland price in Iowa declined 30% and 65%, respectively. In Illinois, cash rent and farmland price declined 25% and 55%, respectively, while in Indiana the percentage declines were 29% for cash rent and 42% for farmland price.
It is important to remember that the declines in cash rents and farmland prices that occurred in the 1980s lasted six years. During the first year (two years) of the six year decline, average cash rents in the three states increased 2.0% (declined 1.0%), and average farmland prices in three states declined 5.3% (19.3%), respectively. From 2014 to 2015, average cash rents and farmland prices for the three states declined 2.1% and 2.2%, respectively.
What are the differences and similarities in the underlying fundamentals between the 1980s and the current period? We will start by discussing the similarities. In the 1980s, earnings per acre were relatively low for five straight years (1982 to 1987). Similarly, earnings per acre were relatively low in 2014, 2015, and 2016. Continued weak earnings currently appear likely and will put further downward pressure on cash rents and farmland prices.
One major difference between the two periods is the trend in interest rates. Figure 1 illustrates the interest rate on real estate loans, using data from the Federal Reserve Bank of Chicago, from 1976 to 2015. Interest rates on real estate loans climbed above 10.0% in 1979, reached a peak of 16.5% in 1981, and stayed above 10.0% until 1992. In contrast, more recent interest rates on real estate loans have been below 5.0% since 2012. The result was much more cash flow stress on debt purchased land in the 1980s than today.
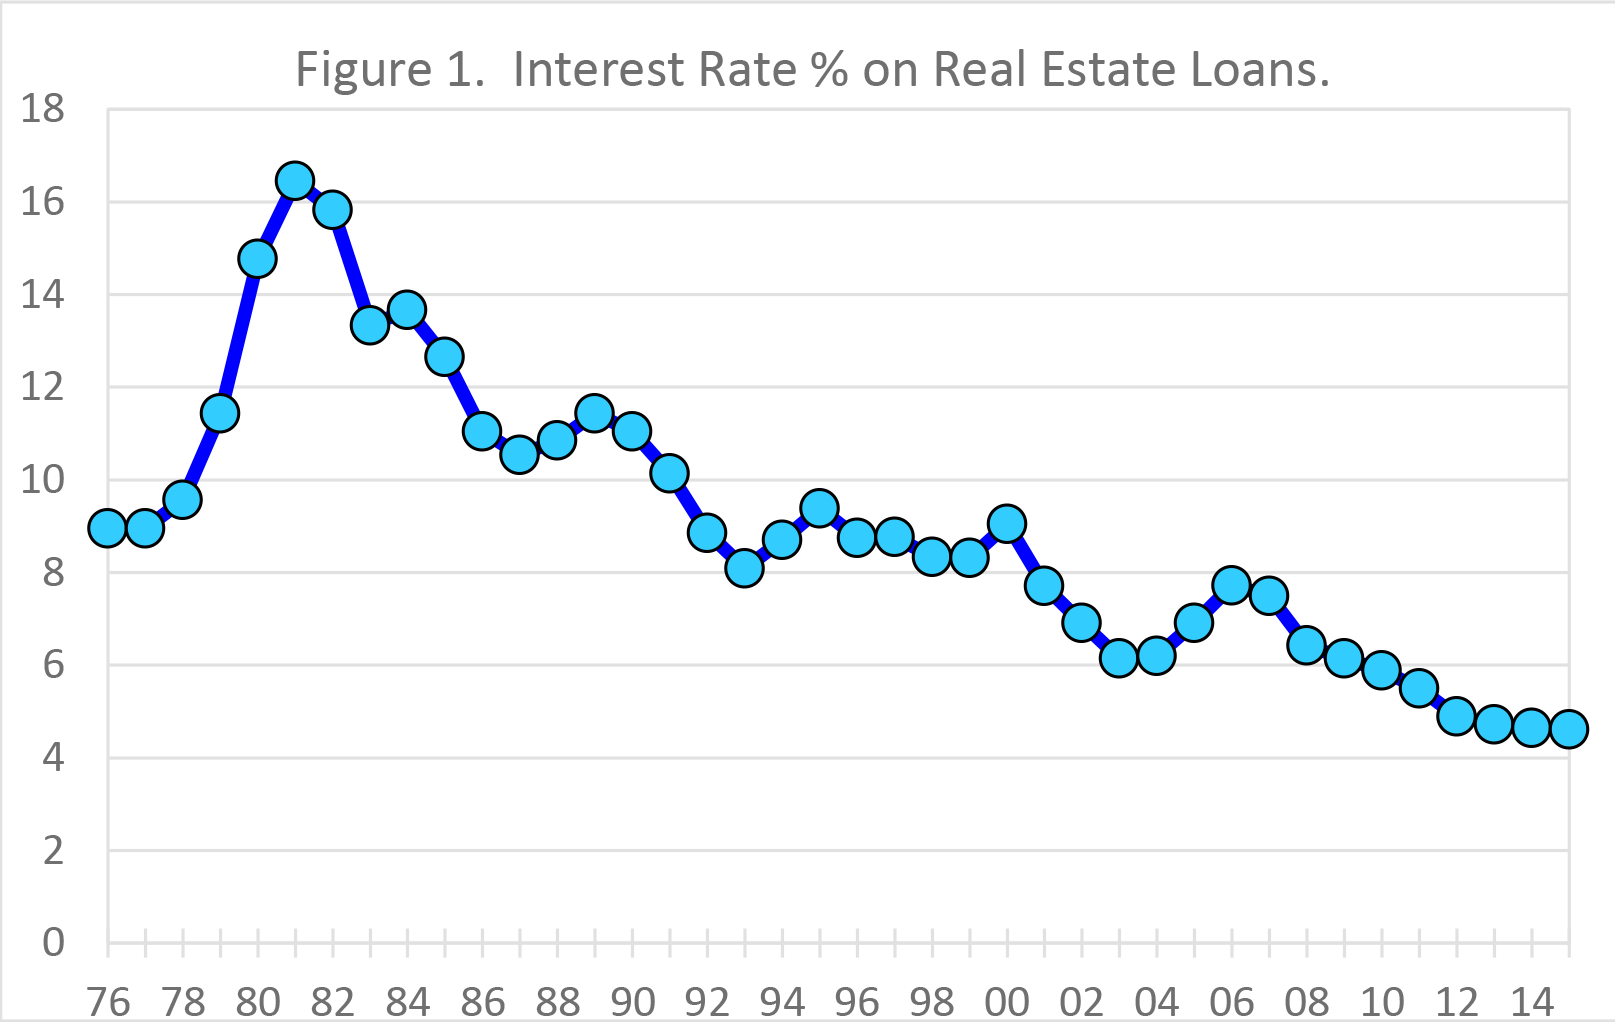
Figure 1. Interest Rate % on Real Estate Loans.
Inflation rates also differ between the two periods (Federal Reserve Bank of St. Louis). Inflation averaged 7.7% from 1973 to 1981, and exceeded 10.0% in 1980. Since 2009, the annual inflation rate has been below 3.0%. The percentage declines in cash rents and farmland prices in Iowa, Illinois, and Indiana this time are not expected to be as large as those experienced in the 1980s, unless earnings per acre collapse even more, or inflation and interest rates increase dramatically.
Some Decline in the Price to Rent Ratio?
A standard measure of financial performance commonly used for stocks is the price to earnings ratio (P/E). A high P/E ratio sometimes indicates that investors think the investment has good growth opportunities, relatively safe earnings, a low capitalization rate, or a combination of these factors. However, a high P/E ratio may also indicate that an investment is less attractive because the price has already been bid up to reflect these positive attributes. Using the work of Baker, Boehlje, and Langemeier (2014, 2015), we compute an equivalent ratio for crop agriculture, the farmland price to cash rent ratio (P/rent). Figure 2 shows the trend in P/rent values for Iowa, Illinois, and Indiana from 1973 to 2015 using USDA-NASS farmland price and cash rent data. As expected, the P/rent ratios for the three states are highly correlated. Over the sample period, the P/rent ratio for Iowa, Illinois, and Indiana averaged 20.3, 21.2, and 21.2, respectively. P/rent ratios increased during the 1970s, peaked in 1980, declined rapidly from 1981 to 1987, and then started increasing in 1988. At the peak in 1980 (trough in 1986/1987), the P/rent ratio in the three states ranged from 20.0 to 23.3 (10.2 to 13.3 in the trough). It is important to note that, even at the 1980 peak, the P/rent ratio for each state was well below the current P/rent ratios.
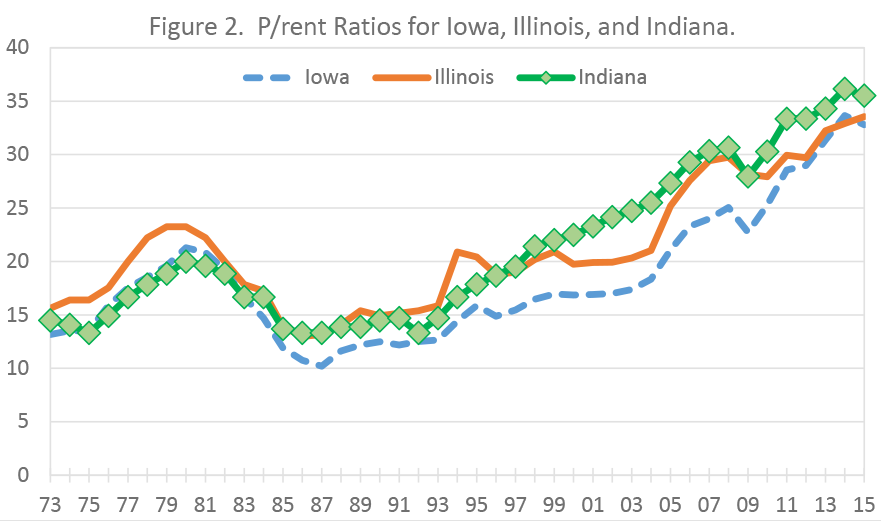
Figure 2. P/rent Ratios for Iowa, Illinois, and Indiana.
P/rent ratios have been above the 1973 to 2015 average in Iowa and Illinois since 2005, and in Indiana since 2004. The P/rent ratio peaked at 33.7 in 2014 in Iowa, at 33.6 in 2015 in Illinois, and at 36.2 in 2014 in Indiana. As noted above, the current P/rent ratios are well above their long-run averages, and above the levels experienced in the early 1980s. This leads us to the following question. Will the P/rent ratios in the three states drop significantly during the next few years? The answer to this question is highly dependent on what happens to inflation and interest rates. Farmland is considered a good hedge against inflation over the long-run (Baker, Boehlje, and Langemeier, 2014). If inflation increases, there could be less downward pressure on farmland price and the P/rent ratio, assuming the inflation increase does not cause a rise in interest rates. Conversely, if the long-term interest rate increases, there will be greater downward pressure on farmland prices and the P/rent ratio. If neither of these occur (increase in inflation or long-term interest rate), the P/rent ratio may decline modestly, but is likely to stay above its long-run average for the foreseeable future.
Cyclically Adjusted Price to Rent Ratio
Shiller (2005; 2014) uses a moving average for earnings in the P/E ratio, often labeled the cyclically adjusted P/E (CAPE), to remove the effect of the economic cycle on the stock market P/E ratio. When earnings collapse in recessions, stock prices often do not fall as much as earnings, and the P/E ratios based on the low current earnings sometimes become very large (e.g., in 2009). Similarly, in good economic times P/E ratios can fall and stocks look cheap, simply because the very high current earnings are not expected to last, so stock prices do not increase as much as earnings. By using a moving average of earnings in the denominator of the P/E ratio, Shiller’s CAPE smooths out these business cycle effects.
The P/rent ratios reported thus far are the current year’s farmland price divided by current cash rent. Here we model our P/rent5 ratio after Shiller’s cyclically adjusted P/E ratio. The P/rent5 ratio is computed by dividing the current farmland price by the 5-year moving average cash rent.
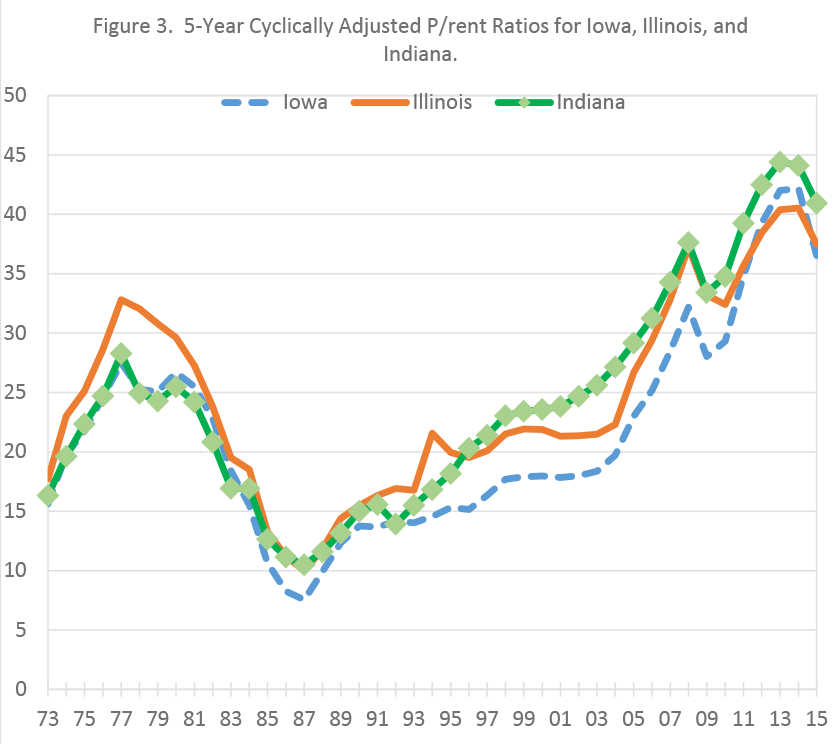
Figure 3. 5-Year Cyclically Adjusted P/rent Ratios for Iowa, Illinois, and Indiana.
Figure 3 shows the P/rent5 ratio for Iowa, Illinois, and Indiana. The P/rent5 ratio for each state followed a similar pattern to that of the P/rent ratio in each state. The P/rent5 ratio has been above its average for the 1973 to 2015 period since 2006 in Iowa, since 2005 in Illinois, and since 2002 in Indiana. The peak years and ratios for each state were as follows: 42.2 in 2014 for Iowa, 40.5 in 2014 for Illinois, and 44.4 in 2013 for Indiana. The P/rent5 ratios declined sharply for each state in 2015. The discussion below will focus on the relationship between the two P/rent measures, and projected trends in the P/rent5 ratio.
First, we examine the relationship between the P/rent ratio and the P/rent5 ratio. For ease of illustration, we present the relationship for the two P/rent measures for just Indiana in Figure 4. A couple of observations pertaining to Figure 4 are particularly noteworthy. The P/rent5 ratio reached a higher peak and exhibited a deeper trough in the 1970s and 1980s than the P/rent ratio. The reason for this difference can be best understood by examining trends in cash rents during the period. Cash rent was rising from 1973 to 1981. This upward trend in cash rent resulted in a 5-year moving average cash rent that was lower than the actual cash rent. Subsequently, the P/rent5 ratio was higher than the P/rent ratio. The opposite occurred from 1982 to 1988 – cash rent declined faster than the moving average of cash rent. This created a lower P/rent5 ratio in comparison to the P/rent ratio.
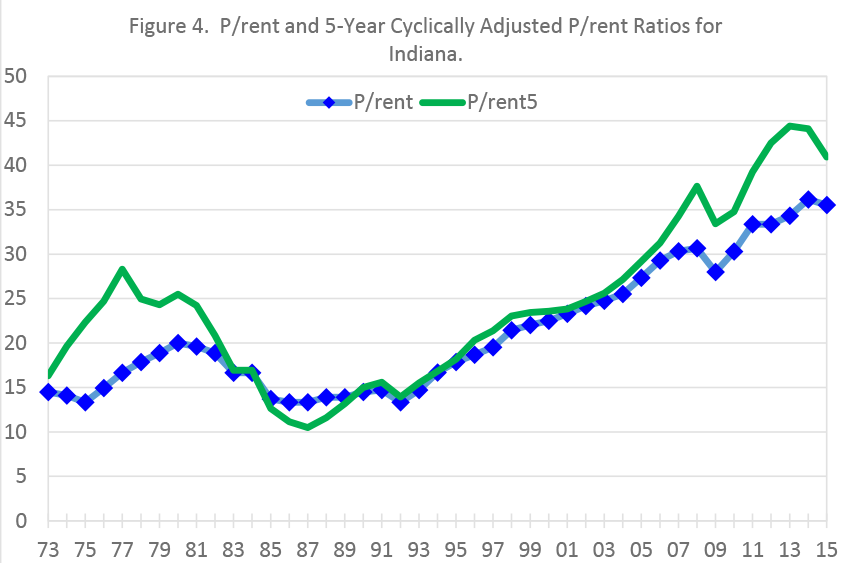
Figure 4. P/rent and 5-Year Cyclically Adjusted P/rent Ratios for Indiana.
It is also important to note that the P/rent5 ratio has been higher than the P/rent since 1989. In general, from 1989 to 2014 cash rents steadily increased. These increases were particularly large from 2006 to 2013. These phenomena created a situation in which the P/rent5 ratio was higher than the P/rent ratio, larger differences in the ratios between 2006 and 2013.
For reasons similar to that given for the P/rent ratio, the P/rent5 ratio is likely to stay above its long-run average for the foreseeable future if inflation and interest rates remain low. If the cash rent continues to decline, the P/rent5 ratio will move below the P/rent ratio.
Final Comments
Farmland prices and cash rents have fallen in Iowa, Illinois, and Indiana in the last couple of years. However, our analysis indicates that the P/rent ratio (farmland price per acre divided by cash rent per acre) and cyclically adjusted P/rent ratio (farmland price per acre divided by average cash rent for the previous five years) continue to be substantially higher than historical values.
In order to maintain the current high farmland values, cash rents would have to remain very high, or even move higher, and inflation and interest rates would also have to remain very low. Most agricultural economists expect crop returns to be modest, putting downward pressure on cash rents, and for inflation and interest rates to move upward in coming years. However, even if they increase moderately, inflation and interest rates are likely to remain below their long-run averages. This suggests that the P/rent and P/rent5 ratios may decline somewhat over the next few years but remain above their long-run averages.
Ag Decision Maker. “Historical County Cropland Rental Rates,” July 2016, Iowa State University.
Ag Decision Maker . “Historical County Farmland V alues, ” April 2016, Iowa State University.
Baker, T., M. Boehlje, and M. Langemeier. “Farmland: Is it Currently Priced as an Attractive Investment?” American Journal of Agricultural Economics. 96(October 2014):1321- 1333.
Baker, T.G., M.D. Boehlje, and M.R. Langemeier. “Is Farmland Still an Attractive Investment? An Update.” Purdue Agricultural Economics Report, Purdue University, August 2015, pages 12- 16.
Dobbins, C.L. and K. Cook. “Indiana Farmland Values and Cash Rents Continue Downward Adjustments.” Purdue Agricultural Economics Report, Purdue University, August 2016.
Federal Reserve Bank of Chicago. AgConditions. www.chicagofed.org/research/data/ag-conditions/index, accessed July 25, 2016.
Federal Reserve Bank of St. Louis. PCE Indices. www.fred.stlouisfed.org/, accessed July 25, 2016.
Illinois Society of Professional Farm Managers and Rural Appraisers. 2016 Illinois Land Values and Lease Trends.
Shiller, R.J. 2005. Irrational Exuberance, Second Edition. New York: Crown Business.
Shiller, R.J. 2014. S&P 500 P/E Ratio. www.multpl.com, accessed July 19, 2016
![]()
![]()
![]()
![]()
![]()