Turn Around in Land Values
August 1, 1983
PAER-1983-1
Author: J.H. Atkinson, Professor of Agricultural Economics
![]()
![]()
![]()
![]()
![]()
Note: The charts in this article were taken from physical copy scans – as the original documents no longer exist. These versions are very blurry – we apologize in advance for the quality.
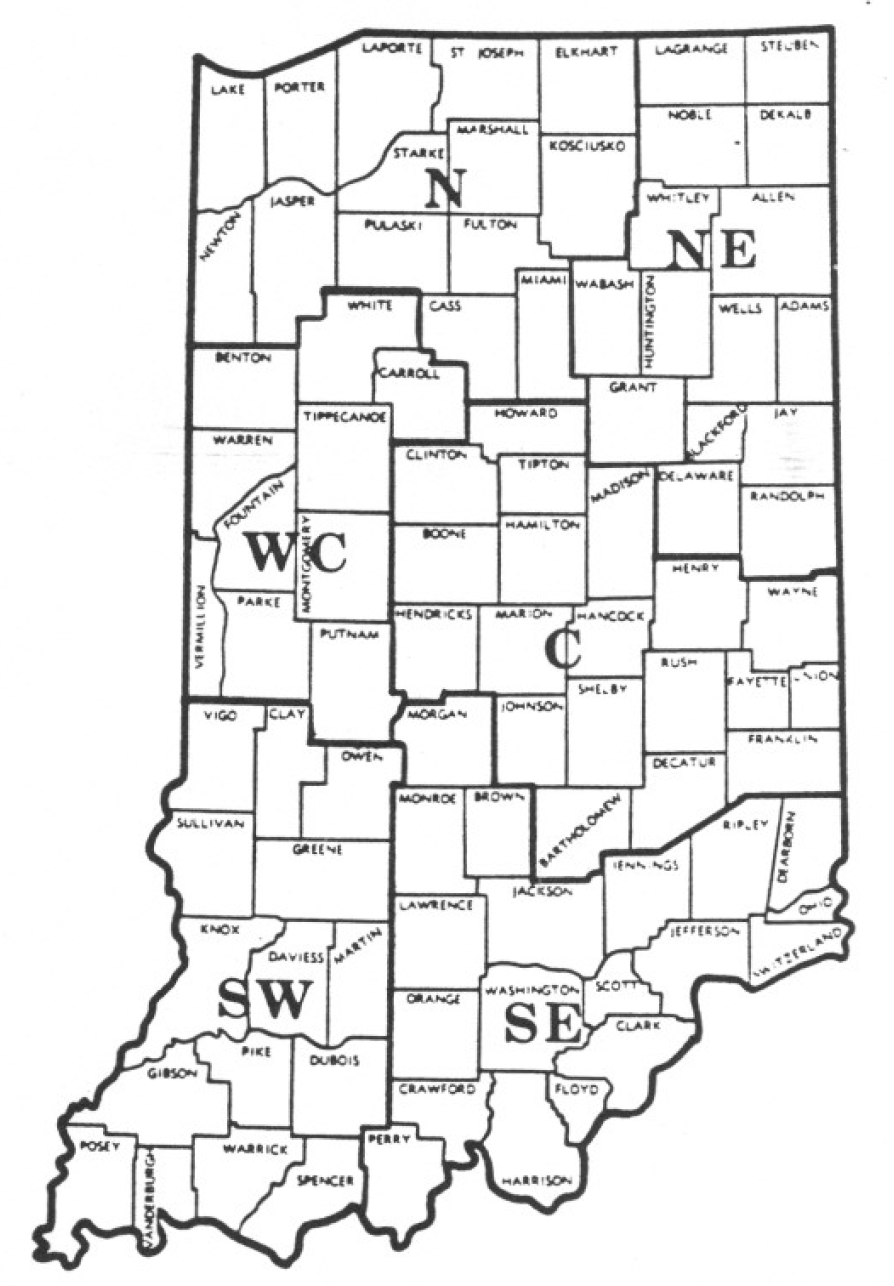
Figure I. Geographic areas used in the 1983 land value survey, Purdue University, July 1983.
The annual Purdue land values survey shows that Indiana land values on a statewide basis peaked in June 1981. From then until the low point of December 1982, bare tillable land of average quality declined 27 percent and top quality land 28 percent. There were wide variations by area of the state (Figure I). Top quality land in the northeast declined by a third, while average land in the southeast dropped by only 9 percent. ln general, declines were greater in the northern two-thirds of the state than in the south. However, if measured from the peak which occurred in the south in December rather than June 1981, the decline in the south was about 20 percent. Early this year, indications from meetings with farm managers, appraisers, lenders and farmers were that the low point of the recent sharp drop in land values had been reached around year-end. ln April, the Federal Reserve Bank of Chicago reported that their quarterly survey of bankers indicated a slight rise in Indiana land values from January to April. The Purdue survey now provides additional evidence that land values have increased since last December.
Statewide, the survey indicated that land values increased about 2.5 percent in the 6 months ending in June (Table 1). The estimated value of top land was nearly $2,000 per acre, and average land was a little less than $1,600. Estimated long term yields were 137 bushels and 111 bushels for top and average land.
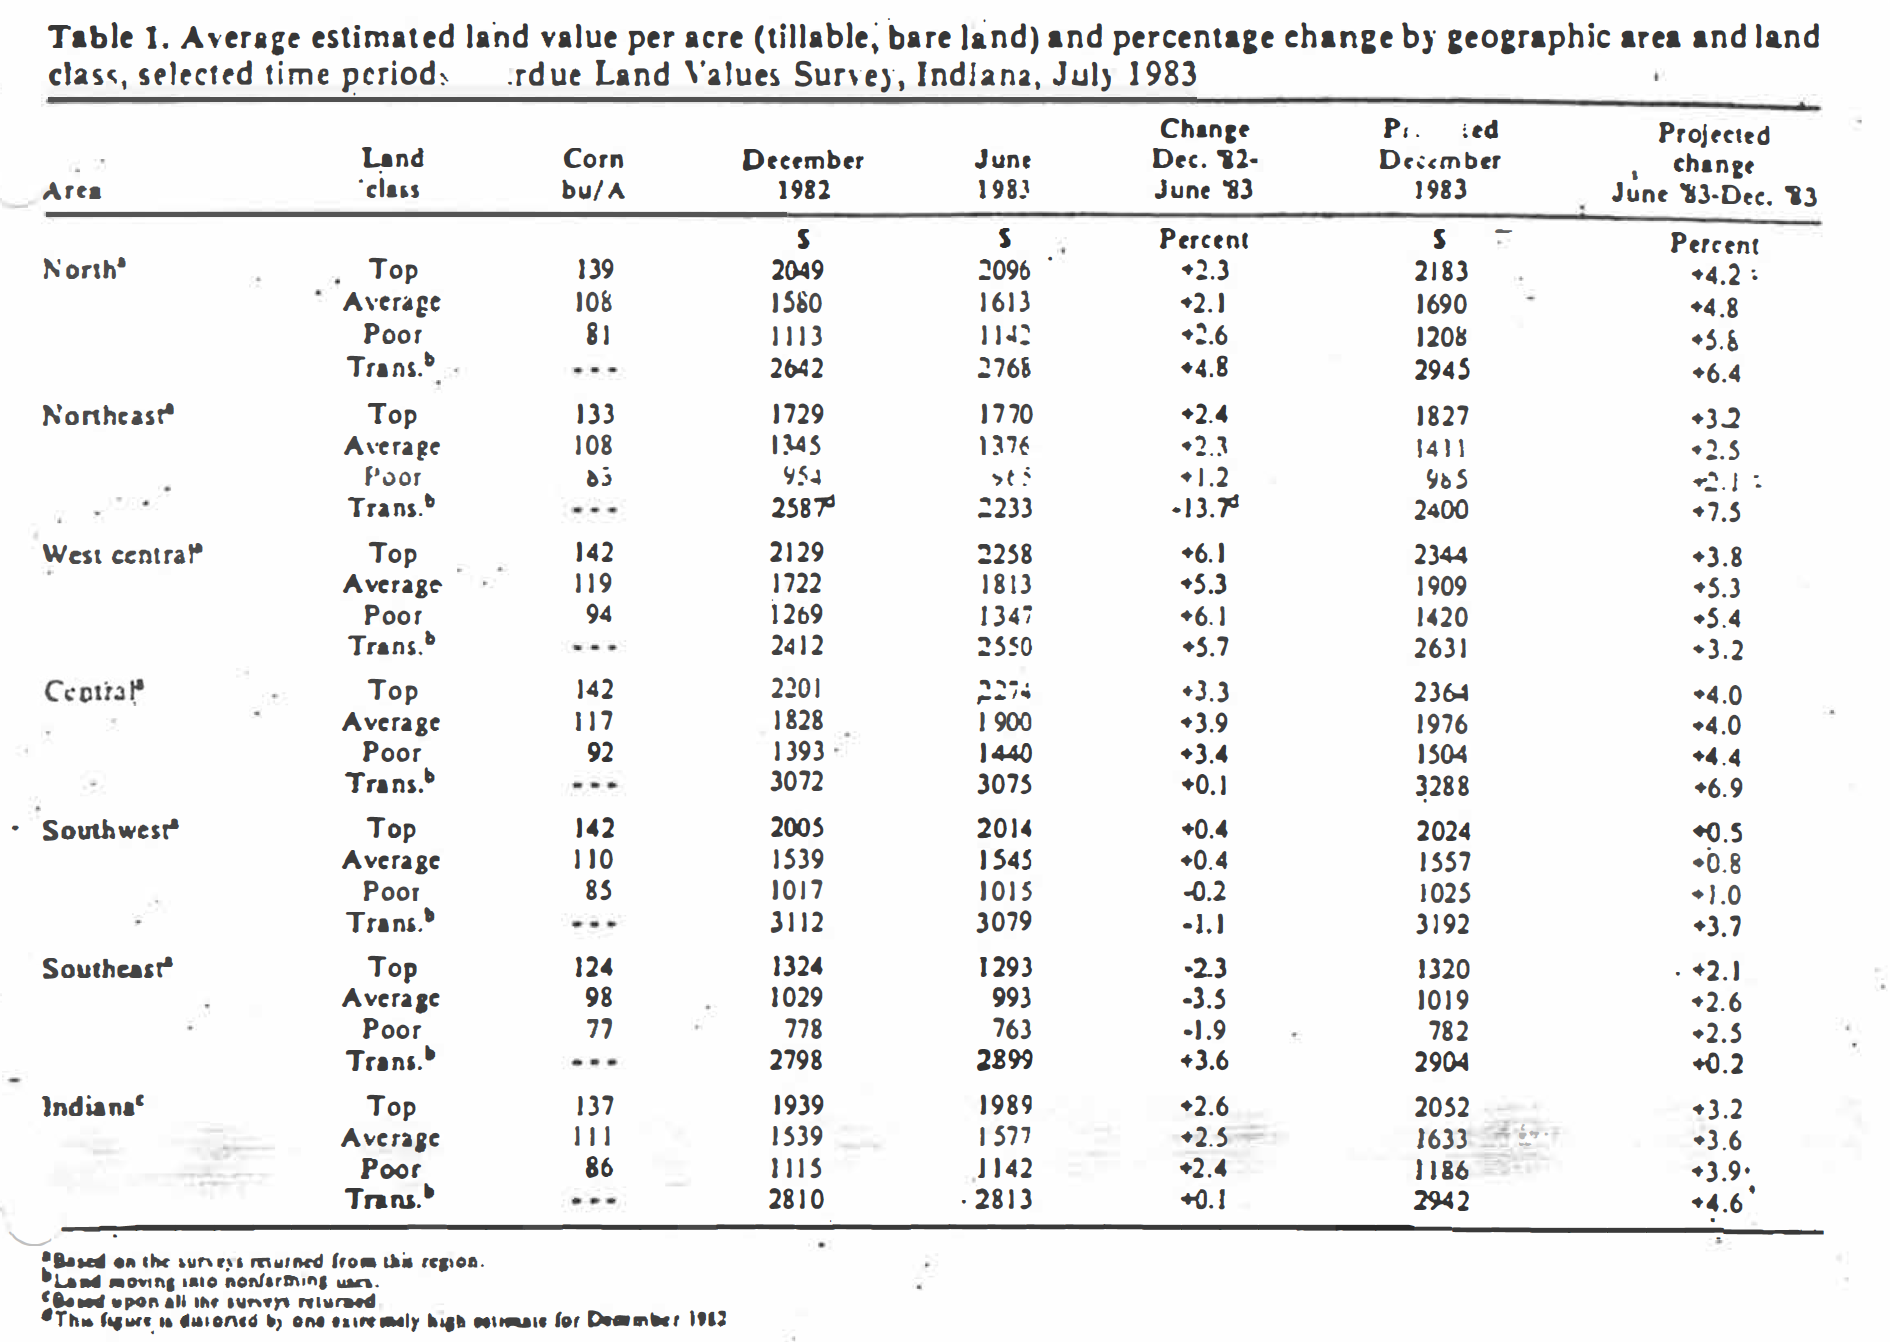
Table 1. Average estimated land value per acre (tillable, bare land) and percentage change by geographic area and land class, selected time periods; Purdue Land Survey, Indiana, July 1983
The increase in land values was not uniform throughout the state. The southwest area showed virtually no change, and the southeast declined 2 to 3 percent. lncreases in the west central area were 5 to 6 percent and 2 to 4 percent in the other areas. The degree of consensus that land values had turned up is indicated by the percentage of responses which showed an increase in some or all classes of land (Table 2). Statewide this figure was 55 percent, just under 40 percent in the south and from about 60 to 70 percent in other areas.
In spite of the lack of recent strength, June 1983 land values in the southeast were only 12 percent below the June 1981 level (average land) and in the southwest, 20 percent. Average land in the other areas was 24 to 26 percent under the June 1981 levels.
There was little evidence that land quality was related to the amount of recent change in estimated values. Last year, the drop in values from December 1981 to June 1982 tended to increase as land quality decreased.
On a year-to-year basis, June 1982 to June 1983, Indiana land values are off 10 percent on top land, 8 percent on average land and 6 percent on poor land (Table 3). The strong recent price recovery in the west central area resulted in annual declines of only 5 to 6 percent. Other areas in the northern part of the-state showed declines mostly in the 5 to 10 percent range. In the south, except for poor land, annual declines were 10 to 15 percent.
Land values per bushel of estimated corn yield declined, because of lower land values compared to a year ago and a 1 to 3-bushel statewide increase in estimated long term yields (Tables I and 4). Increases were reported in most areas for most classes of-land generally in the in the 1 to 3-bushel range. Yield estimates increased 5 to 6 bushels in the west central area on poor and average land. The other exception was the southeast, with no change in top land yields and a 1-bushel decline on average land. Land value per bushel of $14.52 in June 1983 is 25 percent below the $19.41 in 1980. In general, as land quality increased, the value per bushel increased, but in most cases by less than $1.00. Top quality land in the central area was 23 cents. per bushel less than average land, obviously, top land is a better buy. As has been the case for several years, the differences in land values per bushel of estimated yield between average and top land are so small as to suggest that, in general, higher quality land is the better buy.
Cash Rents
There were indications last fall that cash rents would drop in 1983. In fact, some arrangements that were made in the early fall provided for decreased rental rates. But as grain prices improved and the general outcome for farming brightened, rental rates firmed up. The survey showed, statewide, that rents on top and average land declined 1 to 2 percent and increased about 3 percent on poor land (Table 5). ln every area of the state, rents on poor land were stronger than on better land. The greatest declines (3 to 6%) occurred in the two southern areas on top and average land. There was little change on better land in the rest of the state.
Rent per bushel of estimated corn yield declined a few cents and was 85 to 89 cents statewide. The highest rents, both per acre and per bushel, were in the central and west central areas – $135 to $138 per acre and 95 to 97 cents per bushel. In some areas, there was no difference in the rent per bushel on average and top land. The difference in other areas was only a few cents, thus indicating better rental values for the tenant on top quality land.
Rent as a percent of land values rose in all areas and was slightly over 6 percent statewide. The southeast was the highest area, around 7 percent, with the other areas falling in the range of 5.4 to 6.9 percent.
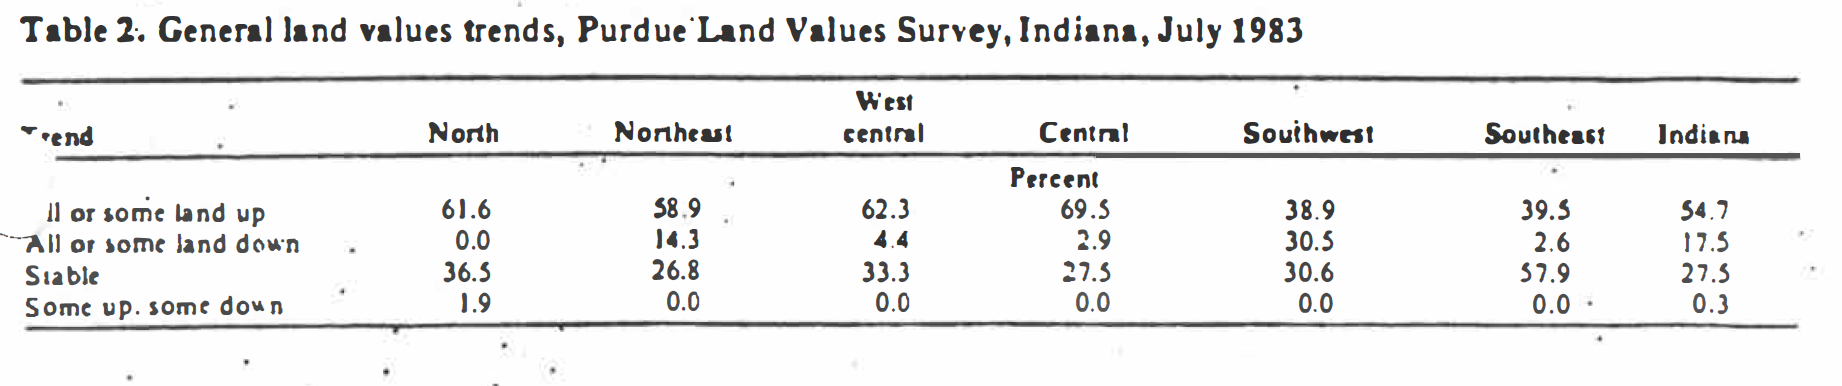
Table 2. General land values trends, Purdue Land Survey, Indiana, July 1983
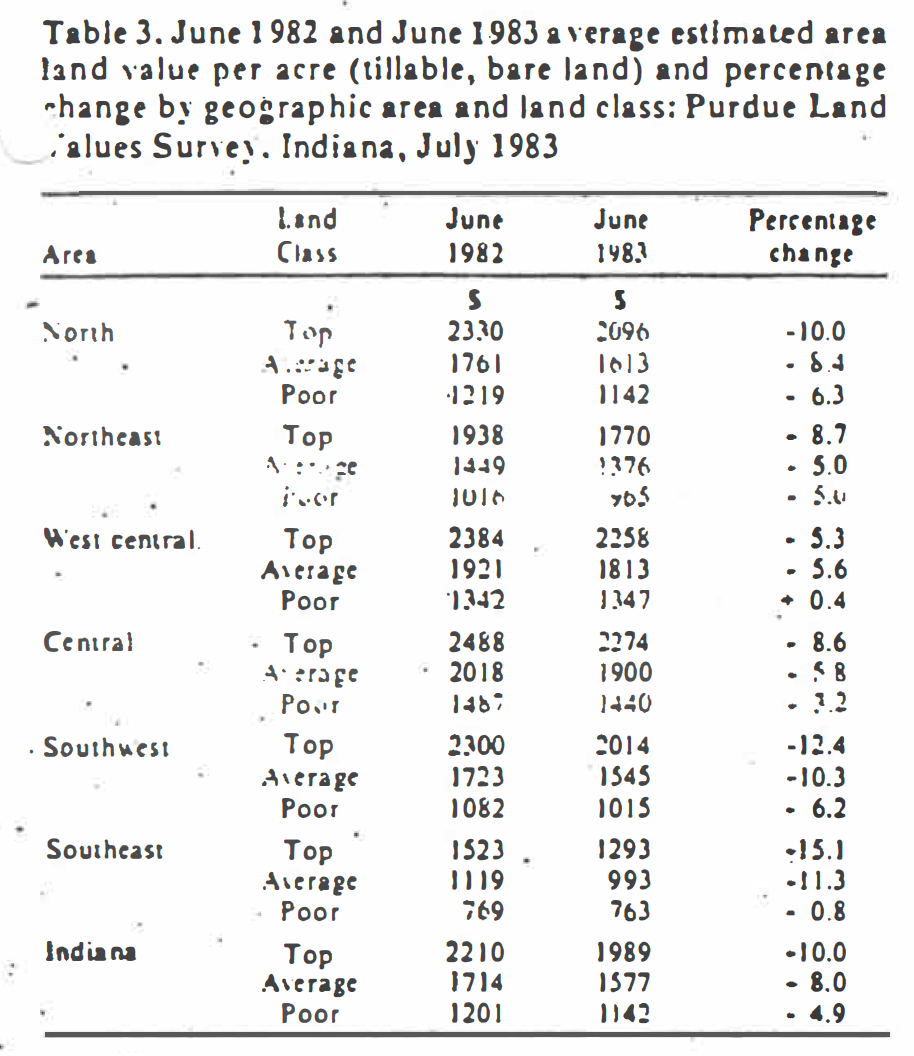
Table 3. June 1982 and June 1983 average estimated area land value per acre (tillable, bare land) and percentage change by geographic area and land class, Purdue Land Survey, July 1983
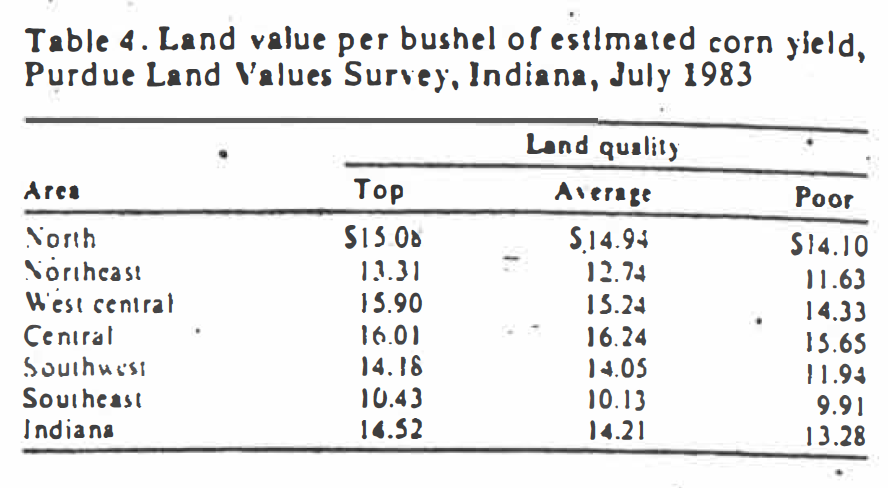
Table 4. Land value per bushel of estimated corn yield, Purdue Land Survey, 1983
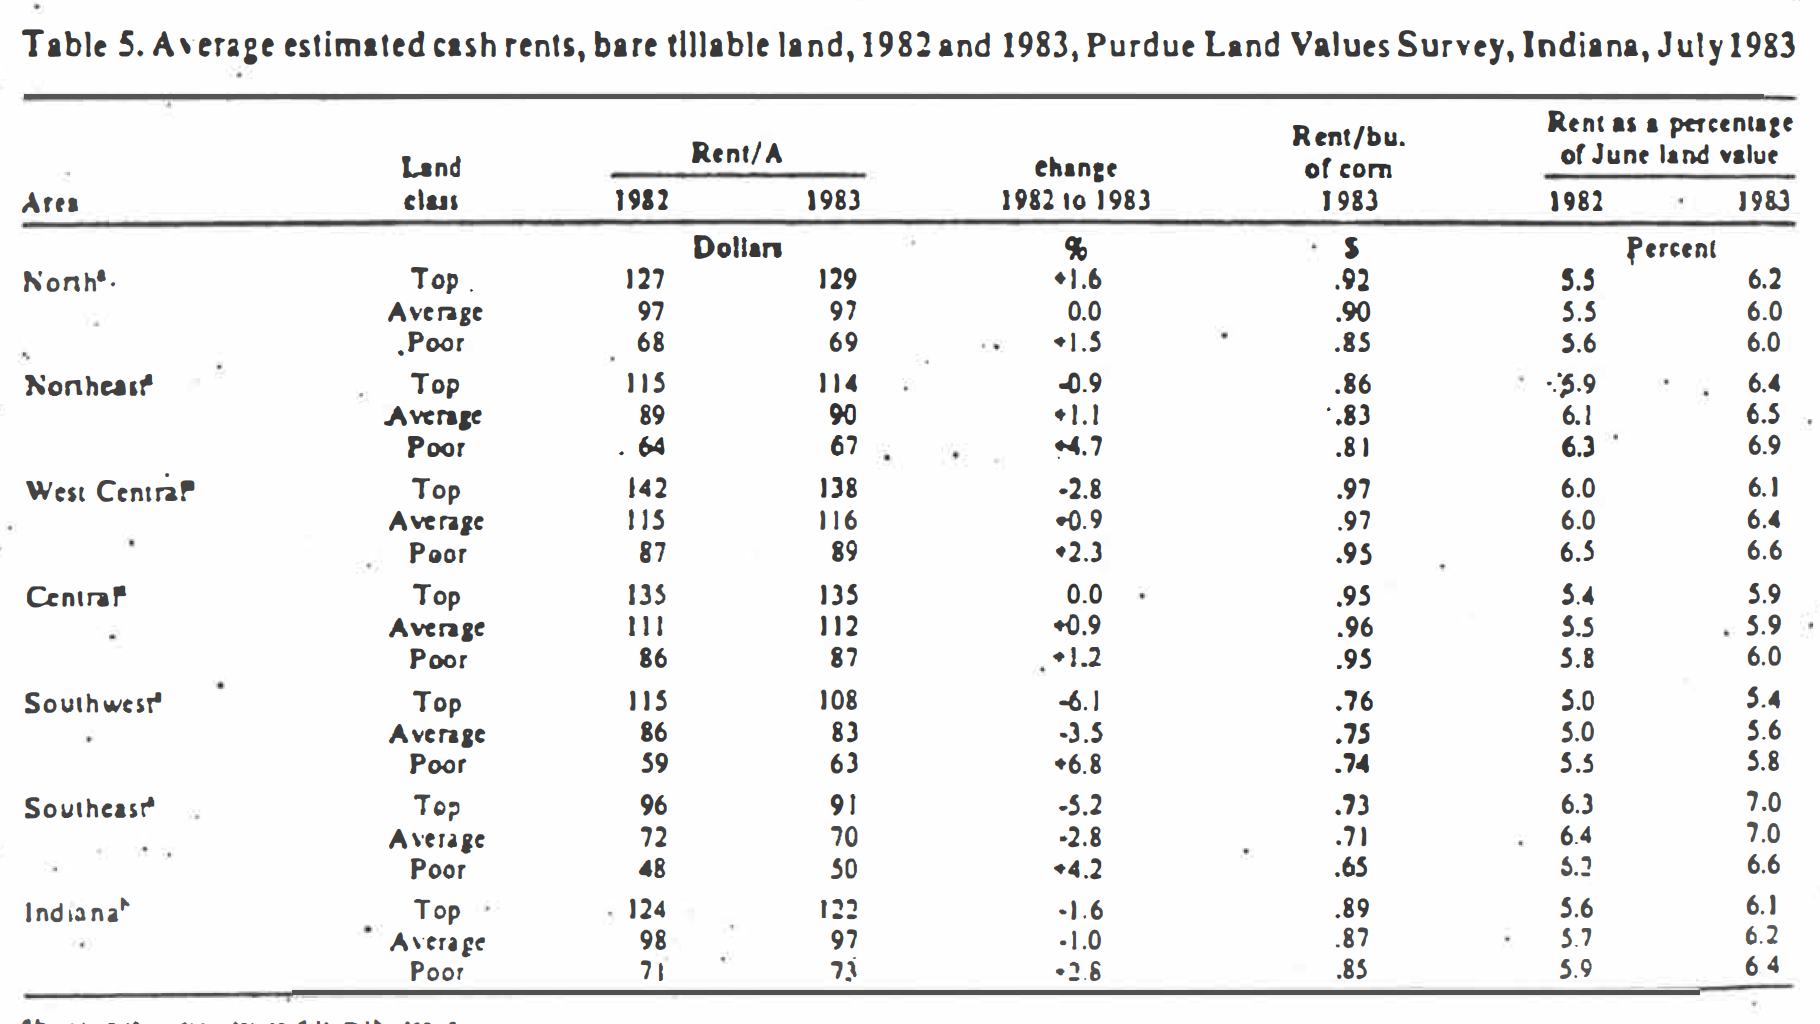
Table 5: Average estimated cash rents, bare tillable land, 1982 and 1983, Land Values Survey, Indiana, July 1983
What of the future?
Survey respondents expect land prices .to increase from June 1983 to December 1983 by about 3 to 4 percent statewide. Expected increases were less in the southern areas and the northeast generally from 1 percent to about 3 percent. Increases of 4 percent, nearly 6 percent were expected in the other areas. Statewide about 60 percent of the respondents expected increases in some or all land classes and just about a third expected stable land prices.
In reply to the question, “Where do you expect land prices to be five years from now?” the responses indicated an average increase of 21 percent or an annual average compound rate of under 4 percent. The group expects inflation to average 6.2 percent per year. Thus, their expectation is that real values of land will decline. The group is optimistic about land values in the short run, but less so in the longer run.
Major factors which will influence land values in the future include the prices of corn and soybeans and farm mortgage interest rates. The averages of survey respondents’ estimates of these factors for the next 5 years were:
Corn – $3.11 per bushel
Soybean – $6.86 per bushel
Farm Mortgage interest rate – 12.4%
These estimates do not appear to be out of line with the estimates of modest increases in land prices; however, the bean price is low relative to the price of corn, based on the long-term relationship between those two prices. The difference between farm mortgage interest rates and the rate of inflation, 6 percentage points, is high by historical standards.
There is much uncertainty with regard to the level of farm product prices and land prices, even in the next 6 to 12-months and much more so over a 5-year period. Events of the present and recent past weigh heavily in our predictions of the future. Many of the respondents, especially the lenders. have been affected by financial problems of farmers the past 2 years, and this may have injected caution into their estimates of future prices. A shortfall in world grain production, a decline in interest rates, a fall in the dollar exchange rate, improved trade relations with the USSR are all factors which could boost grain prices, increase farm earnings and cause land values to rise.
Yet the prudent investor in land (whether-he-already owns it or is considering a purchase) must ask, ‘”What if … ?” Special attention should be given to possible cash flow problems, especially where credit is used. Non-farmer landowners and farmers approaching retirement need to analyze the effects on their financial position and security of stable or declining real land prices. A few operating farmers have recently considered the sale of their land with a long-term lease-back. Others may seek off-farm capital through some form of co-ownership. Still others will hold their land (and many do so easily if there is little debt involved) or make new purchases. But new purchases probably will be made with considerably more caution and more conservative cash flow projections than was case during the 1970’s.
Information produced by this survey can serve as guidelines in making land investment and rental decisions. But the farmer or investor needs to be able to make good estimates of the productivity of individual parcels of land and to obtain local information on prices and rental rates. This takes time and effort. For those not willing or able to devote the time and effort, the services of a local professional appraiser or farm manager may be desirable.
This survey was made possible by the cooperation of professional managers, appraisers, brokers, bankers and persons representing Production Credit Associations, The Federal Land Bank, The Farmers Home Administration and insurance companies. Their daily work makes them the experts on land values and cash rents in Indiana. To these friends of Purdue and Indiana agriculture, sincere thanks are expressed. They provided more than 300 responses representing all but three of Indiana’s counties. Appreciation is also expressed to Kim Cook of the Agricultural Economics Department for his help in compiling the data.
![]()
![]()
![]()
![]()
![]()
