Two Indianas – A Story of Disparate Growth and Opportunity
December 19, 2010
PAER-2010-08
Elizabeth A. Dobis, Graduate Student and Kevin T. McNamara, Professor
![]()
![]()
![]()
![]()
![]()
The American Dream, to have a better life than those who came before us, is possible because of opportunity. A favorable juncture of circumstances,* opportunity can be viewed economically as a combination of employment, income, population, and education. More jobs in a location creates a situation in which there are more opportunities to find a suitable match between employer and employee. Larger incomes allow parents to provide better living environments and educational opportunities for their children. Larger populations allow for more specialized jobs and the growth of cultural activity and diversity. More education results in critical thinking, better employability, and higher income.
Urban and rural America offer very different combinations of these aspects of opportunity and each has, at different points in history, been considered more favorable than the other. More recently, it has been noted that economic growth and opportunity has been concentrated in urban areas. For Indiana, like the rest of the nation, with a combination of urban and rural areas, opportunity varies throughout the state. This article looks at opportunity in Indiana from the perspective of 2003 to 2008 growth. It discusses whether community influences individuals opportunity.
Indiana’s Urban and Rural Character
The US Census Bureau constructs geographic classifications based on population density, economic connections, and spatial patterns. A county’s classification as part of a Metropolitan Statistical Area depends on population as well as having “a high degree of economic and social interaction” with a core urban area.** In this article, Indiana’s 92 counties are divided into urban and rural groups according to whether or not they are included in a 2000 Census Metropolitan Statistical Area. This results in 46 urban counties and 46 rural counties.
Figure 1 below shows the location of urban and rural counties. Urban counties exist in six distinct clusters that are fairly evenly distributed throughout the state, and each is surrounded by a “buffer” of rural counties. These six clusters are around the cities of East Chicago/Gary/South Bend, Fort Wayne, Indianapolis/Terra Haute/Bloomington, Cincinnati, Louisville, and Evansville. The following look at the aspects of opportunity in Indiana divides the state’s counties into two groups, urban counties and rural counties, to obtain a general comparison of employment, income, population, and education between urban and rural communities.***
Aspects of Opportunity in Indiana Employment
In 2008, 2.3 million employees worked in urban counties, and 525 thousand employees worked in rural counties. This totals to slightly more than 2.8 million people employed in Indiana that year. From these figures, the share of employees in urban counties was 81 percent, while 19 percent of those employed in Indiana worked in rural counties. Between 2003 and 2008, urban counties experienced a 1.3 percent growth in employment, while rural counties experienced a 2.2 percent loss of employment. Urban counties also had a larger variation in employment change. The largest negative change in employment, – 27 percent (Elkhart), and the largest positive change in employment, 34 percent (Hendricks), were in urban counties. Additionally, 10 urban counties had an employment change (positive or negative) greater than 10 percent, whereas only four rural counties experienced employment change over 10 percent. The largest grouping of these counties with large changes in employment is around Marion County (Indianapolis).
Income
Total wages and salaries, measured by employers’ location,**** were a little over $107 billion for Indiana in 2008. Those working in urban counties earned almost $90 billion
(84%), and rural county employees earned $17 billion (16%) that year. While both urban and rural counties experienced positive income growth from 2003 to 2008, income growth from wages and salaries was almost twice as large in urban counties (18.5%) than in rural counties (9.4%). Only nine Indiana counties experienced a loss of wages, three urban and six rural. Rural changes in wages ranged from -31 percent (Warren) to 44 percent (Orange). Urban changes were between – 9 percent (Madison) and 88 percent (Newton). The average median income for urban counties was $44,982 in 2003, while rural counties had an average median income of $39,766. Using these values as a base, suggests income in urban areas was 11 percent larger and is growing faster than in rural areas. Wages are not the only important part of community income. The proportion of the population that lives in poverty is also important. While the proportion of the population that lives in poverty was approximately the same in urban and rural counties in 2008 (13% and 12%, respectively), the actual number of people living in poverty in urban counties, 630,609, was greater than in rural counties (168,958). If urban job growth and income growth continue to outpace that in rural communities, poverty may become a bigger rural issue.
Population
In 2008, Indiana’s estimated total population was 6,376,792 residents. This breaks down to 4,989,373 people (78%) living in urban counties and 1,387,419 people (22%) living in rural counties. Urban areas experienced a 4.2 percent growth in population between 2003 and 2008. There was almost no change in population in rural areas (- 0.3%). Once again, urban areas experienced a much larger variation in population growth (between -3.9% in Brown and 22.8% in Hamilton), but a rural county, Blackford (- 4.6%), experienced the greatest loss in population (Figure 2).
Clusters of moderate growth occurred in Northern Indiana and along the border with Kentucky, while a cluster of strong growth occurred in Central Indiana. Additionally, according to the 2008 population estimates by the US Census Bureau depicted in Figure 3, Northern and Central Indiana had the largest populations. Taking into account the population bases and positive growth in urban areas, it makes sense that 78 percent of Indiana’s population was living in urban counties in 2008.
Education
When high school graduates intend to advance their education, it suggests they have both the ability and drive to further their possibilities. Indiana had 63,359 graduates in 2007, and 52,598 (83%) of those intended to move on to further education. When observing student behavior separately in urban and rural counties, the percent of high school graduates intending to go on to higher education was high in both. Despite the fact that 84 percent of high school graduates (40,890) in urban areas intended to go on to further education and only 79 percent of rural high school graduates (11,708) intended to do the same, some rural counties had high rates of intended continued education, such as Union County with a 93 percent rate of furthering education. It is important to note that this is voluntary information and does not take into account those who dropped out of high school. Observing the absolute number of graduates in urban areas (48,453) and in rural areas (14,906), there were three times more graduates from urban counties than from rural counties in 2007. This fits with the fact that the majority of the population in Indiana lives in urban counties.
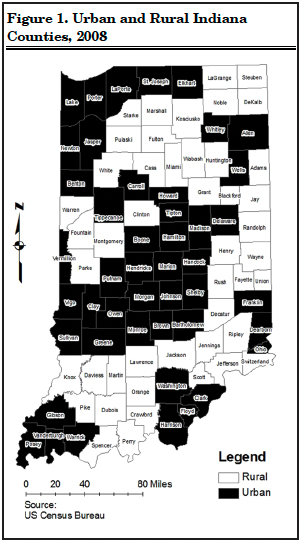
Figure 1. Urban and Rural Indiana Counties, 2008
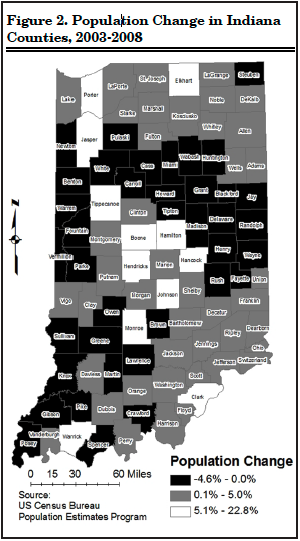
Figure 2. Population Change in Indiana Counties, 2003-2008
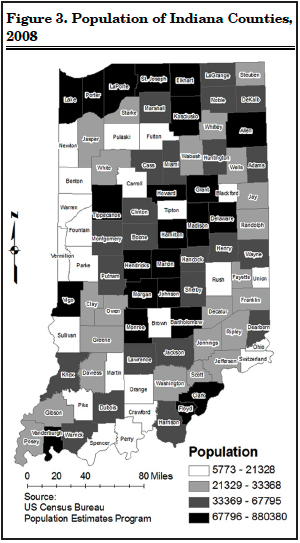
Figure 3. Population of Indiana Counties, 2008
Conclusion
There are numerous characteris-tics of communities associated with opportunity. Employment, income, and population growth all positively influence the opportunity within a community. Large numbers of high school graduates advancing to higher degrees indicates individuals seeking opportunities. Communities desir-ing to attract individuals with higher education levels must have jobs
for those earning post secondary degrees. If communities do not have jobs, these degree earners will seek them elsewhere.
Looking at these four aspects of opportunity, urban counties had larger growth and numbers than rural counties. This suggests that opportunity and opportunity growth are greater in urban areas. If the trend of positive urban job growth and negative rural job growth continues, rural areas might experience difficulty in attracting new residents and retaining their current workforce. While some people may commute from rural areas to nearby urban areas, the trend of jobs shifting from rural to urban areas would suggest con-tinuous urbanization of the state’s population. Interpreting the data this way indicates that there may be two Indianas – one Indiana where a large number of opportunities exist and grow, and another Indiana where there are fewer opportunities and less opportunity for growth.
* Merriam-Webster’s Online Diction-ary. <http://www.merriam-webster.com/dictionary/opportunity>
** United States Census Bureau. American FactFinder Glossary. <http://factfinder.census.gov/home/en/epss/glossary_m.html>
*** Data were obtained from the US Census Bureau’s population estimates program (population), the US Census Bureau’s small area estimates branch
(poverty), the US Bureau of Labor Statis-tics’ Quarterly Census of Employment and Wages (income and employment), and the Indiana Department of Education (education, from StatsIndiana).
![]()
![]()
![]()
![]()
![]()
