U.S. Farmers Respond to Changing Crop Demands
May 24, 2013
PAER-2013-03
Chris Hurt, Professor
![]()
![]()
![]()
![]()
![]()
U.S. farmers have been adjusting to some dramatic changes in the past eight years. Key among the drivers has been the massive increase in the demand for corn to produce ethanol, and the rapid increase in exports of soybeans to China. These changes in crop demands have caused farmers to alter the way land resources have been used in the U.S.
The 2005 crop was the last of excess supplies and low prices. That year, the average U.S. farm price received for corn was $2.00 a bushel. But, low prices had been the norm from 1998 to 2005 with prices over that extended time averaging just $2.05 per bushel. In the most recent 7 crop years, 2006 to 2012, the average farm price has been $4.74 with the highest being $6.90 for the drought-reduced 2012 crop. The increases in demand for corn and soybeans drove prices and returns higher and farmers followed these incentives by planting more of each crop.
In farming communities there is a common statement that, “land is a great investment because they are not making any more of it.” The inability to increase land supply for crops however is not entirely true as land moves in, and out of the crop base. USDA acreage records date back nearly 150 years for crops such as corn, wheat, oats, rye and cotton and demonstrate patterns of shifting land use as supply and demand factors for various crops shift over long periods of time.
There are many forces that impact the amount of U.S. land that is in production such as urbanization. But, two important forces in recent years have been the relative prices and costs of alternatives crops and U.S. federal government programs that are designed to impact land use.
There are three ways production of a given crop can be increased. The first is by substitution of a lower return crop for a higher return crop. The second is by adding more land to the production base. The third is by increased intensification of production commonly called increased productivity or increased output per acre. This article will focus on the first two.
Transitions From 2005 to 2013
How has substitution impacted the allocation of land to various U.S. crops? Figure 1 provides this information for nine crops that have had sizeable acreage shifts since 2005. As expected, U.S. farmers responded to the new demands for corn to be used in ethanol production by increasing corn acreage by 15.5 million acres since 2005. They also responded to the new Chinese demands for soybeans by increasing soybean acreage by 5.1 million acres. So nearly 21 million added acres were planted to corn and soybeans during this transition.
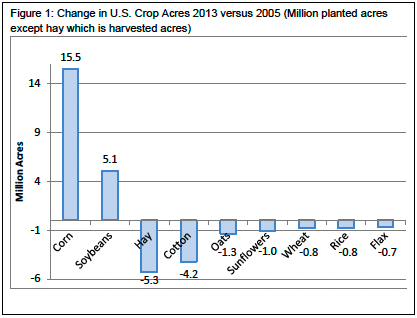
Figure 1: Change in U.S. Crop Acres 2013 versus 2005 (Million planted acres except hay which is harvested acres)
Where did U.S. farmers get 21 million acres of land for this expansion of corn and soybeans? Here we highlight 7 crops that farmers substituted out of. The largest of those crops has been hay acreage which had a 5.3 million acre reduction since 2005. Cotton is the second largest substitution crop representing a 4.2 million acre reduction. As shown in Figure 1, farmers have also reduced by around one million acres each of the following crops: oats, sunflowers, wheat, rice, and flax.
As land is shifted out of a crop, there tends to be a reduction of supply for that crop and prices have tended to rise for that crop. Through this process of land substitution, increased demands for corn and soybeans have tended to also increase the prices for alternative crops that compete for the same lands. For some of these crops the reduction has been a large portion of that crops production base. U.S. flax acreage, as the most extreme example, has been reduced by 72%. Oats and cotton have each had about a 30% reduction in acreage since 2005 and rice acreage has been down 23%. Clearly acreage reductions of these magnitudes have not only sharply increased U.S. prices for those crops, but have also reduced the need for marketing and processing services such as cotton ginning and specialized machinery such as cotton harvesters.
The acreage impacts extend beyond row crops as well. Harvested hay acreage has dropped by 9% since 2005. This has been an important factor in increasing the prices of hay and increasing costs for the beef and dairy cattle industries. In addition, the high demand corn and soybean crops were also competitive with pasture land. From 2005 to 2012 the USDA suggests the value of U.S. pastureland rose by 55%. Of course it is well understood that drought has also greatly contributed to reduced supply and higher hay prices and higher pasture rents in recent years as well.
Substitution of land still does not explain all of the increased national acreage. In addition, about 6 to 8 million acres have been added to the production base. The primary source of these added acres are due to reductions in the Conservation Reserve Program (CRP) which is a federal government conservation program in which farmers receive payments to keep highly fragile crop lands out of production for a contract period of 10 years.
Since 2005, the number of acres in the CRP has decreased by 7.9 million acres and by nearly 10 million acres since its peak in 2007 see Figure 2. It is likely that much of the land taken out of the CRP has gone directly into crop production, but some has gone into pasture or recreational use. Seven million acres are scheduled to expire in the next three years (2013-3.3 million; 2014-2.0 million; and 2015-1.7 million). However, there will likely be some of this amount that moves back into the CRP in future sign-up periods. Thus, the net reduction in acres will be less than seven million.
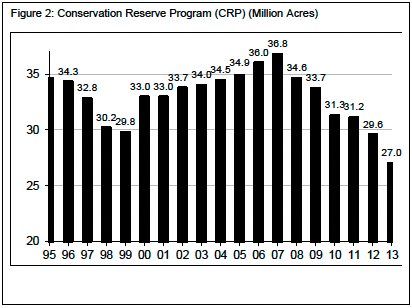
Figure 2: Conservation Reserve Program (CRP) (Million Acres)
A final way that acres have increased is through increased double-crop acres which are mostly winter wheat double-cropped to soybeans. High prices for both wheat and soybeans have encouraged more double-cropping in which an acre is double-counted as both a wheat acre and a soybean acre. Double-crop wheat and soybean acres rose from 4% of soybean acres in 2005 to 7% in 2012, representing about 2 million additional acres.
Where Have the Acres Changed?
Acreage shifts and acreage expansions have varied by region of the country. Acreage changes are going on throughout the country but are of greatest magnitude in the Northern Plains (North Dakota, South Dakota, Montana and Wyoming). Corn area (mostly the Dakotas) increased by 4.2 million acres since 2005 with soybean acreage increasing by 2.7 million acres, or 6.8 million acres for the two crops. There have been three sources of those greater acres: substitution from wheat (-2.3 million); substitution from hay (-2.0 million acres); and increased acres from the CRP where an astounding 3.5 million acres have exited the program since 2005. Regional data for the country is detailed in Table 1.
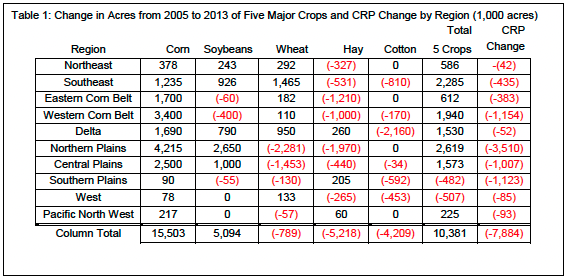
Table 1: Change in Acres from 2005 to 2013 of Five Major Crops and CRP Change by Region (1,000 acres)
The second largest region of expansion of corn and soybeans has been in the Central Plains (Nebraska, Kansas, and Colorado) where 3.5 million acres of those two crops have been added since 2005. Substitution acres came primarily from wheat (-1.5 million), plus a reduction of 1 million acres in the CRP. The Western Corn Belt (Minnesota, Iowa, and Missouri) increased corn acres by 3.4 million since 2005 as a result of substitution of hay (-1 million acres), and soybeans (-400,000 acres), a decrease of 1.2 million acres in CRP, and more double-crop beans and less cotton in Missouri.
Finally, the Eastern Corn Belt (Illinois, Indiana, Ohio, Wisconsin, and Michigan) increased corn area by 1.7 million acres and that came primarily from substitution of hay acres (1.2 million) plus a 383,000 acre reduction in the CRP and some increase in wheat/soybean double-crop acres.
Summary
The U.S. crop base changes over time both in the composition of crops that are produced and somewhat by the overall size of the crop base. Large increases since 2005 in the demand for corn for ethanol has been the primary reason farmers shifted nearly 16 million additional acres into corn production. At the same time rising soybean exports to China resulted in 5 million additional acres of soybeans. Thus, U.S. corn and soybean acreage has expanded by nearly 21 million acres since 2005. These large new demands have been a primary contributor to higher crop prices and higher land values
The most significant way this additional 21 million acres could be accommodated was due to substituting acres from other crops accounting for about 14 million acres. The largest crop substitutions came from hay and cotton acres with smaller contributions from a host of other crops. As acres were reduced in these other crops, their prices rose as well. Thus, increased demand for corn and soybeans has tended to also enhanced prices for all crops that compete for corn and soybean land. This clearly includes many crops, as well as hay and pasture lands.
A second way the large increase in area for corn and soybeans has been accommodated is through increased crop area which has accounted for six to eight million added acres since 2005. The most important way the U.S crop base has been expanded is due to reductions in the federal government Conservation Reserve Program (CRP). The CRP has been reduced by nearly 8 million acres since 2005 as landowners allowed their contracts to expire, often for the opportunity to return those lands to crop production. The vast majority of this returning crop production land is located in the regions of the Great Plains and the Western Corn Belt (86% of the national total). An additional 7 million acres is scheduled to expire in the next three years and a portion of that is expected to add further to the nation’s crop base.
Double-cropping has added about 2 million acres to the crop base since 2005. This is primarily winter wheat double-cropped to soybeans. Each acre is counted as both a wheat acre and a soybean acre.
How were U.S. farmers able to find 21 million more acres for corn and soybeans since 2005? The answer is that about 2/3rds was due to substitution from lower return crops and about 1/3 was from expansion of the national crop base.
![]()
![]()
![]()
![]()
![]()
