Up Again: Indiana’s Farmland Market in 2013
August 1, 2013
PAER-2013-04
Craig Dobbins, Professor; Kim Cook, Research Assistant
![]()
![]()
![]()
![]()
![]()
While the 2012 Indiana crop suffered from the worst drought since 1988, the increase in farmland values did not bother to slow down. The drought-reduced corn and soybean supply lifted corn and soybean prices to all-time highs. The price increases more than offset lower yields. When insurance indemnities are included, farm income from the 2012 crops was much better than many expected. The 2013 U.S. net farm income is currently forecast to be $128.2 billion, the highest on record.
High net farm income combined with favorable interest rates, strong farmland demand, and a limited supply of farmland for sale pushed farmland values and cash rents higher. The June 2013 Purdue Farmland Value Survey1 indicates the statewide increase in farmland values ranged from 14.7% to 19.1% depending on the productivity of the farmland. Statewide cash rents increases ranged from 9.4% to 10.9%.
For the state as a whole, the largest change from 2012 to 2013 was top land, increasing 19.1% to $9,177 per acre. Average quality cropland increased 17.1% to a value of $7,446 per acre. Poor quality land increased 14.7 % to a value of $5,750 per acre (Table 1).
To assess farmland productivity, survey respondents estimated long-term corn yields for poor, average, and top quality land. For the state, the average long-term corn yields for poor, average, and top quality land were 127, 160, and 193 bushels per acre, respectively.
The transitional land market, that is farmland moving out of agriculture, seems to have sprung back to life. The survey indicated a 24.4% increase in its average value, increasing from $8,505 to $10,581 per acre. This is a specialized market with transitional land value strongly influenced by the planned use and location. The estimated values from June 2013 respondents had a very wide range from $2,500 to $45,000 per acre. Because of the wide variation in transitional land values, the median value2 may give a more meaningful picture than the arithmetic average. The median value of transitional land in June 2013 was $9,500 per acre, $1,500 per acre more than in 2012.
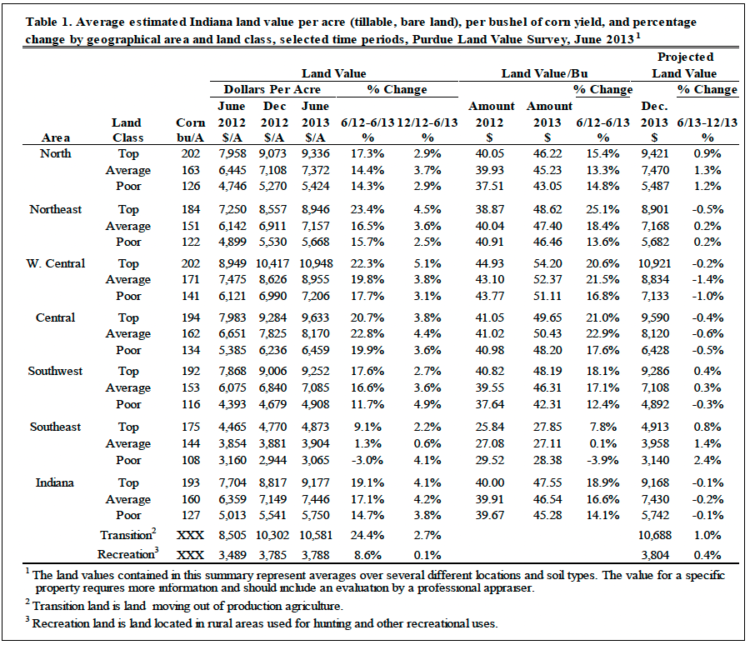
Table 1. Average estimated Indiana land value per acre (tillable, bare land), per bushel of corn yield, and percentage change by geographical area and land class, selected time periods, Purdue Land Value Survey, June 2013
The June 2013 state-wide average value of rural recreational land, land used for hunting and other recreational activities, was $3,788 per acre, an increase of 8.6% when compared to June 2012. As with transitional land, there is a wide range of values for rural recreational land, again making the median value a more meaningful indictor than the arithmetic average. The median value for rural recreational land in June 2013 was $3,150 per acre, the same as 2012.
State-wide Rents
For the second year there were also strong increases in cash rent. The largest increase in 2013 was for top quality land, up $29 per acre, or 10.9%. Rents for average and poor quality land increased $21 (10.1%) and $15 (9.4%) per acre, respectively. The estimated cash rent was $294 per acre on top quality land, $229 per acre on average quality land, and $174 per acre on poor quality land (Table 2). These cash rent estimates represent gross rent. To arrive at a net return for the landowner, expenses such as real estate taxes, drainage assessments, insurance and other maintenance expenses need to be subtracted. Cash rent per bushel of corn ranged from $1.37 to $1.52 per bushel.
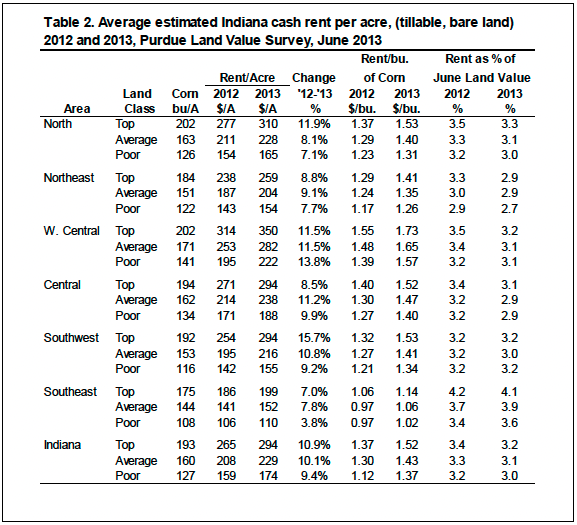
Table 2. Average estimated Indiana cash rent per acre, (tillable, bare land) 2012 and 2013, Purdue Land Value Survey, June 2013
For top quality farmland, cash rent as a percentage of farmland value was 3.2%. This was 0.2% below the 2012 level. For average and poor quality farmland, cash rent as a percentage of farmland value was 3.1% and 3.0 %, respectively. These percentages also declined 0.2%. These percentage values are the lowest in the 39-year history of the survey. Over the entire 39-year period cash rent as a percentage of farmland value has averaged 5.5%.
Area Land Values
Survey responses were organized into six geographic regions (Figure 1). As in the past, there are geographic differences. This year, changes in farmland values were similar in the North, Northeast, West Central, Central, and Southwest regions. (Table 1).
The West Central region continues to have the highest per acre farmland values. The value for top, average, and poor quality farmland was $10,948, $8,955, and $7,206 per acre, respectively. The lowest farmland values are in the Southeast where top, average and poor quality farmland have values of $4,873, $3,904, and $3,065 per acre, respectively. The value of poor quality farmland in the southeast was a decline from the value in 2012. This is the first decline in cropland value since 2009.
Land value per bushel of estimated long-term corn yield (land value divided by bushels) is the highest in the West Central region, ranging from $51.11 to $54.20 per bushel. The per bushel values for the North, Northeast, Central, and Southwest are quite similar, ranging from $42.31 to $50.43. The lowest per bushel values are in the Southeast, ranging from $27.11 to $28.38 per bushel.
Area Cash Rents
The largest percentage increase in cash rent was for top quality land in Southwest Indiana, increasing 15.7% (Table 2). Across all three land qualities cash rent increases in West Central and Southwest Indiana were the strongest, increasing from 9.2% to 15.7%. The Southeast had the smallest percent changes, ranging from 3.8% to 7.8%.
The highest per acre cash rent is $350 per acre for top quality land in the West Central region. Rents across land qualities in this region ranged from $222 to $350 per acre. This region has the strongest cash rents in the state for each land quality. Cash rents continue to be the lowest in the Southeast for each land quality in the state ranging from $110 to $199 per acre.
Differences in productivity have a strong influence on per acre rents. To adjust for productivity differences, cash rent per acre was divided by the estimated long-term corn yield. Rent per bushel of corn yield in the West Central region ranged from $1.57 to $1.73. Cash rent per bushel of corn yield in the North, Northeast, Central, and Southwest regions ranged from $1.26 to $1.53 per bushel. Per bushel cash rent in the Southeast ranged from $1.02 to $1.14 per bushel. This is the first year that per bushel rents for all regions and qualities was greater than a $1.00 per bushel.
Range of Responses
Tables 1 and 2 provide information about the averages of the survey responses. Averages are helpful in establishing a general value for farmland and cash rent and the direction in which values and rents are moving across time. However, it is important to remember that an average is developed from several responses about perceived value and cash rent. In some cases, responses are closely clustered around the average and the range of survey responses will be narrow. In other cases, the responses are widely dispersed. It is possible to have the same or nearly the same average with either type of dispersion. Figure 2 illustrates these properties for farmland values in the 2013 survey results. The top of the dark line is the average plus one standard deviation. The bottom of the dark line indicates the average minus one standard deviation. If farmland values are normally distributed, 66% of the values fall between the bottom and top value of the line.
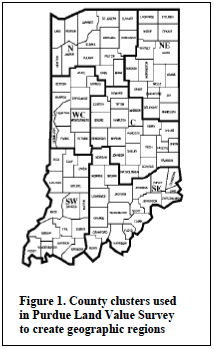
Figure 1. County clusters used in Purdue Land Value Survey to create geographic regions
Figure 3 illustrates the same information for cash rents. In both the case of farmland value and cash rent, the survey provides a general guide to value or rent but does not indicate a farmland value or cash rent for a specific farm. There is wide dispersion which means there are wide differences of opinion on values. Arriving at a land value or amount of cash rent for a specific farm requires additional research or assistance from a professional.
Rural Home Sites
Respondents were asked to estimate the value of rural home sites located on a blacktop or well-maintained gravel road with no accessible gas line or city utilities. These properties have a very wide range in value. Because of this wide range, median values (the value at the midpoint of the range) are use as a measure of value. The median value for five-acre home sites ranged from $6,000 to $12,000 per acre (Table 3). Estimated per acre median values of the larger tracts (10 acres) ranged from $7,000 to $10,000 per acre.
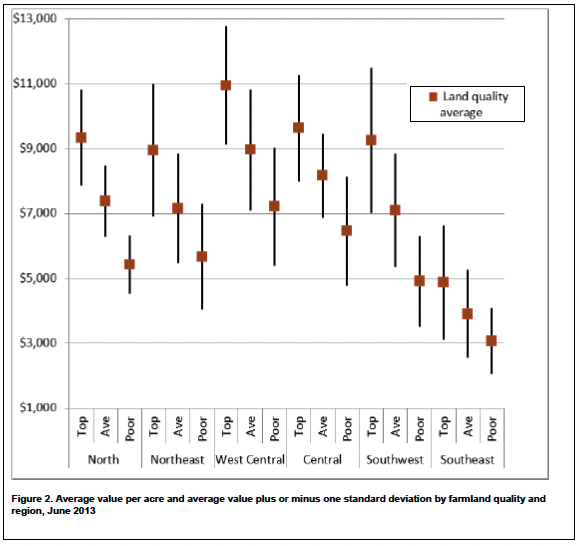
Figure 2. Average value per acre and average value plus or minus one standard deviation by farmland quality and region, June 2013
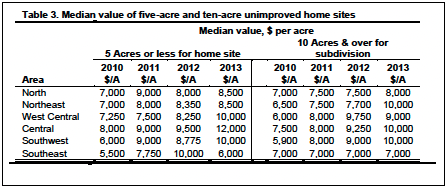
Table 3. Median value of five-acre and ten-acre unimproved home sites
For 2013, the home site data indicate that for many of the regions the value of rural housing sites increased. Values in most regions except the southeast exhibited strong increases. This is the second year of strong increases in rural home site values for some regions.
Expected Grain Prices, Interest Rates, and Inflation
Market conditions and expectations about the future have a strong influence on farmland values. To obtain information about their future expectations in June of 2013, survey respondents were asked to provide an estimate of the average corn and soybean price for the period 2013 to 2017. This year, survey respondents reported an estimated five-year average corn price of $5.52 per bushel, a decline of $.04 from last year (Table 4). The estimated five-year soybean price was $12.16 per bushel, an increase of $0.12 over last year’s estimate. If these prices were to be realized and production costs for corn and soybeans do not rapidly increase, then returns from crop production would remain strong into future years.
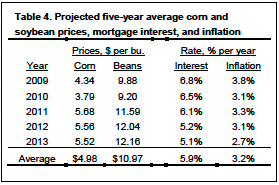
Table 4. Projected five-year average corn and soybean prices, mortgage interest, and inflation
However, price expectations can change quickly. At the time of this writing in early August 2013, futures prices for the 2013 to 2016 crops have fallen from where they were in June when the survey was completed. Respondents’ opinions might be different today, but we do not have that information.
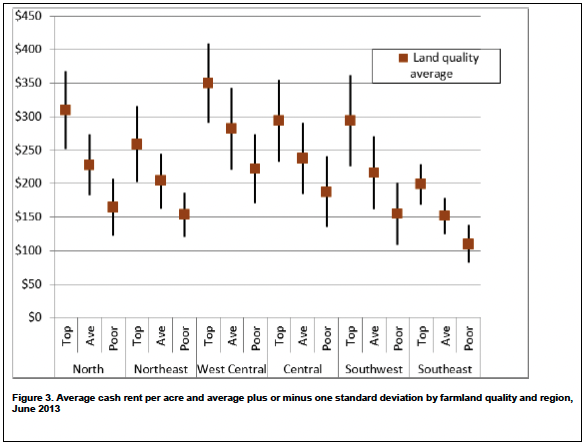
Figure 3. Average cash rent per acre and average plus or minus one standard deviation by farmland quality and region,
June 2013
Interest rates have important implications for real estate markets. As interest rates decline, the price of real estate tends to increase. There has been a general decline in interest rates for the past 30 years. Many now expect interest rates to generally rise in coming years. Interest rates have reached a level where there seems to be little possibility of further declines. The Federal Reserve Bank Chairman has also indicated that the Federal Reserve Bank is likely to reduce the amount of monetary stimulus it has been providing to the economy sometime in 2014. However survey respondents’ expectations were at odds with this rising interest rate outlook. They expect long-term interest rates to stay low over the next five years. In fact dropping by 10 basis points (0.1%) below the survey expectations in 2012.
Inflation does not seem to be a worry this year. The expected inflation rate for the next five years continued to decline. On average, survey respondents estimate annual inflation over the next five years will be 2.7%. Since 2009, expectations about annual long-term inflation have declined by 1.1%.
Market Influences
Expectations in June about corn and soybean prices, interest rates and inflation were all pointed in a positive direction for future farmland values. To identify how these and other forces may be influencing the farmland market, survey respondents were asked to assess the influence of 11 different items. These items included: 1) current net farm income, 2) expected growth in returns to land, 3) crop price level and outlook, 4) livestock price level and outlook, 5) current and expected interest rates, 6) returns on competing investments, 7) outlook for U.S. agricultural export sales, 8) the U.S. inflation rate, 9) the current inventory of land for sale, 10) the cash liquidity of buyers, and 11) current U.S. agricultural policy.
Respondents used a scale from -5 to +5 to indicate the effect of each item on farmland values. A negative influence is given a value from -1 to -5, with a -5 representing the strongest negative influence. A positive influence was indicated by assigning a value between 1 and 5, with 5 representing the strongest. An average for each item was calculated.
In order to provide a perspective on the changes in these influences, data from 2011, 2012, and 2013 are presented in Figure 4. The horizontal axis indicates the item from the list above. It comes as no surprise that current net farm income, the expected growth in returns, and crop prices are positive forces. However the importance of crop prices has been declining for the past two years. This is a reflection that the period of strong crop prices may be ending. This same thought was influencing respondents in 2012, but the drought sent prices sharply higher.
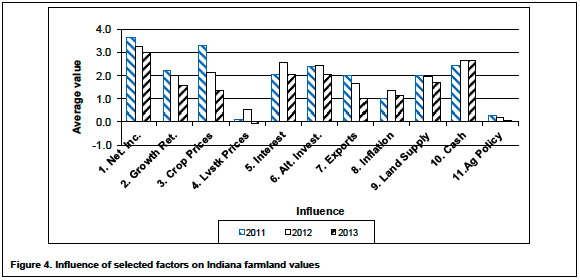
Figure 4. Influence of selected factors on Indiana farmland values
Interest rates, the return from alternative investments, supply of land on the market, and the cash position of buyers continue to be important influences in the farmland market. Livestock price level and outlook and current U.S. agricultural policy were perceived to have little influence.
All items, except for livestock prices, are perceived to have a positive influence on farmland prices, but in all cases this positive influence was less than last year.
Land Values to Stop Increasing
Survey respondents see the growth rate in farmland values slowing considerably and in some regions making slight downward corrections. Given the uncertainty about the level of grain prices, it is not surprising that respondents would be cautious about changes in farmland values. On a state-wide basis, Table 1 indicates that for the period from June to December 2013, survey respondents expect the increase in farmland values to stop. The regional averages indicate respondents in all regions are expecting farmland value growth to slow significantly. For the Northeast, West Central, Central, and Southwest regions respondents suggest small declines in farmland values by December 2013.
Respondents also projected farmland values five years from now. Forty-three percent of the respondents expect farmland values to be higher. The average increase for this group was 11.7 %. This translates into an average annual increase of 2.2%. Thirty-five percent expect farmland values to decline. The average decline for this group was 12.3%, an annual decline of 2.3%. This leaves 22% of the respondents that do not expect any change in land values five years from now. Given the large increase in farmland values for the past five years, steady values or a decline in value will be a significant change in the trend.
Concluding Comment
The drought of 2012 did little to slow the increases in farmland values and cash rent. From June of 2012 to June 2013, state-wide farmland values increased 14.7% to 19.1% and state-wide cash rents increased 9.4% to 10.9%. While wet spring weather resulted in the 2013 crop season getting off to a slow start, events since are pointing towards a large crop. The downward trend in corn and soybeans prices for the 2013 crop indicate the market is becoming less and less concerned about the short supply of corn and soybeans. Will 2013 be like 2009 with a sharp decline in corn and soybean prices and rapidly eroding margins?
While the 2013 survey reported another strong double-digit increase in farmland values, there is increasing evidence in the survey that the run of strong increases may be nearing their end.
-
- In many areas of the state, respondents expect the increase in farmland values for the last half of the year to be less than 1% or a small decline. Exceptions to this are the Northeast and Southeast region.
- Increasing returns to land and crop prices are becoming less important as contributors to farmland values. The other factors influencing farmland values are also weaker than last year.
- 57% of the respondents expect that in five years farmland values will be the same or less than they are now. Respondents with a more optimistic view (43% of the respondents) expect an average annual increase of just 2.2%. Over the last 5 years the annual increase in Indiana farmland values averaged about 12% annually.
Purdue Land Value and Cash Rent Survey
The Purdue Land Value and Cash Rent Survey is conducted each June. The survey is possible through the cooperation of numerous professionals knowledgeable of Indiana’s farmland market. These professionals include farm managers, appraisers, land brokers, agricultural loan officers, Purdue Extension Educators, farmers, and persons representing the Farm Credit System, the Farm Service Agency (FSA) county offices, and insurance companies. Their daily work requires them to stay well informed about land values and cash rents in Indiana.
These professionals provided an estimate of the market value for bare poor, average, and top quality farmland in December 2012, June 2013, and a forecast value for December 2013. They also provided an estimate of the current cash rent for each farmland quality. To assess the productivity of the land, respondents provided an estimate of long-term corn yields. Respondents also provided a market value estimate for land transitioning out of agriculture and recreational land.
Responses from 261 professionals are contained in this year’s survey representing all but nine Indiana counties. There were 45 responses from the North region, 38 responses from the Northeast region, 54 responses from the W. Central region, 67 responses from the Central region, 29 responses from the Southwest region, and 28 responses from the Southeast region. Figure 1 illustrates the counties in each region.
Appraisers accounted for 17% of the responses, farm loan professionals represented 56% of the responses, farm managers and farm operators provided 16% of the responses, and other professionals provided 11% of the responses.
We express a special appreciation to the support staff of the Department of Agricultural Economics. Tracy Bowerman coordinated survey mailings and handled data entry. Without her assistance and the help of others the survey would not have happened.
The data reported here provide general guidelines regarding farmland values and cash rent. To obtain a more precise value for an individual tract, contact a professional appraiser or farm manager that has a good understanding of the local situation.
![]()
![]()
![]()
![]()
![]()
