USDA: 2013 Cropland Value by State
August 24, 2013
PAER-2013-06
Unattributed
![]()
![]()
![]()
![]()
![]()
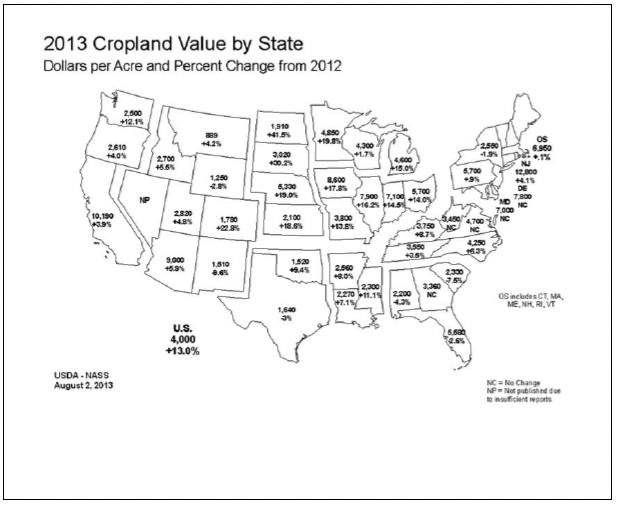
2013 Cropland Value by State: Dollars per Acre and Percent Change from 2012
USDA completes a survey of cropland values each year in June that is released in August. The map above provides their estimates for cropland values in each state and the percentage changes from 2012. These vary somewhat from the Purdue survey because the Purdue survey is more detailed and precise in defining the quality of land being evaluated.
This map provides a broader geographic perspective across the country. Some of those broader observations are that Indiana has the third highest cropland values in the Midwest after Iowa and Illinois. For these lower 48 states, cropland values rose the most in the Midwest. The states in the western side of the Corn Belt generally had greater percentage increases than the eastern side of the Corn Belt in the past year. Cropland values in some states were unchanged or down in the past year, most notably in the Southeastern and Northeastern U.S
![]()
![]()
![]()
![]()
![]()
