Visualizing the Indiana Farmland and Cash Rent Adjustments
August 16, 2017
PAER-2017-11
Authors: Chris Hurt, Professor of Agricultural Economics and Craig Dobbins, Professor of Agricultural Economics
![]()
![]()
![]()
![]()
![]()
Results from the Purdue Farmland Value Survey is the most anticipated PAER article of the year. In this year’s article you catch the themes of “continued adjustments” and “multiple years of decline in land values and rents.”
Boom and bust, or boom and moderation cycles occur over a series of years when there is a major change in the structure of supply or demand. Major booms in grain prices are generally caused by unexpected surges in demand over a series of years. Higher grain prices increase farm returns which in turn stimulate higher land values, rents, and other input prices. Over time, global supply expands to fully meet the surge in demand. Then, the rate of growth in the demand surge slows, or demand declines. This results in a series of years with supply outpacing demand with grain prices moderating and input costs like land values and rents adjusting downward.
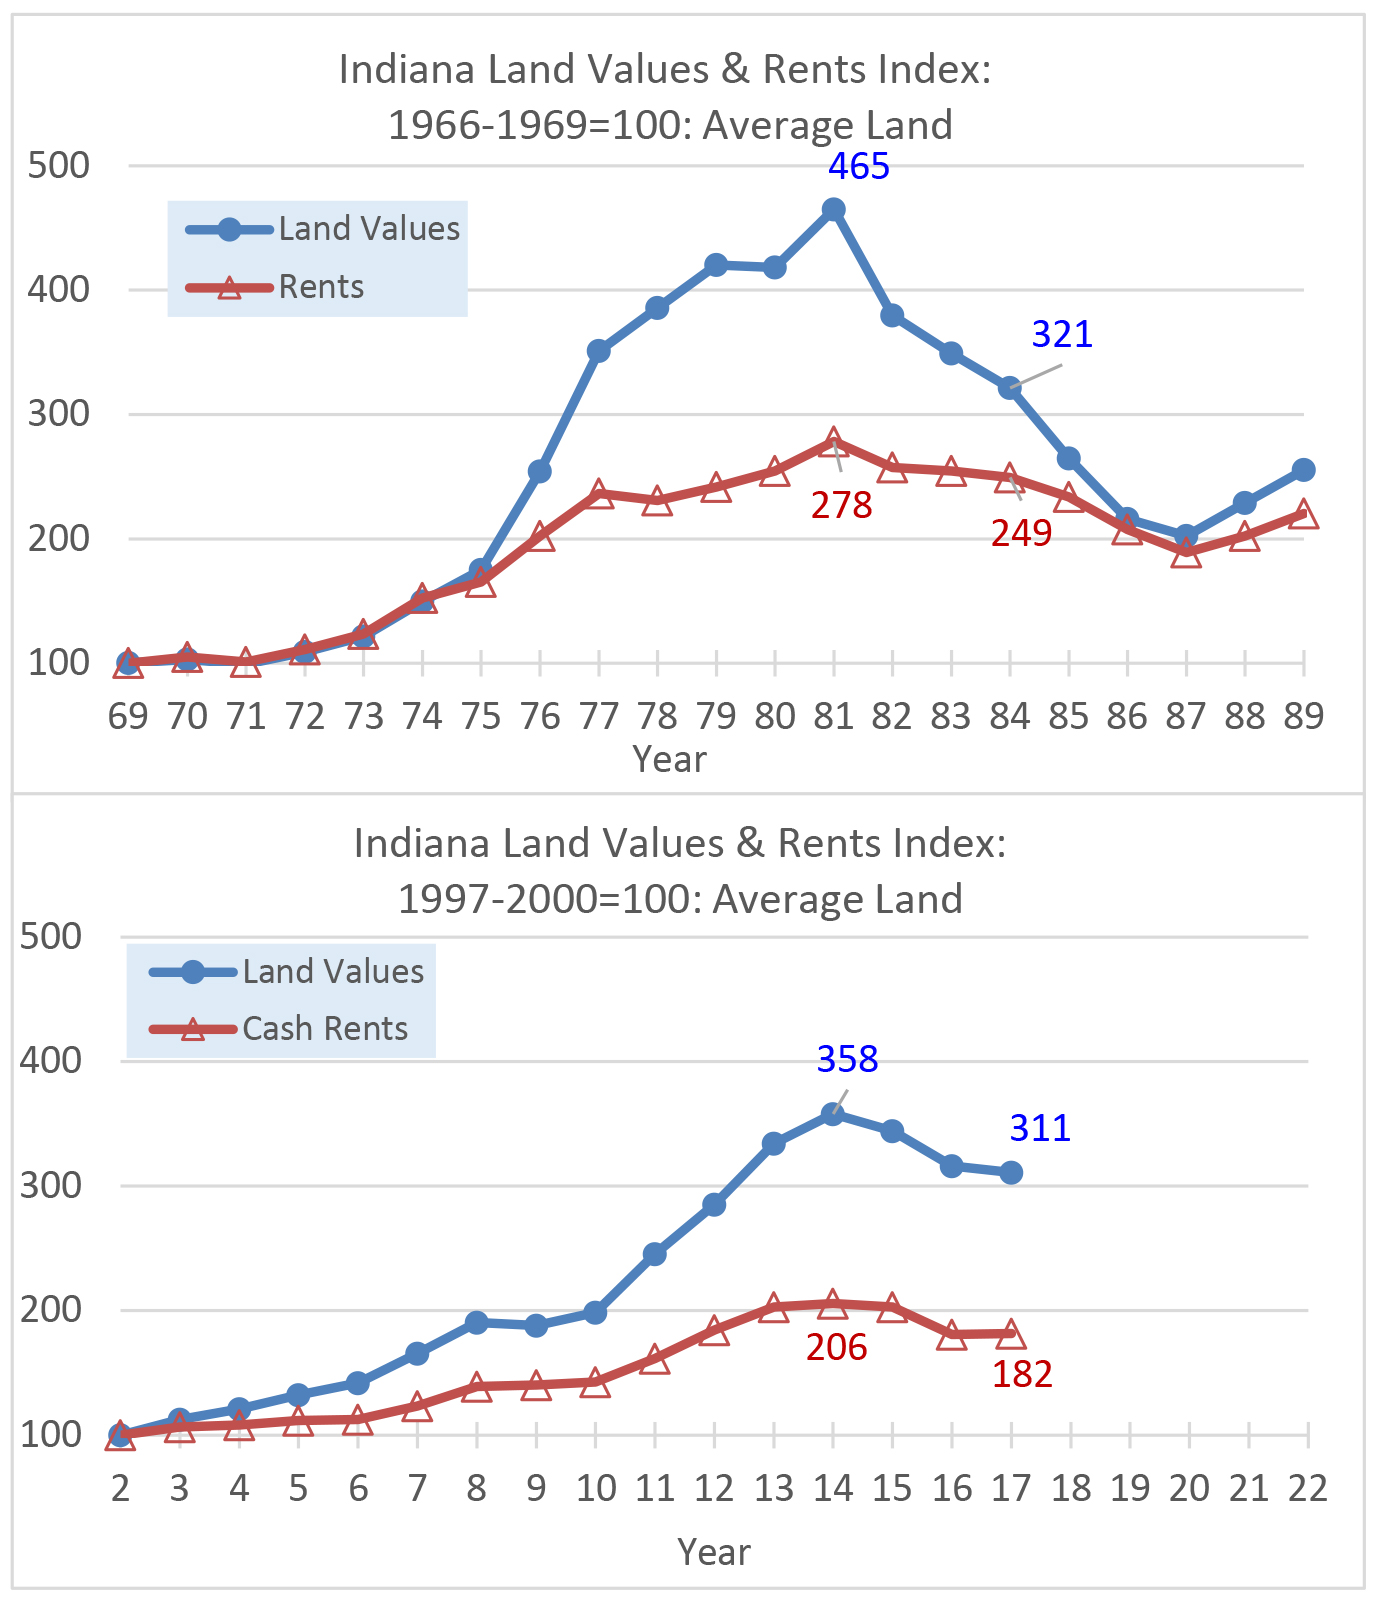
Comparisons of the current cycle with the 1970s and 1980s cycle are common and what we provide here is a visual observation of similarities and differences. The intent is not to go through all the reasons why they are different, but rather to provide a visual reference. We provide a two panel figure. The top panel represents patterns of Indiana land values and cash rents during the boom and bust of the 1970s and 1980s and the bottom panel is for the current cycle.
The concept is to establish a base period well before land values and rents began to move sharply upward, and then to observe the pattern of price changes from that base period. The second point of the design is to have the peak price years of 1981 and 2014 occur at the same position on the year count in both panels.
For the 1970s and 1980s cycle, the base period was the years 1966 to 1969. Average land and rent prices for these four years is set equal to 100. The base period for the current cycle was 1997 to 2000, again a four-year period well before grain prices began to shoot upward.
Comparing the two panels provides evidence of similarities and differences:
- The overall patterns of surging land values and rents followed by a series of downward years of adjustment is evident in both cycles, although the current downward adjustment phase is still playing out.
- In both cycles the percentage move up in land values was much greater than cash rents.
- The surge in land values from the base period was much less this time. In the 1970s the peak land values were 4.65 times the base period. In the current cycle, land values only rose 3.58 times.
- The same is true for cash rents. In the 1970s they rose 2.78 times the base period and in the current cycle only 2.06 times.
- Land values have dropped for three years in the current cycle, but are only down from the 2014 peak by 13.1% for average quality Indiana land. In the upper panel land values dropped by 31.0% in the first three years after the 1981 peak.
- Cash rents in both cycles have dropped a similar amount in the three years after the peak. That was 10.4% in the top panel and 11.7% in the current cycle.
What are the implications?
- Land values and rents did not rise so sharply this cycle, so there is reason to believe they will not have to fall as much as they did in the 1980s.
- The rapid drop of 31% in land values from 1981 to 1984 was likely related to both a rapid narrowing of margins and rapidly rising interest rates used to reduce high inflationary expectations. High inflationary expectations are not as important in this downward adjustment phase.
- The downward adjustment period in the 1980s took six years. We are currently three years into the downward adjustment this time. In addition, in the 1980s the rate of decline in land values did not slow until the sixth year (1987). For this cycle, the 2017 survey results show a slowing rate of decline in land values and a slight increase in cash rents. Does this indicate a potential bottoming of farmland values and rents?
- Our evaluation of crop budgets for 2017 and 2018 suggests crop margins will be very tight once again in 2017 for the average Indiana crop producer. Tight margins for the 2017 crop will be a result of continued low grain prices and also due to below trend yields for Indiana, based on sub-par crop conditions at this writing. Margins in 2018 appear somewhat improved, but with crop prices still not high enough to cover all budgeted costs.
- The response from the federal government is different this time. The 1980s farm program provided a firm safety net for farmers when prices declined. This time support levels are designed to decline as time passes and low prices replace high prices in the calculation of ARC and crop insurance revenue guarantees.
- With these conditions, some further downward adjustments in land values and cash rents are likely and this is the same direction survey respondents are leaning with expectations of around a 3% drop in land values by the end of 2017 and a nearly 5% drop in 2018 cash rents.
- Overall, we continue to suggest this cycle will be less severe when compared to the boom and bust of the 1970s and 1980s.
Indiana Land Values & Rents Index (1966-2000 Average Land)
![]()
![]()
![]()
![]()
![]()
