Weighing Crop Program Alternatives in the 2014 Farm Bill
June 13, 2014
PAER-2014-4
Roman Keeney, Associate Professor and Tamara Ogle, ANR Educator
![]()
![]()
![]()
![]()
![]()
Farmers will have to make a decision regarding their participation in the new farm program which will cover the 2014 to 2018 crops. There are three main alternatives to select from and in the previous edition of PAER, we examined two of those: PLC (Price Loss Coverage) and ARC-C (Agricultural Risk Coverage-County).
Here, we continue by explaining the third alternative which is a whole farm alternative we designate as ARC-I (Agricultural Risk Management-Individual Farm). Then we will discuss some of the key decision points producers must evaluate to make a well informed decision.
Introducing the Agricultural Risk Coverage-Individual (ARC-I) Option
Perhaps the easiest way to introduce the ARC-I option is to compare and contrast it with the other two alternatives; PLC (Price Loss Coverage) and ARC-C County).
Table 1 provides a list of five features of the three programs offered in the 2014 farm bill. What triggers a payment? PLC is distinguished from the ARC programs by using a reference price as opposed to benchmark revenue for triggering payments. The reference prices are set in the law (by statute). Payments would be made to farmers under the PLC option when the U.S. market year farm price drops below the statutory reference price of $3.70 a bushel for corn,
$8.40 a bushel for soybeans, and $5.50 for wheat. Each commodity is independent, so in any given year, payments might be triggered on one of the commodities but not the others. The PLC program effectively guards against price drops between the statutory reference price and the loan rate that guarantees a minimum price for the crop.
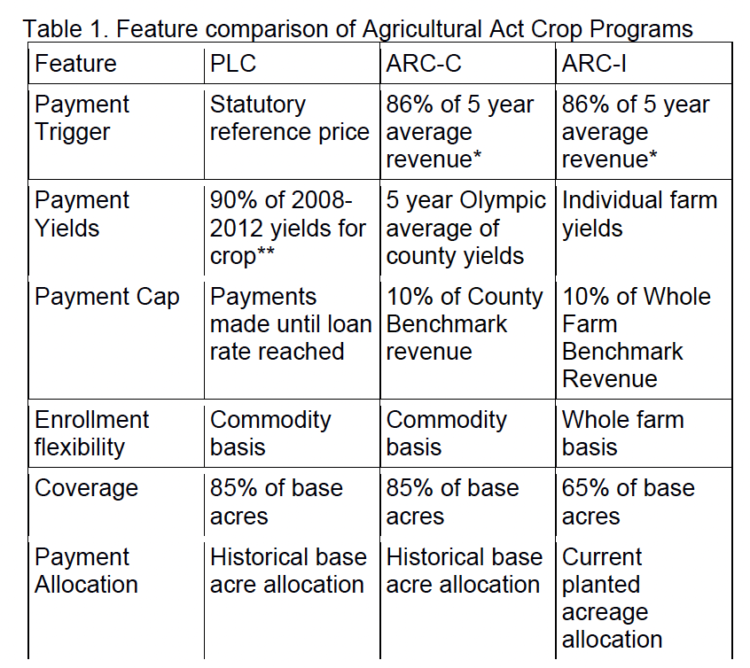
Table 1. Feature comparison of Agricultural Act Crop Programs
The two ARC programs function quite differently and bear more resemblance to revenue based crop insurance. In both instances of ARC, payments begin when actual revenue in a given year for that crop falls below 86% of the benchmark revenue which is determined by the most recent 5 years of yields and U.S. marketing year prices. These payments cease however after an amount equal to 10% of the benchmark is paid. ARC-C uses county yields and ARC-I uses the individual farm’s yields to determine the benchmark revenue. The ARC programs can thus be thought of as a government support payment to offset a portion of the deductible from a crop insurance contract at 75% coverage.
Similar to county insurance products, the ARC-C works as a group or pooled coverage plan while the ARC-I works on an individual farm basis. The county yield basis of the ARC-C means that a farm will have its payments triggered and calculated based on the countywide performance for the crop. The individual basis of the ARC-I uses only yield information of the covered farm for determining payout amounts. In the last three rows of Table 1 we see that moving to this individual type of coverage comes at a cost as farmers have to forego both enrollment flexibility and the amount of base acres covered. Farms that enroll in ARC-I will have 20% less of their base acres used in calculating their payments. ARC-I farms also lose the commodity by commodity flexibility in enrollment and must instead enroll all base acres on the covered farm in the ARC-I option. The ARC-I option also uses this year’s planted acres in determining the acreage base rather than the FSA fixed acreage allocation that is present in the PLC and ARC-C programs.
Calculating an ARC-I Payment
To demonstrate an ARC-I payment we should first review the ARC-C calculation, previously presented in the April edition of PAER. In Table 2, we have five years of data on prices and yields for wheat and corn crops. In calculating the average price and yield for each crop, we use an Olympic formula that drops the lowest and highest value. Multiplying the Olympic average price and yield for each crop yields a benchmark revenue for each crop. The ARC-C revenue guarantee is 86% of that benchmark.
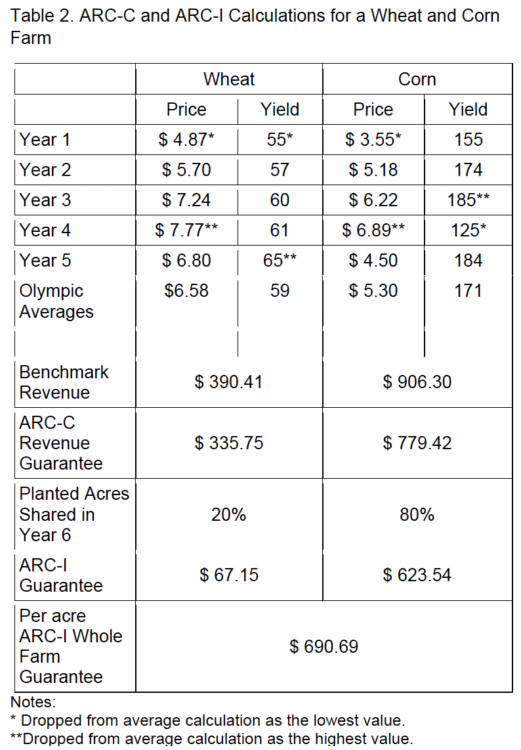
Table 2. ARC-C and ARC-I Calculations for a Wheat and Corn Farm
Assuming these are the county average yields for each year, a farmer who enrolled both wheat and corn crops in the ARC-C option would begin receiving payments when actual revenue (county yield multiplied by U.S. marketing year average price) fell below these values. Those payments may increase up to a limit of 10% of the benchmark revenue (approximately $39 for wheat and $90 for corn) and would be paid out on 85% of historical base acres. Continuing with Table 2, the three rows at the bottom demonstrate the primary difference in the ARC-I and ARC-C options. The Planted Acres Share row shows that 20% of acres are in wheat this year while the remaining 80% are in corn this year. This year’s planted acres provide the weights used to calculate the ARC-I benchmark revenue for the farm, using the farm’s actual yield history in calculating the Olympic average yield for the past five years. For simplicity here, we have assumed that the farm has identical yields to the county. This gives an ARC-I guarantee for covered acres on the farm of $691. ARC-I will vary versus ARC-C due to differences in yields (individual farm versus county yields) and due to the use of acre bases in which the ARC-I uses this year’s actual planted acres and ARC-C uses the historical FSA acreage bases. Payments under ARC-I are only made if the whole farm actual revenue drops below the whole farm guarantee revenue. This means payments are made on a whole-farm basis not commodity-by-commodity.
ARC-I may provide higher guarantees but may not, provide higher actual payouts. There are a couple of reasons to expect an ARC-I guarantee to be higher on a farm choosing that option over taking an average of the ARC-C guarantees using historical base allocations. First is that ARC-I uses current planted acres versus the fixed base allocation. It is reasonable to expect that plantings will move to crops with higher recent prices so that the ARC-I has the advantage of having that reflected in the guarantee calculation. Second, a farm opting into ARC-I over ARC-C likely has yields that are outperforming the county average often enough to provide higher ARC-I guarantees. But ARC-I has a big negative because the payout for ARC-I is only made on 65% of the base acres compared to 85% for ARC-C. Farmers doing a comparison of the two will need to see enough advantage in the ARC-I guarantee levels to overcome this 20 percentage point discount on payment acres
Organizing Information for Making Program Decisions
Producers will have multiple considerations that must be weighed as part of evaluating their program enrollments later this year. The following outline represents a summary of the decision set they will face with a more detailed discussion that follows:
What farm program parameters can producers adjust?
- For those considering PLC, should yields be updated? For many farms this should be an easy decision. Program yields are at least 12 years old for most farms and updating to 90% of the average yield for the 2008 to 2012 crops will generally increase payments under PLC.
- Should the allocation of base acres be updated? This will vary based on the particulars of a farm. Base acreage allocations to crops are old for many farms. Updating may more closely match the current planting intentions but may not maximize expected payments
Which of the three program alternatives should I select?
- For each program crop on the farm, is ARC-C preferred to PLC or not? This will depend on a producer’s expectations about prices. Many estimates using published forecast prices show ARC-C to have a payout advantage over PLC because the statutory prices in PLC are considerably lower than the Olympic average prices from the past five years.
- Is the whole farm ARC-I preferred to the best commodity by commodity enrollments? Once a producer has an idea of how ARC-C versus PLC fares for each commodity on the farm, the total expected payment (or payment per planted acre) can then be compared to the expected payment per acre from ARC-I
To fairly evaluate PLC most farmers should at least find out what their updated yields would be under PLC. Their alternatives are to stay with current FSA program yields or to update them to 90% of the simple average of actual yields from 2008 to 2012. PLC is the only alternative that uses payment yields. For most farms with current FSA yields reflecting late-1990s levels this has a strong probability of increasing their payment yields and expected payments under PLC.
Next, producers will want to consider the choices they have to allocate base acres for each farm which can be important for PLC and ARC-C. Base acres are important because they are part of the payment formulas. For each FSA farm, the total base acres cannot be changed, but you can elect to stay with the current allocation of acres on the farm, or to reallocate the base acres to the average acreage mix on that farm for the 2009 to 2012 crops.
An example is helpful. Say a farm currently has a 100 acre base and that the acreage allocation is 50 acres of corn base and 50 acres of soybean base. If during the 2009 to 2012 crops that farm averaged 60 acres of corn and 40 acres of soybeans, then 100 acres of base could either stay 50/50, or be switched to 60 acres of corn base and 40 acres of soybean base. Again the total acres cannot be changed, just the allocation of the 100 acres.
The decision on base reallocation is not so straightforward. One strategy farmers should consider is doing analysis of farm program enrollments using both their current and updated base allocations. This would lead to three sets of outcomes which would be compared:
- Stay with old base allocation and do commodity by commodity program evaluations (ARC-C & PLC)
- Move to new base and do commodity by commodity program evaluations (ARC-C & PLC)
- Compare #1 and #2 with the whole farm program that uses current year planted acres (ARC-I)
The first two options will differ by how plantings over the 2009-2012 period differed from the historical record on the farm. It is possible that a 2009-2012 update will produce more expected value if plantings featured corn more heavily than the farm history due to elevated corn prices. If these prices taper off over the next five years as some forecasts suggest, then the update decision could produce significant payment advantages, even if it represents a poor match for actual plantings for the coming five years.
Once an economic evaluation of #1 and #2 has been made, the final task is to compare these against ARC-I with its whole farm requirement. Recall that ARC-I begins with potential advantages and a big disadvantage since program payments are made on only 65% of base acres rather than the 85% for ARC-C and PLC. This means that the nominal payment difference from being in ARC-I would need to be about 30% greater (0.85/0.65 = 1.307) for the programs to be equivalent. The primary advantages of ARC-I are for farms where actual yields are well above the county averages used in ARC-C, and the opportunity to use an acreage base allocation determined by what is planted that year.
The bottom line is that most producers will want to make and study economic evaluations of all three alternatives for each of their FSA farms before making their final one-time decision for the 2014 to 2018 crops. Decision aids and educational programs will be available to producers on their farm program choices from USDA and Land Grant Universities like Purdue, and from other agricultural organizations. USDA is currently targeting the winter of 2015 for the sign-up period for PLC, ARC-C or ARC-I.
![]()
![]()
![]()
![]()
![]()