What 2014 Purdue Crop Budgets are Telling Us?
December 24, 2013
PAER-2013-12
Michael Langemeier, Professor; Alan Miller, Farm Management Specialist; Craig Dobbins, Professor
![]()
![]()
![]()
![]()
![]()
The 2014 Purdue Crop Cost and Return Guide, which is available for free download from the Department of Agricultural Economics website, gives estimated costs for planting, growing and harvesting a variety of crops, as well as estimated contribution margins and earnings. The guide is updated frequently as grain futures prices change and the costs of inputs, such as seed, fertilizer, pesticides and fuel, fluctuate. This article uses estimates made in early December 2013.
The guide presents cost and return information for low, average, and high productivity soils. The discussion here will focus on the estimates for average productivity soil. Table 1 presents crop budget information for continuous corn, rotation corn, rotation soybeans, wheat, and double-crop soybeans for average productivity soil. Double-crop soybeans are typically planted after wheat so it is typical to combine the contribution margin for these two crops. The contribution margin, obtained by subtracting total variable cost from market revenue, ranges from $206 per acre for continuous corn to $486 per acre for wheat/double-crop soybeans ($260 + $226 = $486).
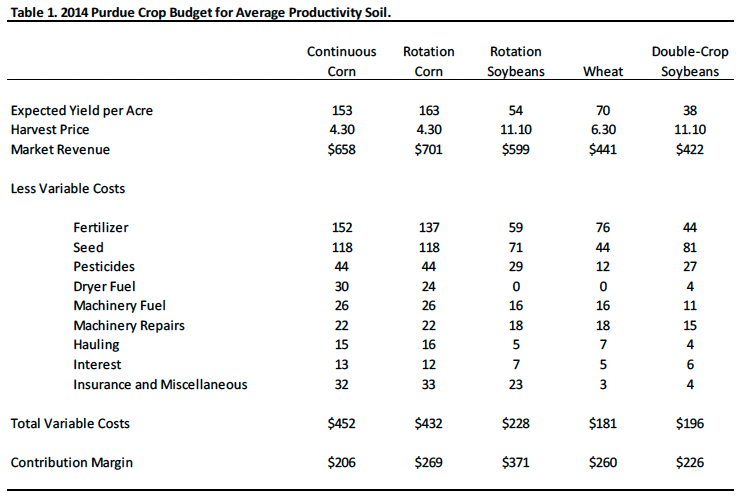
Table 1. 2014 Purdue Crop Budget for Average Productivity Soil.
Figure 1 illustrates the trends in market revenue, total variable costs, and the contribution margin for rotation corn from 2005 to 2014. Market revenue in 2014 is expected to drop approximately 26 percent, primarily due to the decline in corn price.
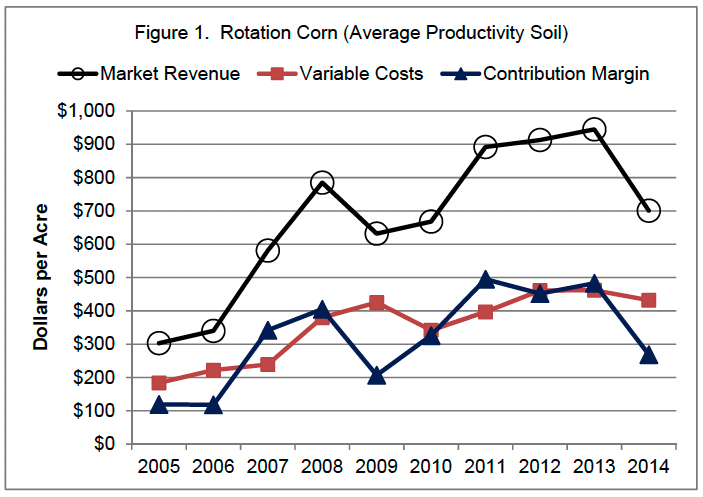
Figure 1. Rotation Corn (Average Productivity Soil)
Variable costs, due to lower fertilizer costs (Figure 2), are expected to decline slightly. Fertilizer costs are based on price estimates in early December 2013. The contribution margin for 2014 is expected to drop $214 per acre (approximately 44 percent) and is expected to be the lowest since 2009. However, the contribution margin is still well above the levels experienced in 2005 and 2006. It is important to note that the contribution margin is used to cover overhead costs such as machinery costs, family and hired labor, and rent. Failure to adequately cover these overhead costs typically puts downward pressure on rents.
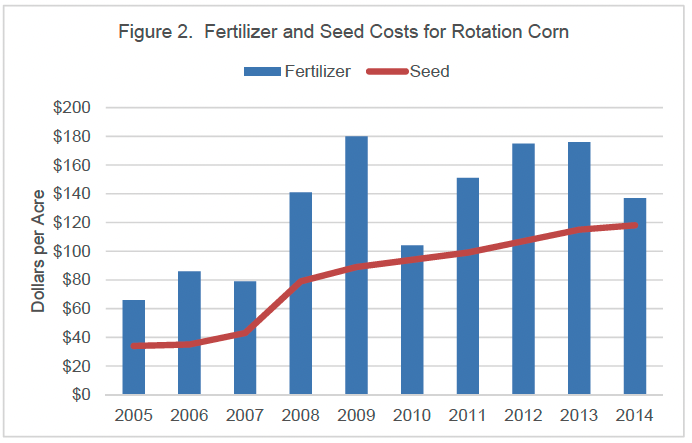
Figure 2. Fertilizer and Seed Costs for Rotation Corn
Trends in market revenue, total variable costs, and the contribution margin for rotation soybeans are illustrated in Figure 3. Market revenue in 2014 is expected to drop approximately 11 percent, which is a much smaller percentage decline than the expected drop in corn price. As with rotation corn, total variable costs are expected to drop slightly in 2014 due to the expected decline in fertilizer costs (Figure 4). Note in Figure 4 that seed cost per acre is expected to be larger than fertilizer cost per acre in 2014 for the first time since 2007. The contribution margin for rotation soybeans is expected to decline$60 per acre (approximately 14 percent). Though lower than the contribution margins in 2011, 2012, and 2013; the expected contribution margin in 2014 is still higher than that experienced in 2009 and 2010.
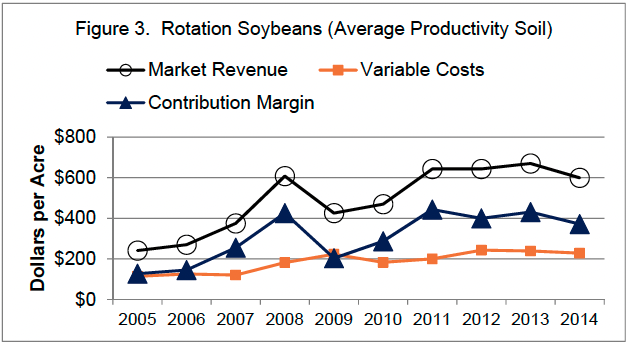
Figure 3. Rotation Soybeans (Average Productivity Soil)
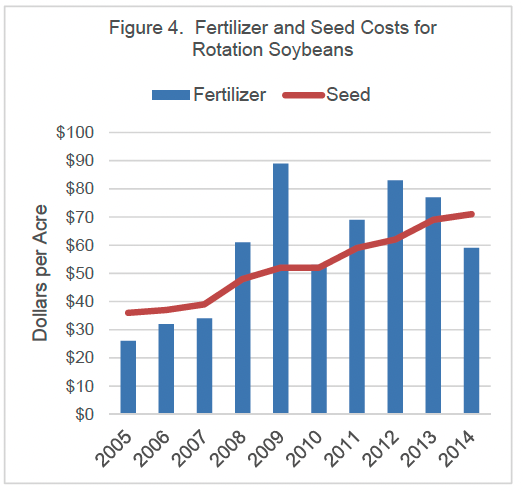
Figure 4. Fertilizer and Seed Costs for Rotation Soybeans
From 2010 to 2013, the contribution margin for rotation corn was higher than the contribution margin for rotation soybeans. The average difference in the contribution margin was approximately $50 per acre during this period. The relative attractiveness of corn during the last few years, encouraged many producers to plant relatively more corn than soybeans. The situation in 2014 s considerably different and certainly favors soybeans. For 2014, rotations soybeans are expected to have a contribution margin that is approximately $100 per acre higher than the contribution margin for corn. Given the expected change in the relative attractiveness of corn and soybeans, producers should carefully budget both crops.
In the long-run, in addition to covering variable costs, producers need to cover the overhead costs associated with machinery, family and hired labor, and cash rent. Even if a producer does not hire labor or rent land, they need to consider the opportunity costs associated with these items, which can be estimated by answering the following questions. What is the value of family labor if it is employed off the farm? Similarly, what could the land that I own be rented for?
The residual remaining after subtracting variable costs and overhead costs, which include the opportunity costs associated with family labor and owned land, from market revenue and government payments (assumed to be zero for 2014) is called “earnings” in the Purdue crop cost and return guide. Over the long-run, we would expect the average earnings per acre to gravitate towards zero. Figure 5 presents earnings per acre for a farm with 3000 crop acres and that utilizes a corn/soybean rotation. Earnings per acre since 2005 have ranged from a negative $59 in 2006 to $238 in 2011, and averaged $55. Earnings per acre are expected to be a negative $21 per acre in 2014, well below the ten-year average.
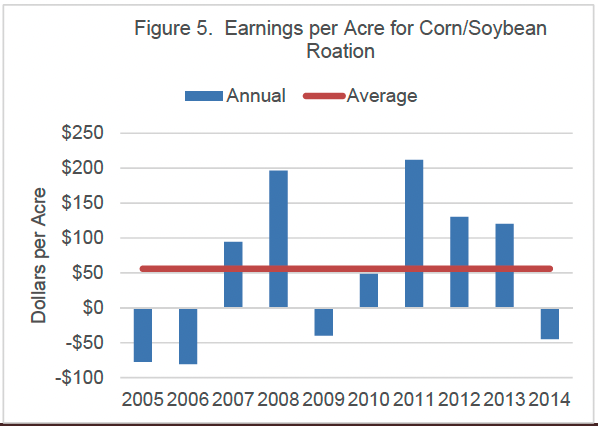
Figure 5. Earnings per Acre for Corn/Soybean Rotation
In summary, margins will be considerably tighter in 2014. This increases the importance of carefully scrutinizing input and crop decisions. Producers are encouraged to create crop budgets using their own farm information such as yield potential and actual costs for their operation. Good record keeping greatly enhances the ability of a farm manager to make sound production decisions. It is clear that if the anticipated tightening of crop margins does occur, it will adversely impact most farm’s liquidity position and their financial performance at least compared to recent years.
![]()
![]()
![]()
![]()
![]()
