What Do Locally Owned Cooperative in Indiana Look Like?
December 13, 2000
PAER-2000-22
Jennifer Vandeburg, Research Associate; Joan Fulton, Associate Professor; Susan Hine, Assistant Professor, Department of Agricultural and Resource Economics, Colorado State University; and Kevin McNamara, Professor
![]()
![]()
![]()
![]()
![]()
Consolidation in agricultural production and in agribusiness, is resulting in a number of business challenges for local agricultural supply and grain marketing cooperatives.
A recent study conducted by the Purdue University Department of Agricultural Economics focused on understanding cooperative operators’ perceptions of trends shaping the future of their industry and strategies that they have used to maintain their competitiveness. Data were collected through interviews with 35 managers of locally owned Indiana farm supply and grain marketing cooperatives during the months of May and June 2000. Cooperative managers were asked for their opinions about industry trends as well as for information describing lines of business, size, source of business, and technological adoption. These data are described in this article to present an overview of the size and structure of Indiana cooperatives and to provide insight into how these cooperatives plan to face the challenges of survival in the future. In the second article in this series, we will discuss the new business arrangements local agricultural cooperatives are using to meet the challenges of consolidation in agribusiness.
Lines of Business
Indiana local cooperatives engage in several business activities. Table 1 reports responses from 34 managers about the business activities in which their cooperatives are involved. Lines of business are grouped into three categories: farm supply, grain marketing, and administrative. Each category is subdivided to indicate the primary activities within each line of business.
Farm supply activities are divided into the agronomy division, energy division, retail farm supply store, and feed division. The agronomy division is a core business for local farm cooperatives. One reason local agricultural cooperatives were established was to supply agronomic products and services to farmers, and this continues as a major part of cooperatives’ business today. All sample cooperatives offer agronomic products and services, including seed, fertilizer, crop protection products, and custom application ser-vices. Ninety-one percent offer agronomic consulting services. The results suggest that local cooperatives are keeping pace with innovation. Eighty-eight percent of the local agricultural cooperatives offer precision agriculture services such as GPS (Global Positioning System) mapping and variable rate fertilizer and chemical application.
The energy division is also an important area of business. Eighty-two percent of local cooperatives sell fuel products, with petroleum most common, followed closely by liquid propane. Forty-four percent of cooperatives also operate convenience stores (C-stores) as part of their fuel sales efforts.
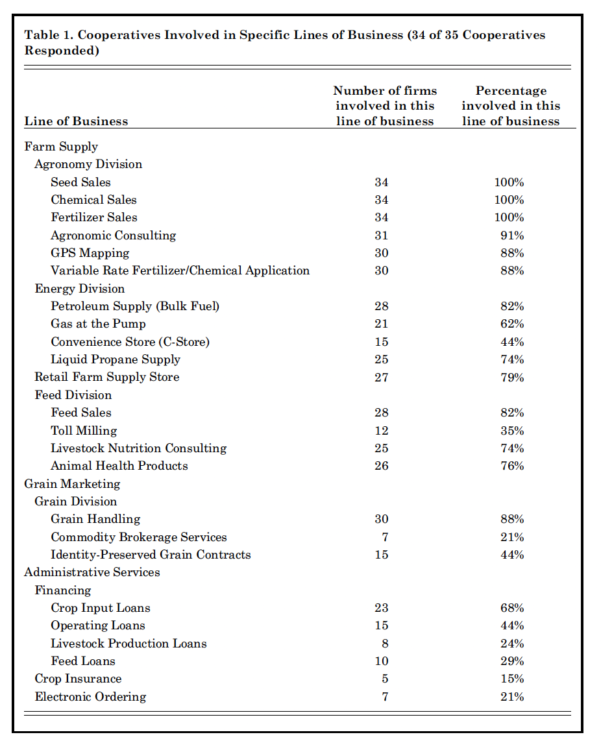
Table 1. Cooperatives Involved in Specific Lines of Business (34 of 35 Cooperatives Responded)
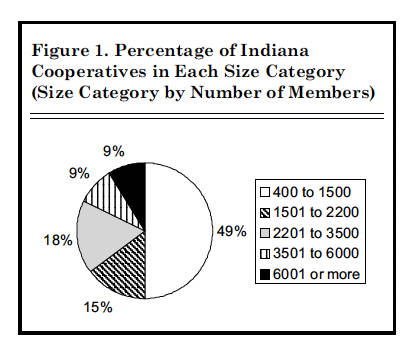
Figure 1. Percentage of Indiana Cooperatives in Each Size Category (Size Category by Number of Members)
Seventy-nine percent of the cooperatives surveyed indicated that they operate retail farm supply stores. These stores vary in their selection and scope, from selected merchandise to a wide range of products for livestock supply, horticulture, and machinery repair.
Livestock production in some parts of Indiana is restructuring and becoming more concentrated. According to the Indiana Agricultural Statistics Service, the volume of pork production has fluctuated with market cycles, the number of hog farms has decreased and the size of the remaining farms has increased dramatically over the past ten years. As a result, a greater percentage of pork production operations now operate their own feed mills. Despite this trend toward providing fewer feed manufacturing services to farms, 82% of the state’s local cooperatives are still active in feed supply. Some have branched out into recreational or “hobby” feeds, and those cooperatives in urban areas target suburban pet and horse owners. Many cooperatives with feed businesses also pro-vide livestock nutrition-consulting services and sell animal health products. However, only 43% of cooperatives with feed businesses offer toll-milling services.
Most local agricultural cooperatives in the state, 88% of those inter-viewed, indicated that they operate grain handling facilities, in varying scale, from a few small truck houses to large rail terminals. About one-fifth of the cooperatives have commodity brokerage services avail-able through their elevators. Half of the grain marketing cooperatives offer identity preserved grain pro-grams to their growers.
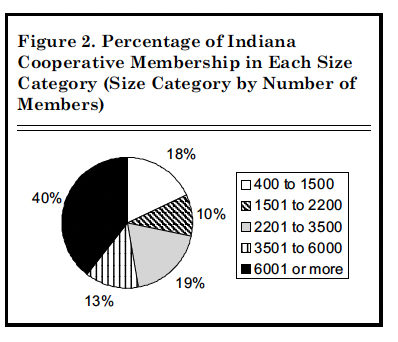
Figure 2. Percentage of Indiana Cooperative Membership in Each Size Category (Size Category by Number of Members)
Twenty-three (68%) of the cooperatives interviewed offer financing in some form. The most common form is crop input loans, followed by operating loans, which may include expenses such as cash lease payments. Some cooperatives also make financing available for livestock feed and for livestock production.
Size
We use five measures to discuss the size of local cooperatives in Indiana: number of members (those who own equity in the cooperative), total annual sales, sales per member, number of employees, and sales per employee. Local cooperatives in Indi-ana had a wide range of membership totals at the end of 1999, from less than 500 to more than 7,000 members. As shown in Figure 1, nearly half of the cooperatives responding to this question* have between 400 and 1500 members, but they only account for 18% of total cooperative membership in the state, as shown in Figure 2. Fifteen percent of the cooperatives have 1501 to 2200 members and account for 10% of the state’s membership. Eighteen percent of the state’s cooperative have 2201 to 3500 members and 19% of membership. The cooperatives with 3501 to 6000 members, 9% of the cooperatives responding, account for 13% of Indi-ana’s cooperative membership. The group of local agricultural cooperatives with the largest membership, more than 6000 members, account for only 9% of the cooperatives who responded, but they encompass 40%of the total membership in Indiana.
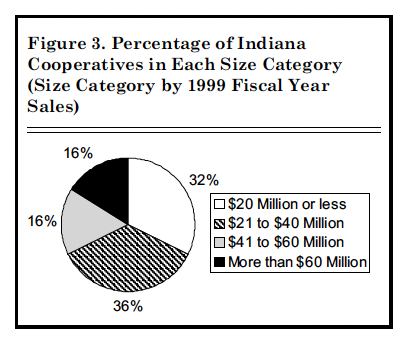
Figure 3. Percentage of Indiana Cooperatives in Each Size Category (Size Category by 1999 Fiscal Year Sales)
Despite the fact that these cooperatives are locally owned, they are not necessarily small businesses (Figure 3). The lowest level of total sales was less than $20 million, and the highest level of total sales for fiscal 1999 exceeded $60 million. More than two-thirds of respondents had sales less than $40 million.
Thirty-six percent of responses fell between $21 and $40 million for fiscal 1999. Sixteen percent of responses fell into the $41 to $60 million sales range, with another 16% having sales of more than $60 million for fiscal year 1999.
Level of sales was greatly affected by lines of business operated by the cooperatives. Grain sales are included in total sales, so those cooperatives with large grain operations tend to show a larger volume of sales.
Over two-thirds (68%) of local cooperatives had sales per member of$20,000 or less (Figure 4). Thirteen percent had sales per member of more than $40,000. The value of sales per member for each cooperative is affected by the amount of non-member business it engages in and the products and services offered by the cooperative, particularly grain sales. For cooperatives with higher levels of non-member business, the sales per member value is higher, all other things being equal. In addition, cooperatives operating businesses such as grain handling have a higher volume of sales.
The number of employees working for a local cooperative in Indiana depended on the lines of business the cooperative was involved in. Retail businesses, like C-stores, hire a number of part-time employees. Employee numbers ranged from less than 30 to more than 150 employees at the time of the survey, including part time and seasonal employees
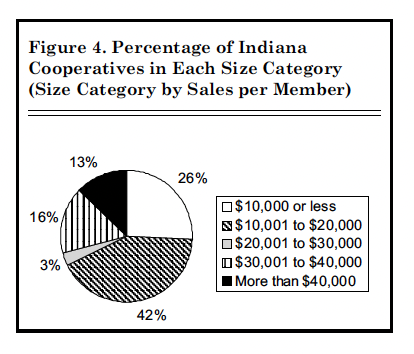
Figure 4. Percentage of Indiana Cooperatives in Each Size Category (Size Category by Sales per Member)
(Figure 5). One-third of the respondents had between 31 and 60 employees, with half employing 60 or less. Twenty percent, however, employed more than 120 workers.
Sales per employee ranged from less than $200,000 to more than $800,000 (Figure 6). Thirty-seven percent of the cooperatives responding to the sales and employee number questions had sales per employee between $200,001 and $400,000. Nearly two-thirds (64%) of the responses indicated a sales per employee level between $200,001 and $600,000. The lines of business a cooperative engages in affect this value, because certain businesses, particularly retail, require large number of employees.
Source of Business
Most of the managers responding to the survey (71%) indicated that their cooperatives’ market share had increased over the last five years (Figure 7). Fifteen percent felt that market share had been stable, while fifteen percent said that they had lost market share in the last five years. When asked about their market share for the next five years, 79%expected market share to increase, while 21% expected a stable market share. No manager expected decreasing market share for the next five years. The majority of managers expected to gain prominence in their respective markets. Some managers expressed the opinion that the increased strength is necessary for continued success.
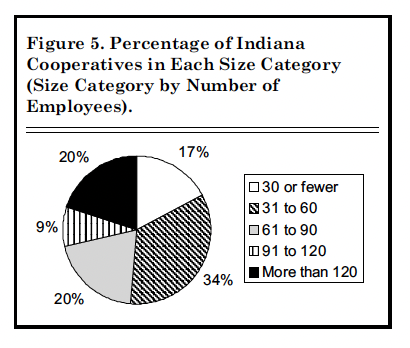
Figure 5. Percentage of Indiana Cooperatives in Each Size Category (Size Category by Number of Employees)
Most agricultural cooperatives have both members and non-members for customers. When asked about the trend in the amount of business they have been doing with members and non-members, the majority of managers indicated that volume of business has been increasing over the last five years with both groups (Figure 8). Fifty-five percent of the respondents indicated that volume of business with members had grown over the last five years, and 33% of managers felt that the volume of business with members had been stable. In contrast, 75% of responding managers indicated that non-member business had grown over the last five years. Non-member business has become increasingly important to the success of local cooperatives.
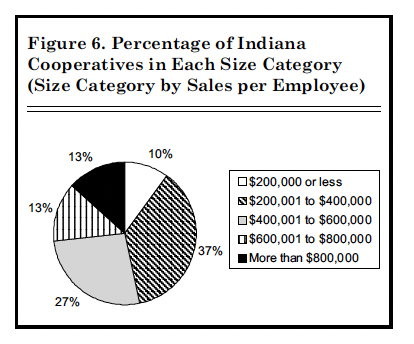
Figure 6. Percentage of Indiana Cooperatives in Each Size Category (Size Category by Sales per Employee)
Managers tended to have similar, but stronger, expectations about the future (Figure 9). Seventy-three per-cent of managers expect volume of business with members to increase, and 88% of managers expect business with non-members to grow. This response, too, suggests that managers see non-member business becoming an increasingly larger share of cooperative business.
Another indication of the importance of non-member business is the percentage of total sales volume attributed to non-members. Figure 10 shows that 41% of the cooperatives that responded do more than 40% of their business with non-members. Sixty-three percent do more than 30% of their business with non-members.
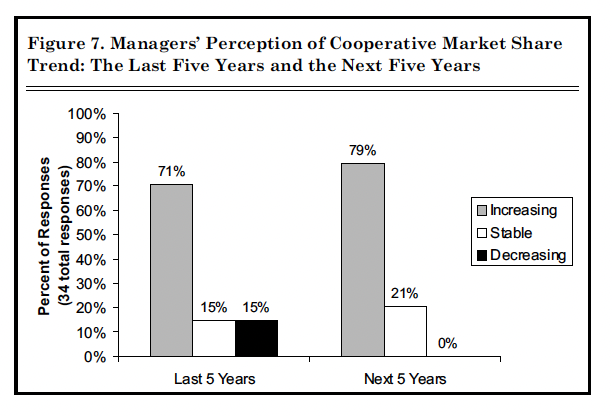
Figure 7. Managers’ Perception of Cooperative Market Share Trend: The Last Five Years and the Next Five Years
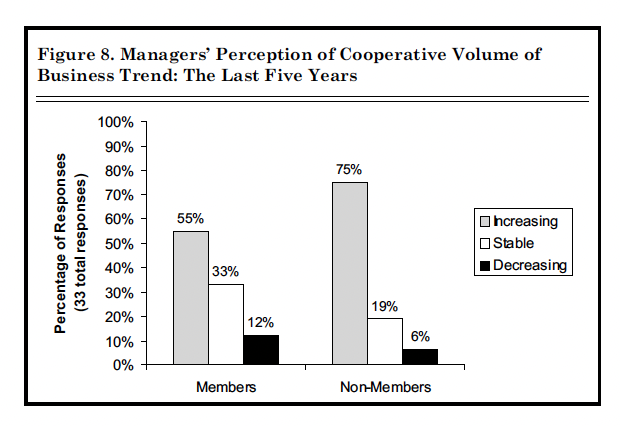
Figure 8. Managers’ Perception of Cooperative Volume of Business Trend: The Last Five Years
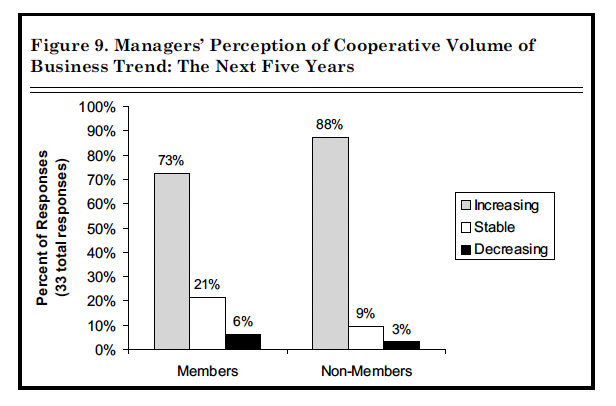
Figure 9. Managers’ Perception of Cooperative Volume of Business Trend: The Next Five Years
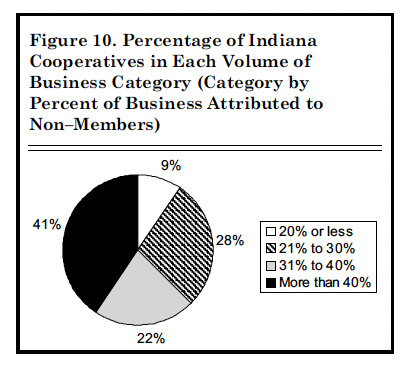
Figure 10. Percentage of Indiana Cooperatives in Each Volume of Business Category (Category by Percent of Business Attributed to Non-Members)
Technological Adoption
Business is currently in the midst of major changes with respect to information and computer technology. Local agricultural cooperatives are being influenced by these technologies as well. Cooperatives have adapted their operations to incorporate computer technology into their day-to-day business operations (Figure 11). Ninety-seven percent or more of the surveyed cooperatives use computerized billing and accounting systems. E-mail is more common for use with suppliers and end-users (82%), but is not used as much with farmer-customers (53%). Eighteen (53%) of the cooperatives responding to this question have an informational web page to provide members and customers with various types of information, like: cooperative news, grain bids, and information on how to contact the cooperative. Only eight (24%) have implemented web ordering alternatives. Sixty-five per-cent of the cooperatives use computers in their plant operations, including inventory computers in their delivery trucks. Fifty-nine per-cent offer cardtrol gas pumps, either for co-op credit or at their C-stores.
How Local Cooperatives Are Responding to Change
The structural changes in agriculture, the consolidation of production agriculture and of agribusiness, are creating an environment full of challenges for local agricultural cooperatives. Local cooperatives have been adapting by offering new products and services, like precision agriculture services, and by adding nontraditional lines of business, like C-stores. Managers are also acknowledging the increased importance of non-member business for the future success of their cooperatives. Local cooperatives are bringing information technologies into their operations, particularly for informational and business-to-busi-ness applications. While the speed of adoption is important, it remains to be seen whether local cooperatives are adopting information technologies fast enough to keep pace with the rest of the business world.
Cooperatives are also responding to this changing business environment through a variety of business arrangements, including strategic alliances, joint ventures, mergers, and acquisitions. The next article in this series will discuss the extent to which local cooperatives throughout Indiana are engaged in restructuring through mergers, acquisitions, joint ventures, and strategic alliances. Driving forces that motivate these arrangements will be described, and key success factors will be evaluated.
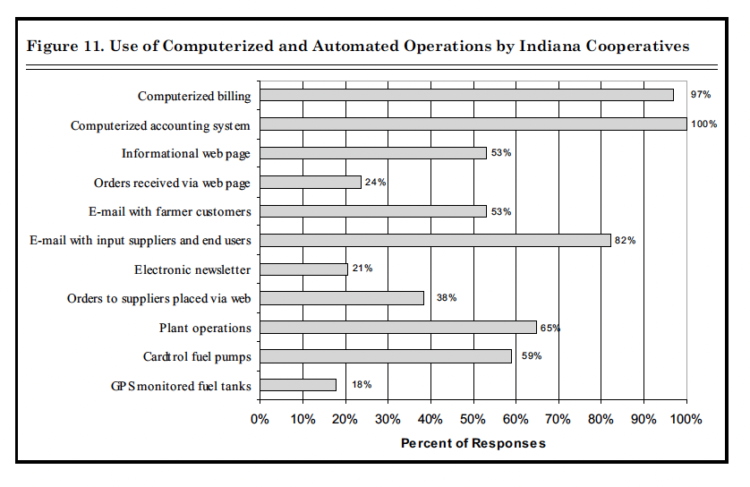
Figure 11. Use of Computerized and Automated Operations by Indiana Cooperatives
References
Indiana Agricultural Statistics 1999-2000. Indiana Agricultural Statistics Service. Purdue University. 2000
* Note: Some cooperatives chose not to respond to particular questions. Total number of responses varies depending on the question.
![]()
![]()
![]()
![]()
![]()
