What’s Happening to the Assessed Value of Farmland? July 2008
August 18, 2008
PAER-2008-14
Larry DeBoer, Professor
![]()
![]()
![]()
![]()
![]()
Most owners of farmland have received notice of their new assessed values for property taxes in 2008. Many have received their property tax bills. And most will have noticed that both the assessment and the tax bill are a lot higher in 2008 than they were in 2007. Here’s what’s going on.
Like most states, Indiana assesses farmland based on its “use value.” That means a farm acre is valued based on what it earns from agricultural use, not on its potential value for development.
Use value starts with a “base rate” per acre set by the state’s Department of Local Government Finance (DLGF). The same value is used for all farmland in the state. This base rate is multiplied by a soil productivity factor, which measures the productivity of the soil for growing corn. The factor ranges from 0.5 to 1.28 and varies by soil type. Some ground also is adjusted by an “influence factor,” which reduces the value because of features like flooding or forest cover.
This base rate changes every year, as part of the annual trending of assessed values. It’s calculated with a capitalization formula, which divides the estimated net income earned from growing crops on an acre, by an interest rate. This is the amount someone would have to invest at that interest rate to earn that net income. For example, if an investor had $1,481 invested at 8.10% per year, he or she would earn $120. So, an investor would be unlikely to pay more than $1,481 for an acre that earned $120. If the acre cost more, the investor might as well invest at the interest rate.
Table 1 shows the numbers that have been used in recent years to calculate the base rate. In the numerator of the capitalization formula are the net income figures, one based on cash rent, one on a calculation using yields, commodity prices, and costs reflecting farm operations. In the denominator is the capitalization rate, which is based on real estate and operating loan interest rates. The data come from various Purdue, USDA and Federal Reserve sources. The Department of Local Government Finance provides documentation for all of this data. The capitalized values are calculated separately for cash rent and operating net incomes, then averaged together.
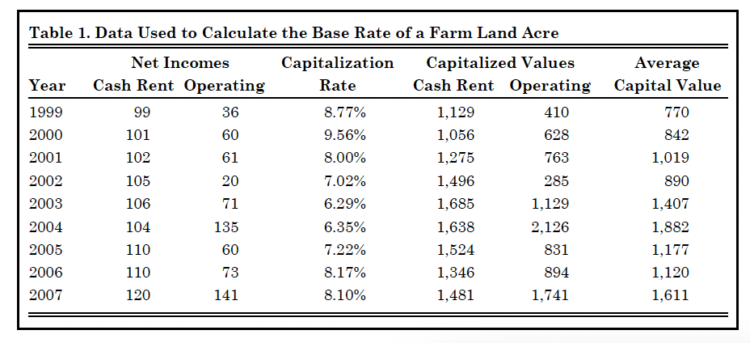
Table 1. Data Used to Calculate the Base Rate of a Farmland Acre
The single-year results bounce up and down quite a bit. To iron out these fluctuations, DLGF uses a six-year rolling average, which is mandated by legislation. The base rate for taxes in 2008 used data from 1999 through 2004. Table 2 shows the results of the rolling average calculations, which produces the base rate used for assessments.
DLGF used a four-year average through 2006. That was the first year that the state intended to use annual trending of assessed values. The farm base rate was set to drop 16%. Assessors weren’t ready to trend other kinds of property, though, so the General Assembly delayed trending for everything but farmland. They mandated that the base rate remain at $880 for two years, then that the DLGF adopt a six-year average starting with taxes in 2008.
This was a substantial tax break for farmland owners in 2007. Had the base rate been calculated with the four-year formula, it would have been $1,040 instead of $880. That’s one reason why the jump this year was so large. It includes two years of base rate increases.
There’s a four-year lag between the tax year and the data used to calculate the base rate. Data for 2007 won’t enter the tax bill calculation until 2011. That means future changes in the base rate can be estimated using data that have already been recorded. Table 2 shows the results. The base rate will rise to $1,200 for 2009 taxes—the DLGF has already made that official. For 2010 taxes the base rate will be about $1,250, and for 2011, $1,350. These last two figures are estimates based on the current six-year formula and the 2006 and 2007 data.
The base rate is going up. The reason has to do with the data that are added and dropped from the six-year average each year.
The base rate is going up. The reason has to do with the data that are added and dropped from the six-year average each year. The base rate for taxes in 2008 used data from 1999 through 2004. The base rate for taxes in 2009 drops the data from 1999 and adds data from 2005. So, the increase in the base rate from $1,140 to $1,200 results from differences between the numbers in 1999 and 2005.
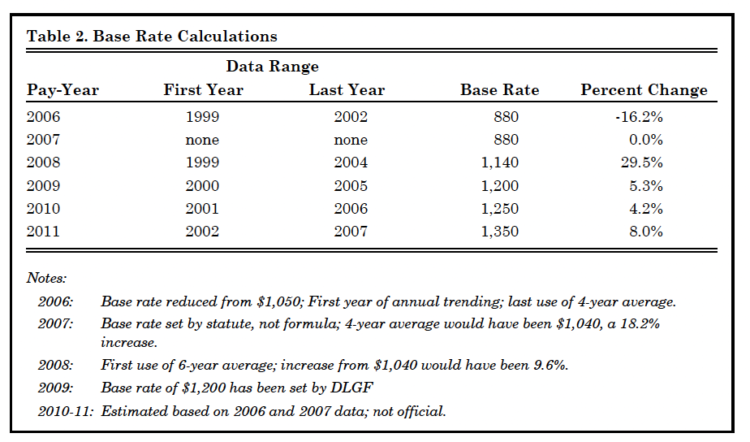
Table 2. Base Rate Calculations
In 1999 the interest rate was 8.77%. In 2005 it was 7.22%. Dividing by a smaller number increases the formula’s result. In 1999 average gross cash rent was $110 per acre. In 2005 it was $126. Rent is one measure of net income used in the numerator of the capitalization formula. In 1999 the average corn yield was 132 bushels per acre. In 2005 it was 154 bushels. Yield is part of the calculation of operating net income, also in the numerator. So are soybean yields and prices, which also went up. Costs are subtracted from net income in the numerator, and they went up too. That kept the base rate from increasing even more.
For 2010 taxes, DLGF will replace the 2000 numbers with 2006 numbers in the base rate calculation. For 2011 taxes, they will replace the 2001 numbers with 2007 numbers. The interest rate was lower in 2006 than it was in 2000, about the same in 2001 and 2007. Rents were up in both years. Corn yields were up a little in both years, but soybean yields were lower in 2007 than in 2001. Corn and soybean prices are much higher in 2007 than they were in 2001. That’s the main reason for the big jump in operating net income in 2007 (Table 1).
The base rate of farmland is likely to continue to rise after 2011. In 2012, for example, 2008 data will be added, and 2002 data will be dropped. The corn price used in the capitalization formula in 2002 was $2.20 per bushel; the soybean price was $5.00. Operating net income in 2002 was only $20 per acre. Figures in 2008 are likely to be much higher, so the base rate likely will rise again.
Remember though, an increase in farmland assessed value will not necessarily result in an equal increase in the farmland tax bill. In rural areas, an increase in the assessed value of farmland can raise total assessed value so that tax rates fall. The increase in tax bills would be less than the increase in farmland assessed value. In urban areas, though, farmland is a small share of total assessed value, and the increase in farm land assessments would have little effect on tax rates. The increase in tax bills would be equivalent to the increase in farmland assessed value.
Changes in the tax bills are also affected by local government spending, by changes in the assessed values of other property in the county, and by changes in state policy. And it’s a safe prediction that agricultural interests will be looking for a change in policies as farmland assessments rise in coming years.
Sources
DeBoer, Larry. 2008. “Farm Land Assessment for Property Taxes,” Indiana Local Government Information website [www.agecon.purdue.edu/crd/Localgov] .
Department of Local Government Finance. December 2007. “Reference Materials for Valuing Agricultural Land for March 1, 2008” [www.in.gov/dlgf/files/AGLandValues.pdf] .
![]()
![]()
![]()
![]()
![]()
