When Times Get Tough: Food Assistance in Indiana
June 23, 2011
PAER-2011-05
So Yeong Lim, Graduate Student; Brigitte Waldorf, Professor
![]()
![]()
![]()
![]()
![]()
Since the economic crisis began in September 2008, the negative consequences have been felt throughout Indiana: stores out of business, houses foreclosed, jobs lost. Poverty became a reality for many families. At times, poverty means that families even lack the resources to provide enough to eat for everyone.
Figure 1 shows the percentage of the population with incomes below the poverty line for the United States and for Indiana. For most of the last decade, poverty was less severe in Indiana than in the nation as a whole. However, Indiana poverty increased quite fast, and, by 2008 poverty in Indiana reached the national average of about 14 percent (* 1). Tightly linked to the spread of poverty is the increased prevalence of food insecurity among households, or being uncertain about having enough resources for sufficient food for all household members. USDA estimated that almost 15 percent of the US population did not have food security in 2009, compared to 10.5 percent in the year 2000. The extent of food insecurity in Indiana in 2009 is estimated to be similar to the national average (http://www.ers.usda.gov/Briefing/FoodSecurity/stats_graphs.htm).
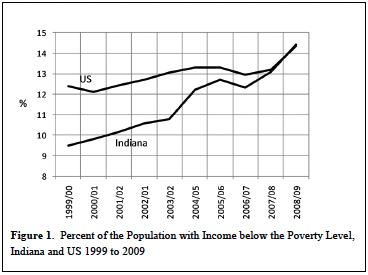
Figure 1: Percent of the Population with Income below the Poverty Level, Indiana and US 1999 to 2009
To relieve such hardships, the US government – under the auspices of USDA – provides a number of food assistance programs. Examples are the National School Lunch Program and the Supplemental Nutrition Program for Women, Infants and Children (WIC). The biggest food assistance program is the Supplemental Nutrition Assistance Program (SNAP), better known under its former name, the Food Stamp Program (FSP)(* 2). FSP provides financial aid to low income households to enable them to obtain adequate amounts of quality food. Although FSP is a nationwide entitlement program funded at the federal level, it is administered at the state level. (* 3)
In the years leading up to the crisis, the number of households receiving FSP benefits in Indiana had been rising very slowly. A distinct increase occurred in the summer of 2008, when gasoline prices exceeded $4.00 per gallon and the first signs of the financial crisis became visible. A few months later, the financial crisis unfolded, increasing the number of households receiving FSP benefits. The demand peaked in October 2008 and increased gradually thereafter, eventually reaching about 381,000 households and 878,000 persons in March 2011 (Figure 2).
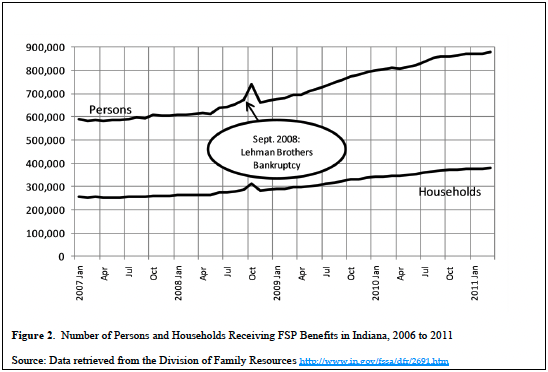
Figure 2. Number of Persons and Households Receiving FSP Benefits in Indiana, 2016 to 2011
Just as the number of households receiving food stamp benefits increased as the financial and economic crisis unfolded, so did the total benefits issued (Figure 3). The peak of $74 million in October 2008 coincided with the peak in FSP recipients. The sharp and sudden increase in April 2009 was, however, due to the American Recovery and Reinvestment Act (ARRA) that went into effect in April of 2009, which increased the benefits that households received.
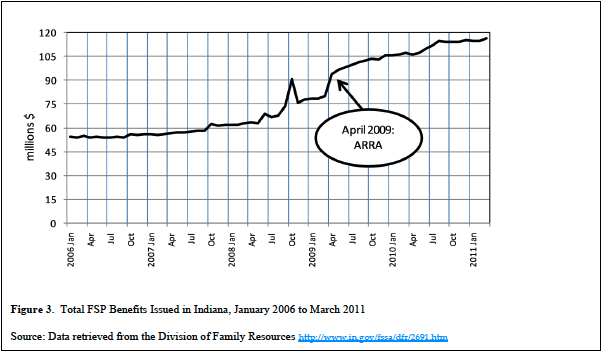
Figure 3. Total FSP Benefits Issued in Indiana, January 2006 to March 2011
While there is a close relationship between poverty and reliance on food assistance, not every household with an income below the poverty line chooses to use, or is eligible for, FSP benefits. Poverty status is only based on income. In contrast, food assistance eligibility is based on income and assets. As a result, some low-income households are ineligible for assistance. However, there are also some eligible households that do not receive food assistance. In many cases, this mismatch is due to barriers that keep households from applying for assistance although they meet the eligibility criteria. These barriers are of two types: (1) access barriers such as incomplete information, and (2) psychological barriers resulting from a stigmatization of welfare participation.
In 2008/09, only 45 percent of the Indiana households with incomes below the poverty level received FSP benefits, up from 41 percent in 2005/06. The most extreme gap between poverty and food assistance is found in Monroe County, home of Indiana University. In Monroe County, more than a quarter of the households were classified as below the poverty line; however, fewer than 4 percent received food assistance in 2005/06. In Tippecanoe County, home of Purdue University, the gap is also quite high. In both counties the reason for the mismatch between the figures for poverty and food stamp recipients is that the population includes a large share of students who tend to have little income and show up in the poverty statistics. In order to avoid student biases, the discussion below focuses on households with at least one person 60 years or older and on households with children under 18.
Households with Elderly Persons
Poverty among households with older people is less common than among the population as a whole. In 2008/09, poverty among the elderly in Indiana amounted to less than 10 percent compared to about 14 percent for all Indiana residents. Thus, it is not surprising that FSP participation rates for households with older persons are far below those for households without elderly persons (Figure 4).
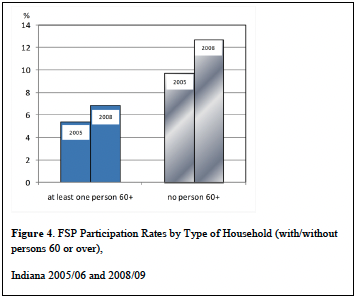
Figure 4. FSP Participation Rates by Type of Household (with/without persons 60 or over)
However, there is also some concern that a large portion of the elderly households do not apply for FSP benefits although they are eligible. The elderly may be a vulnerable group for whom access barriers such as information deficits and welfare stigma are insurmountable challenges. Elderly households are also eligible for other food assistance programs, in particular the Senior Farmers’ Market Nutrition Program (SFMNP) and the Elderly Nutrition Program. Because of these additional senior-targeted food assistance programs, low-income elderly households may not be as heavily dependent on FSP as households without older members.
As the economic situation in Indiana deteriorated at the end of the last decade, the number of elderly households that received FSP benefits grew substantially from about 40,000 in 2005/06 to about 53,000 in 2008/09. Part of that increase is due to the fast growth of the elderly population. However, a good deal of the increase is the result of increasing FSP participation rates: between 2005/06 and 2008/09, FSP participation rates grew from about 5.5 percent to 6.8 percent for elderly households.
Inside Indiana, there is considerable variation in FSP participation rates among the elderly. Table 1 shows the 2005/06 and 2008/09 FSP participation rates of elderly households for counties and county groups, (* 4) ranked by the 2008/09 rates.
In 2008/09, three counties – Clark County, located at the Ohio River; Morgan County, just south of Indianapolis; and Marion County – had reached very high FSP participation rates of over 10 percent in 2008/09, far above the Indiana average of 6.8 percent. The elderly in Lake, La Porte, Madison, and Vigo counties also rely heavily on food assistance. The three (predominantly rural) county groups with food stamp participation rates above the state average are located in the south and the southeast.
Between 2005/06 and 2008/09, 14 of the 25 counties and nine of the 23 county groups showed an increase in FSP participation rates. Even in some counties with a traditionally low demand for food assistance, food stamp demand has increased substantially. For example, in 2005/06 Hamilton, Monroe, and Floyd counties were the three counties with the lowest FSP participation among elderly households. By 2008/09, the FSP participation rate among elderly households had more than doubled in Hamilton County and more than tripled in Floyd and Monroe counties.
Of the places that experienced a decline in FSP participation rates, many already had low rates in 2005/06. However, there are five counties and six county groups – indicated in Table 1 – that had a declining FSP participation rate although poverty had increased between 2005/06 and 2008/09. This suggests that these are places where barriers may keep low income households with elderly persons from applying for food assistance. The elderly do not always demand more food assistance when poverty becomes more widespread. Quite the opposite seems to be the case. Many places with high poverty increases have only small increases or even declines in food stamp participation.
Households with Children
Households with children (* 5) deserve special attention because poverty prevalence is quite high for this group. In Indiana in 2008/09, almost 20 percent of children under 18 lived in households with incomes below the poverty line. Not surprisingly, food stamp participation among households with children is far above the state average. Children from households enrolled in the FSP automatically qualify for the National School Lunch Program. As a result, households with children may have an added incentive to apply for food stamp benefits. Moreover, access barriers and stigma may be more easily overcome when an adequate diet for children is at risk.
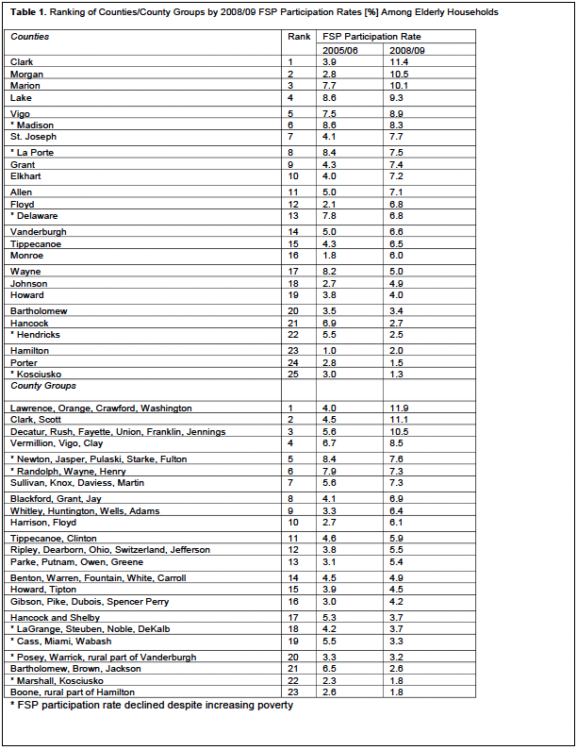
Table 1. Ranking of Counties/County Groups by 2008/09 FSP Participation Rates (%) Among Elderly Households.
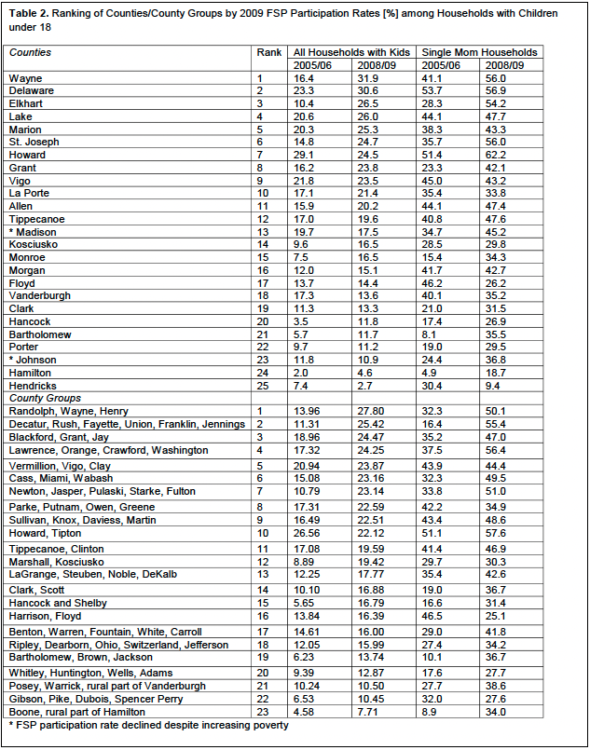
Table 2. Ranking of Counties/County Groups by 2009 FSP Participation Rates (%) Young Households with Children under 18.
Statewide, the number of food stamp benefits-receiving households with children rose by more that 33 percent between 2005/06 to 2008/09, from about 121,000 to 161,000. Participation rates increased from 14.9 percent to 19.4 percent.
A particularly needy sub-group is made up of female-headed households with children (no husband present). For this group of single-mom households, the reliance on food assistance has risen less than for all households with children. However, at 35 percent the percentage of single-mom households receiving food stamp benefits was already quite high in 2005/06 and increased even further to 42 percent three years later.
Within the state of Indiana, there is tremendous variation in food stamp assistance for households with children. Table 2 shows the 2005/06 and 2008/09 FSP participation rates of households with children for counties and county groups, ranked by the 2008/09 rates. At the low end are Hendricks County and Hamilton County, with FSP participation rates of less than 5 percent in 2008/09. At the upper end of the range are two eastern Indiana counties, Delaware County and Wayne County, where over 30 percent of households with children receive food stamp benefits. In total, five counties and five county groups have FSP participation rates exceeding 50 percent.
For single-mom households, the range is even wider. The lowest 2008/09 FSP participation rate among single-mom households is in Hendricks County, slightly under 10 percent. The highest rate is observed in Howard County where over 60 percent of single-mom households received food stamp benefits in 2008/09.
Between 2005/06 and 2008/09, very few places experienced a decline in FSP participation rates among households with children. The vast majority of counties and county groups had increasing food stamp participation rates and increasing poverty. This suggests that – for the most part – the demand for food assistance among households with children responds to changes in poverty status.
Conclusions
Since the onset of the financial and economic crisis in 2008, the demand for food assistance through the Food Stamp Program has increased substantially. As a result, an increasing flow of money was funneled to needy people and places in Indiana. The American Recovery and Relief Act further increased the total benefits issued since April 2009, and reached a high of over 116 million dollars in March 2011.
Participation in the food stamp program is low for households with persons over 60. It has risen since the start of the crisis, but not as much as one would expect based on the increasing poverty among the elderly households. In many places food stamp participation decreased despite growing poverty among the elderly.
For households with children, a different picture emerges. Their participation in the food stamp program was above the state average before the crisis and increased to 20 percent in the first year of the crisis. Within this group, single-mom households are a particularly needy target group. On average, almost a third relies on food stamp assistance, in many places reaching more than 50 percent.
Because the Food Stamp Program is a federal program, some aspects of the program are not under the control of the states. For example, the amount of monthly benefits an authorized household receives is calculated using federal guidelines. Nevertheless, states are responsible for the administration of the program. Thus, Indiana influences how well the program reaches needy people.
USDA encourages states to work towards increasing program participation among eligible households. In a 2008 study, Indiana was identified as a state in which participation is lower than what could be expected based on the characteristics of its residents. (* 6) The study suggests that elderly households in Indiana may be underserved by the program. Particular attention should be devoted to places where FSP participation among the elderly has declined since the onset of the economic crisis while poverty increased.
* 1 Unless otherwise stated, the data for this report was taken from the 2000 US Census and the American Community Surveys, 2001 to 2009.
* 2 In this report we will use the name ―FSP‖ rather than ―SNAP‖ because some of the data refer to the time prior to the name change and because the Indiana state government has not yet consistently adopted the new name.
* 3 The federal government pays for FSP benefits in their entirety and for 50 percent of the administrative costs. In Indiana, FSP is administered by the Division of Family Resources: http://www.in.gov/fssa/dfr/2691.htm
* 4 For small counties, the US Census Bureau only releases estimates for county groups.
* 5 Children under 18.
* 6 Cody, S., A. Schirm, E. Stuart, L. Castner, and A. Zaslavsky (2008, March). Sources of Variation in State-Level Food Stamp Participation Rates. Food Assistance and Nutrition Research Report (37).
![]()
![]()
![]()
![]()
![]()
