Where’s the Inflation?
June 5, 2019
PAER-2019-01
Author: Larry DeBoer, Professor of Agricultural Economics
![]()
![]()
![]()
![]()
![]()
The United States economy is at capacity, with an unemployment rate near 50-year lows. In the past such low unemployment resulted in rising inflation. In our time, though, the inflation rate has remained near 2%. It has not increased. So, “Where’s the inflation?”
Why should we expect inflation?
Resources are limited. There are only so many people available to work, so much land available to plant, so many minerals available to mine and so many machines available to run. Sometimes the economy does so well that all of our resources are in use. The economy is at capacity. We’re producing at “potential output.”
Now, suppose we try to produce more anyway. Suppose spending by consumers, businesses or the government increases beyond the economy’s potential output. Businesses see the opportunity and try to respond by using resources that they would not ordinarily use. They plant crops on less productive land, or bring obsolete machinery back into production. They try to out-bid their competitors for land, minerals or equipment.
Businesses hire less qualified or inexperienced workers that they would not ordinarily hire. They tell their HR departments to make extraordinary efforts to find workers. They offer training, moving expenses, or transportation. They raise wages and offer better benefits. They try to attract workers from competitors, or entice them out of school, retirement or the home.
All of these efforts raise the costs of resources. Businesses pass at least some of these higher costs to their customers in higher prices. That’s inflation. Inflation results when we try to produce beyond capacity.
We can measure capacity with the unemployment rate. The unemployment rate is the number of people without jobs but who are searching for work, as a percentage of the labor force, which is the sum of employed and unemployed people. The “natural rate” of unemployment is the rate when the economy is at capacity. The natural rate of unemployment is usually thought to be in the neighborhood of 5 percent. It’s greater than zero because it takes time for job seekers to find open jobs and employers with open jobs to find job seekers. They will find each other, though, because at capacity there’s a job opening for every employee.
Let’s measure inflation using the Consumer Price Index without food and energy, to take out the fluctuations from food and oil prices. That’s called the “core” inflation rate. Figure 1 shows the annual unemployment and core inflation rates. The solid red line is the unemployment rate, and the dotted blue line is the core inflation rate. The gray bars mark recessions from beginning to end (peak to trough).
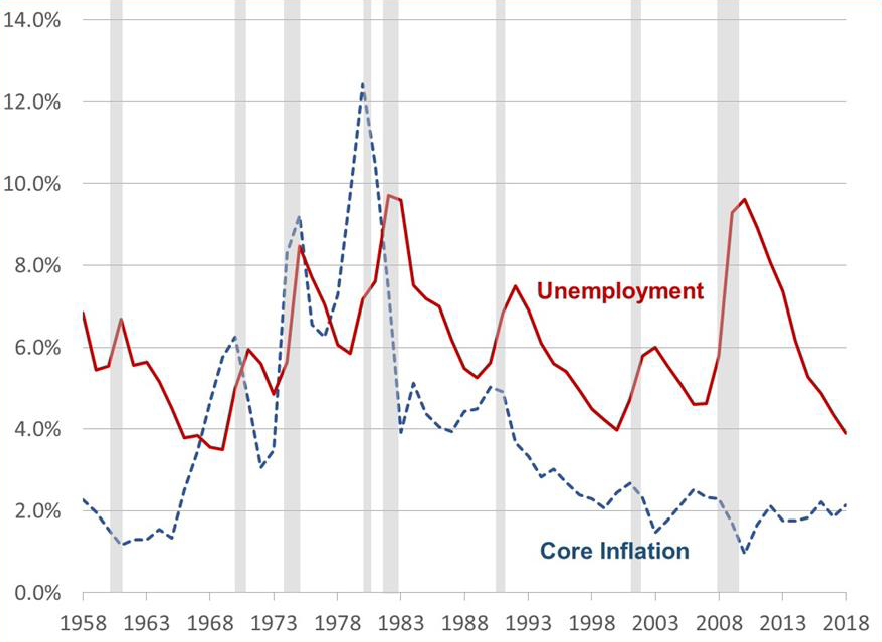
Figure 1. Unemployment Rate and Core Inflation Rate, annual, 1958-2018
When the unemployment rate rises, the inflation rate tends to fall. You can mark those events with the gray bars, which show the recessions. The core inflation rate fell during or immediately after every recession since 1958.
Expansions are the periods between recessions. The unemployment rate falls during expansions. Inflation tends to rise, especially towards the end of expansions, when the unemployment rate gets low.
Table 1 uses this same data on a monthly basis. It shows the level of the unemployment rate in the columns, and the average change in the core inflation rate for different time periods in the rows. Core inflation is measured as the percent change in the price index over the previous 12 months, and the averages are multiplied by 12, to show what would happen if the unemployment rate remained at a particular level for a year.
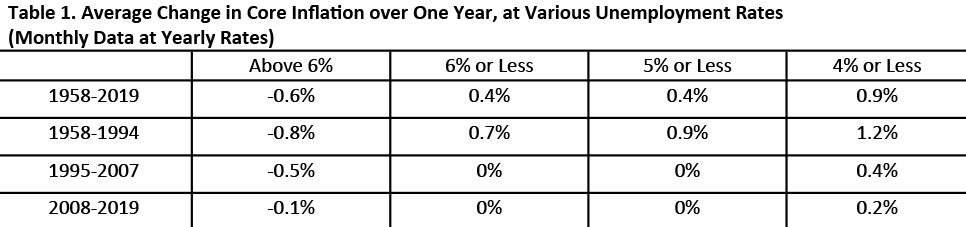
Table 1. Average Change in Core Inflation over One Year, at Various Unemployment Rates (Monthly Data at Yearly Rates)
Over the whole 1958-2019 period, when the unemployment rate was above 6%, the inflation rate went down. When the unemployment rate was below 6%, the inflation rate went up. When the unemployment rate was below 4%, the inflation rate went up more. When labor is plentiful, prices rise more slowly; when labor is scarce, prices rise more quickly. Inflation rises when the economy is above potential output.
The unemployment rate has been at or below 5% since December 2015. That’s 40 months, 3 and one-third years. Based on the 62-year average, the core inflation rate should have increased 0.4% per year, from 2.1% in December 2015, to 3.4% in April 2019.
Why has inflation remained low?
But it didn’t. The 12-month core inflation rate was 2.1% in December 2015, and 2.0% in April 2019. The economy is at capacity or beyond, and inflation has remained stable. Why has inflation not increased? Here are some possible reasons.
Maybe the “Phillips Curve” is dead?
“Phillips” was A.W. Phillips, a New Zealand-born economist who famously plotted the relationship between the unemployment rate and the inflation rate of wages in 1958. The plot had a downward slope. Lower unemployment made for higher wage increases. Then the U.S. economy traced out a perfect Phillips relationship from 1961 to 1969 (Figure 2), plotted with price inflation instead of wage inflation. After that the Phillips Curve didn’t turn out to be so stable, but the downward slope remained.
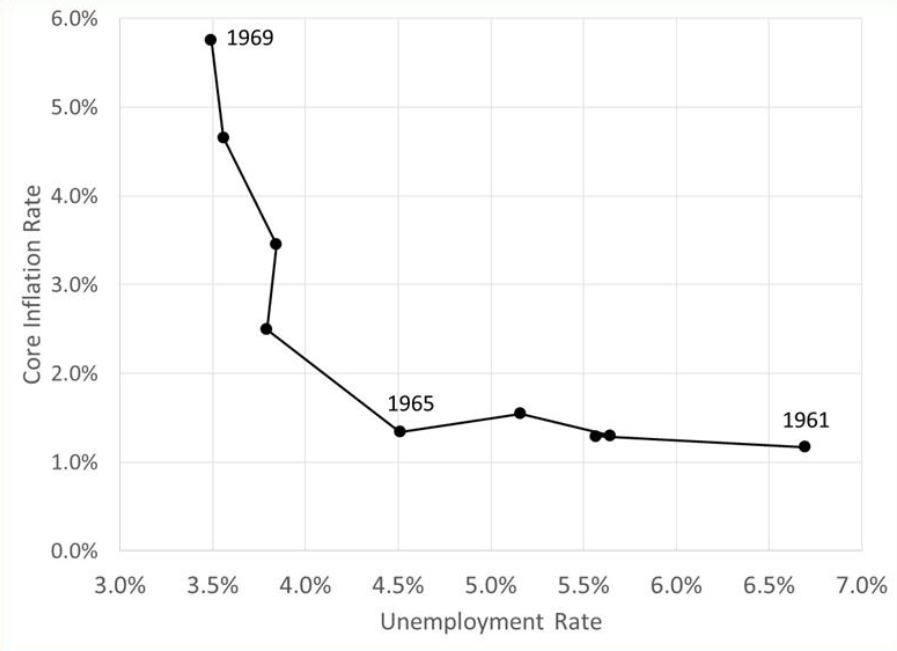
Figure 2. Phillips Curve: Unemployment Rate and Core Inflation Rate, 1961-1969
The data in Table 1 for 1958 through 1994 are evidence for the downward slope of the Phillips Curve. During those years unemployment rate above 6% caused relatively large declines in inflation, and lower unemployment rates caused increasing inflation, more-so when the unemployment rate was really low.
However, since 1995 there has been little response of inflation to low unemployment, except at the very lowest unemployment rates. Declines of inflation during high unemployment have been less marked as well. The Phillips Curve has flattened. Maybe it’s dead. Maybe the old relationship between unemployment and inflation is no more.
Recent research suggests that the Phillips Curve isn’t dead, it’s just hibernating. Economists Hooper, Mishkin and Sufi think that stabilizing policies by the Federal Reserve have held inflation in check, masking the underlying Phillips Curve inflation response to unemployment. They examined state and local data on inflation and unemployment, and found evidence for the downward slope.
If the Phillips Curve is alive and well, though, why has low unemployment not caused rising inflation?
Maybe we’re not at capacity?
There may be more employees available to hire, even with the unemployment rate at 3.6%. If so, businesses could find more employees without extraordinary and costly efforts, and without having to raise pay. There would be no higher costs to pass on in higher prices. Inflation would not increase.
Labor force participation measures the percentage of the employable population who are working or looking for work. If more workers returned to the labor force and got jobs, the number of unemployed people would remain the same, but the labor force would increase. Since the unemployment rate is the number of unemployed people as a percentage of the labor force, the unemployment rate would go down. Lower unemployment would not be associated with higher inflation.
Labor force participation is much lower now than it was before the Great Recession of 2007-2009. It was 62.8% in April 2019. At the end of the last expansion, in December 2007, it was 66.0%. There seem to be workers on the sidelines who could come back to work.
In December 2015, when the unemployment rate hit 5%, the labor force participation rate was 62.7%. The rate has edged up by a tenth. That’s not enough to explain stable inflation.
Besides, wages are rising faster. Average hourly earnings were increasing 2.5% per year in December 2015. As of April 2019, they had risen 3.4% from a year before. This is just what we’d expect if labor was scarce. A.W. Phillips’ original curve, which plotted unemployment with wage inflation, is alive and well. This is evidence that the economy is at capacity and thus it does not explain why inflation has remained low.
Maybe productivity is rising?
Labor is scarce and becoming more expensive. Businesses might respond by adopting labor-saving technology, to maintain or increase production with their existing employees. Automation would increase productivity, which is a rise in output per employee. With rising productivity businesses would not have to raise prices to cover higher labor costs. Sales of added output would generate the needed revenue. Rising productivity would hold inflation down.
This happened in the second half of the 1990’s. Unemployment was below 5%, wages were rising by 4% per year, but inflation continued to fall until late in the decade (Figure 1). The information technology revolution caused an increase in output per worker. Wages rose more rapidly, but inflation remained low.
Figure 3 shows the percentage change in real gross domestic product per employee, quarterly at annual rates from 1995 to 2019. Productivity growth averaged 2% per year from 1995 to 2006, but since then has averaged only 0.9% per year. In the past two-and-a-half years, however, productivity growth has been increasing. As the unemployment rate dropped under 5%, and wage growth increased, productivity also began to grow faster. So, rising productivity growth may be one reason why inflation has not increased.
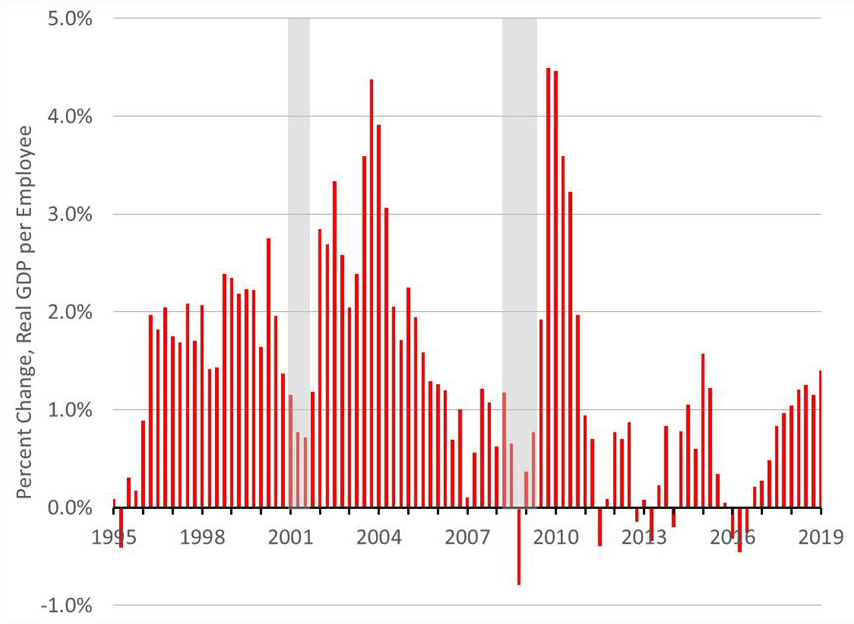
Figure 3. Productivity Growth. Percent Change in Real GDP per Employee, Annual Rate.
Maybe profits are lower?
Resource costs are rising. Businesses could hold inflation down if they are willing to take lower profits rather than raise prices.
One measure of profit margins is corporate profits before tax as a share of corporate value added, from the Gross Domestic Product accounts. It fell from 2014 to 2015, but since then has remained relatively stable. Profits do not appear to have dropped since unemployment fell below 5% and wage growth picked up. But, profits after taxes rose considerably after the December 2017 tax cut, however.
Maybe imports are up?
Imported goods compete with domestically produced goods. If the prices of domestic goods began to rise, perhaps businesses and consumers would turn to less expensive imported goods. Consumers would pay lower prices, both because imports themselves were cheaper, and because import competition would discourage domestic businesses from raising prices. Either way, inflation would be lower.
Imports as a share of GDP grew rapidly during the 1990’s and 2000’s. Perhaps this contributed to the low inflation after the mid-1990’s. But imports were 14.9% of GDP in the fourth quarter of 2015, and are 14.9% in the first quarter of 2019. Imports have not risen above the overall growth rate since the unemployment rate dropped below 5%.
Imports are affected by trade disputes and tariffs. Prices of domestic goods may play a small part in fluctuations of trade. Still, there’s no evidence in these numbers that rising imports have held inflation down in recent years.
Maybe it’s stable inflationary expectations?
The Federal Open Market Committee’s policy statement usually includes a phrase like this one from May 1, 2019:
On balance, market-based measures of inflation compensation have remained low in recent months, and survey-based measures of longer-term inflation expectations are little changed.
Concern about inflationary expectations goes back to the “wage-price spiral” of the 1970’s. Businesses anticipated that inflation would raise costs, so they raised their prices. Workers and other resource suppliers anticipated higher prices, so they raised their wage and resource costs. Everyone’s expectations were confirmed. Business costs did rise, consumer prices rose too. Expectations of inflation continued, and were themselves a cause of actual inflation.
As of 2019 inflation has been low and stable for a long time. Annual core inflation rates have been within one percentage point of 2% in all but one year since 1996, a two decade run of stable inflation. As a result, people expect stable inflation to continue at a rate near 2% per year.
Inflationary expectations can be measured by comparing the Treasury bond yields to inflation-indexed Treasury bond yields. The difference between the two is the inflation rate that bond holders expect. Expected inflation has varied within seven-tenths of 2% every month since the end of the recession.
The University of Michigan surveys consumers about their expectations every month. This measure shows more variation, but expected inflation was 2.6% in December 2015, and 2.5% in March 2019.
There is no evidence that people are expecting higher inflation with the economy at capacity. This eliminates a possible source of inflation.
OK, Why Does Inflation Matter?
It matters to the Federal Reserve. The Federal Reserve has a dual mission, to keep inflation and unemployment low. The Fed’s inflation target is 2%. If they expect inflation to rise much above 2%, they will act to restrain borrowing and spending by raising interest rates. Since it takes 6 months to a year for higher interest rates to slow the economy, they must act in advance. They need to know when to anticipate rising inflation.
The Fed estimates the natural rate of unemployment for this reason. If the actual unemployment rate falls below the natural rate, then rising inflation is to be expected, and interest rates should be raised. The Fed’s estimate of the natural rate was 4.5% in mid-2018 (Bernstein). The unemployment rate is now well below that rate, and inflation has not increased. In an April 22, 2019 interview with the Wall Street Journal, Chicago Federal Reserve Bank president Charles Evans said the low inflation made him “wonder if the natural rate of unemployment might be even lower than my current assessment of 4.3%. At 3.8%, we’re running just a little bit below that but it’s not causing any difficulties.” Since inflation has not appeared, Fed officials appear to be reducing their estimates of the natural rate.
During the low unemployment in the second half of the 1990’s, Alan Greenspan’s Fed famously did not increase interest rates as unemployment fell. They gambled that more rapid productivity growth would keep inflation low. It did.
Now the Fed appears willing to make a similar gamble. Unemployment is 3.6%, below any estimate of the natural rate of unemployment. Chairman Powell has said that the Fed does not intend to increase interest rates in 2019.
If productivity growth and stable inflationary expectations hold inflation down despite low unemployment and rising wages, we’re right to keep interest rates low. We can have low unemployment and low inflation at the same time. But if we’re wrong, and low unemployment does cause rising inflation, we may need higher interest rates and much slower growth to bring it down.
References:
Appelbaum, Binyamin. “Fed Signals End of Interest Rate Increases,” The New York Times, January 30, 2019.
Bernstein, Jered. “Why would the Fed want to raise the unemployment rate a full percentage point?” The Washington Post, June 18, 2018.
Federal Reserve Press Release, May 1 2019. www.federalreserve.gov/monetarypolicy/ fomccalendars.htm
Hooper, Peter, Frederic S. Mishkin, Amir Sufi, “Prospects for Inflation in a High Pressure Economy: Is the Phillips Curve Dead or is It Just Hibernating?” NBER Working Paper No. 25792, May 2019
Ip, Greg. “Looking for Mr. Phillips,” The Wall Street Journal, May 3, 2019. Reporter Greg Ip plots the Phillips Curve with wage inflation on the vertical axis, 2009-19. The curve slopes downward.
“Transcript: WSJ Interview with Chicago Fed President Charles Evans,” The Wall Street Journal, April 22, 2019.
Data are from the Federal Reserve Economic Data (FRED) website, fred.stlouisfed.org.
![]()
![]()
![]()
![]()
![]()