Why Farm Land Assessments Will Continue to Rise
April 23, 2012
PAER-2012-01
Larry DeBoer, Professor
![]()
![]()
![]()
![]()
![]()
Introduction
Property taxes on farm land have been rising and will continue to rise in the future. This is because the “base rate” of farm land, which is the statewide starting point for farm land assessed values, has been rising and will keep rising. But now, for the first time in decades, the “soil productivity factors” might rise as well. This could make the increase in farm land taxes even larger.
The assessed value of farm land is the product of the base rate, the soil factor, and (for some acreage) an “influence factor.” Farm land assessments in Indiana start with a base rate, which is a dollar amount per acre. This same starting point is used for all acreage in Indiana. The base rate is set by the state’s Department of Local Government Finance (DLGF), the agency that oversees the operation of the property tax in Indiana. The base rate was $1,290 per acre for taxes payable in 2011. It will be $1,500 for taxes in 2012, and, the DLGF recently announced, it will be $1,630 for taxes in 2013. The rising base rate is the primary reason why farm land taxes have been increasing.
For each acre the base rate is multiplied by a soil productivity factor. The soil factor measures the productivity of the soil for growing corn, based on corn yields by soil type. For several decades the soil factors have varied from 0.5 to 1.28. That is, for 2012 taxes, the base rate times the soil factor could vary from $750 (0.5 x $1,500) to $1,920 (1.28 x $1,500). For taxes in 2013, however, the DLGF has announced new updated soil factors. The range for the new factors is 0.5 to 1.66. In 2013, then, the range of the base rate times the soil factor would be $815 (0.5 x $1,630) to $2,706 (1.66 x $1,630). The change in the soil factors would have caused an additional increase in farm land assessments for 2013 taxes. The Indiana General Assembly has required the DLGF to postpone the use to the new soil factors until 2014, however.
Some acreage is adjusted by an influence factor, which reduces the assessment for features that limit the productivity of the land. All influence factors are percentage subtractions from assessed value. For example, land that floods two to four years in every 10 receives a 30% influence factor. The assessed value of the acreage is reduced by 30%. Land that floods five or more years in 10 receives a 50% influence factor.
The farm land assessment provides the basis for setting the property tax bill. Farm land receives few deductions, so usually the full gross assessed value of the land is multiplied by the tax rate for the taxing district in which the land is located. A taxing district is defined by the combination of local government units that serve the area. It will include the county, township, and school corporation, and possibly a city or town, library district or other special district. The tax rates of the overlapping local governments sum to the tax rate of the district. That summed rate is multiplied by the assessed value to determine the tax bill. The tax rates are expressed in dollars per $100 assessed value, so they can be read as percentage rates.
Some counties have adopted local income taxes for property tax relief. Counties have the option of delivering tax relief to homeowners only, to homeowners and rental housing owners, or to all property owners. If the county distributes the relief to all property owners, farm land owners will receive a tax credit. A credit is a percentage reduction in the tax bill. The local units lose this property tax revenue, but it is replaced dollar-for-dollar with revenue from the local income tax.
Finally, some farm land benefits from the new tax caps, also called “circuit breaker caps.” Farm land tax bills are limited to 2% of the gross assessed value of the farm land. That’s the assessment before deductions, (though farm land gets few deductions). If the tax bill exceeds 2% of the gross assessed value, a tax cap credit is applied to reduce the tax bill to the cap level. Farm land cannot be eligible for tax cap credits if the district tax rate is less than $2 per $100 assessed value. As it happens, most rural areas have tax rates less than $2, so very little farm land benefits from the tax caps.
The History of the Base Rate
Figure 1 shows the history of the base rate since 1980. Property is assessed in one year and taxed the next. Taxes are often identified as (for example) “2011 pay-2012,” meaning the assessed value set in 2011 was the basis for tax bills in 2012. The years in Figure 1 are “pay-years,” the years when the taxes were paid. From before 1980 through taxes in 2002, the base rate was negotiated by agricultural interests (such as the Farm Bureau) and officials from the State Board of Tax Commissioners, the predecessor of the DLGF. Base rates were revised only in years of statewide reassessments—for taxes in 1980, 1990, and 1996. For 1980 through 1989 the base rate was set at $450 per acre. In 1990 the base rate was increased to $495 per acre, and it was left at $495 for the 1996 reassessment. It remained at that level until pay-2003.
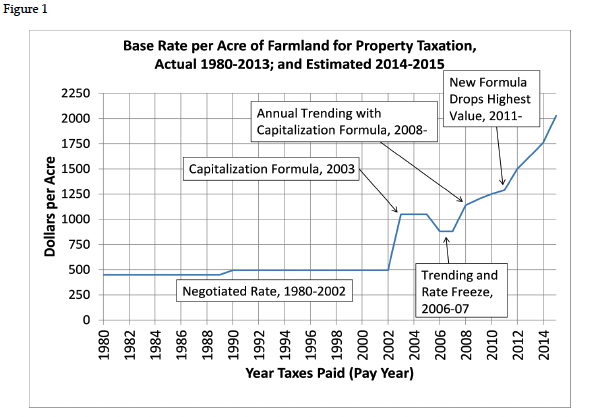
Figure 1. Base Rate per Acre of Farmland for Property Taxation, Actual 1980-2013; and Estimated 2014-2015
In December 1998 the Indiana Supreme Court found the state’s assessment system to be unconstitutional, because assessments were not based on objective measures of property wealth. For most property, this was interpreted to mean that assessments had to be based on market values, meaning the predicted selling prices of property. The court allowed farm land to be assessed at its use value, meaning its value for production of crops, not including its potential value for residential or business development.
The court’s requirement for objective measures of property wealth still applied to the use value of farm land, so the Tax Board and then the DLGF developed the base rate capitalization formula. The formula uses objective data on prices, yields, costs, and interest rates in a capitalization formula. Income capitalization is a recognized method for measuring wealth.
The initial formula set the base rate at $1,050 per acre for taxes in 2003. The base rate had been $495, so it more than doubled, and this caused farm land property taxes to rise substantially with the 2003 reassessment. Tax bills on farm land and buildings increased an average of 15.5% statewide. Farm land tax bills increased much less than assessed values because most other assessed values increased with the reassessment. This reduced tax rates. Higher farm land assessments times lower tax rates still produced tax bill increases for farm land owners.
The court decision implied a need for annual adjustments of assessed values to keep them close to objective measures of property wealth between statewide reassessments. This is known as “trending.” Farm land is trended with annual changes in the base rate. The DLGF simply inserts new data on yields, prices, costs, and interest rates into the capitalization formula to come up with an updated value. Trending started for farm land for taxes in 2006, and the base rate dropped to $880. Legislative action held the base rate at $880 for taxes in 2007 as well.
It was in pay-2008 that the big increases in the base rate began. A look at the base rate capitalization formula shows why.
The Base Rate Capitalization Formula
The base rate capitalization formula divides the rent or net income earned from a farm acre by an interest rate, to get the amount that a “rational” investor would pay for that acre. Versions of the income capitalization method are used in most states to estimate farm land assessed values. The general form of the method is:
Capitalized Value = Net Income from Agriculture / Capitalization Rate.
For example, for 2008 the DLGF estimated that a landowner could earn an average of $165 per acre in rent or as an operator growing corn or beans. The Chicago Federal Reserve reported several farm-related interest rates that averaged 6.56%. The net income divided by the interest rate is $2,508.
Imagine an auction for an acre that earns $165. Suppose the first bid is $1,000. Earnings of $165 on an investment of $1,000 give a rate of return of 16.50%. That’s much higher than the 6.56% return that can be earned on investments generally. The bid rises to $2,000, a rate of return of 8.25%, which is still high. At a bid of $2,508 the rate of return is no better or worse than other investments. A rational investor would not bid more.
Note that this is a calculation of the “use value” of the farm land because it considers only the income that can be earned from growing and selling crops. Potential income from residential or commercial uses is excluded.
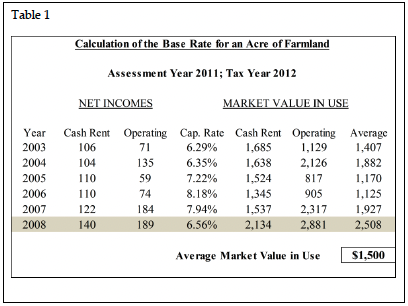
Table 1. Calculation of the Base Rate for an Acre of Farmland
Table 1 shows the calculation of the $1,500 base rate done for pay 2012. This is a version of a table published by the DLGF. The method capitalizes cash rent net incomes and estimated operating net incomes for each of six years and then averages the two results to get an average market value in use for each year. The cash rent data originates with the Purdue Land Value Survey. The operating net incomes are estimated from corn and soybean yield and price numbers, less fixed and variable costs. The base rate calculation uses data for six years to smooth out wide fluctuations in the base rate. The highest value of the six is dropped, and the remaining five are averaged and rounded to the nearest ten. The result is the base rate, which the DLGF calls “average market value in use.”
There is a four-year lag in the data used. The base rate for taxes in 2012 uses data only through 2008. The four-year lag emerged between 1998 and 2003, when the statewide reassessment was postponed after the Supreme Court’s 1998 property assessment ruling. This means that the 2012 base rate is still influenced by income and capitalization rates from 2003, nine years before. The numbers for 2008 still will have an effect on the base rate in 2017.
The base rate is a six-year rolling average. Changes in annual values of the base rate occur because an earlier year is dropped and a later year is added to the calculation. Table 2 illustrates the effects of the rolling average. The base rate for 2012 taxes used data from the years 2003 to 2008. The base rate for 2013 taxes will use data from 2004 to 2009. The base rate will change because the results for 2003 will be dropped, and the results for 2009 will entered.
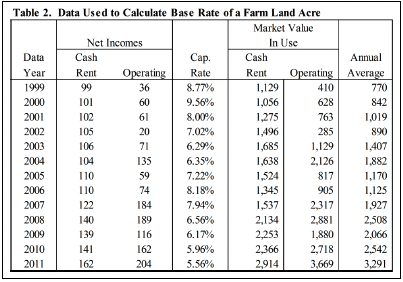
Table 2. Data Used to Calculate Base Rate of a Farm Land Acre
As Table 2 shows, rents and operating incomes were lower in 2003 than they were in 2009. The capitalization rate was slightly higher in the earlier year, too. So the average of the rent and operating income capitalized values for 2003 was $1,407, while it was $2,066 in 2009.
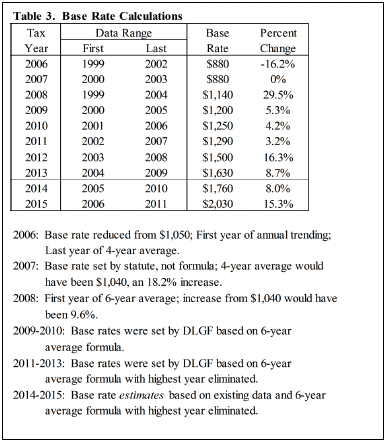
Table 3. Base Rate Calculations
Table 3 shows the result. The smaller 2003 value was dropped from the average, and the larger 2009 value was added, so the base rate increased.
The DLGF drops the highest value of the six years from the average. The Indiana General Assembly adopted this modification of the formula for taxes in 2011, to make the increases in the base rate somewhat smaller. Prior to 2011 all six years were included in the average. The 2008 value of $2,508 happens to be the highest for both the pay-2012 and pay-2013 base rate calculations. It is dropped from the average. For 2013 taxes the earlier 2003 figure of $1,407 leaves the average, and the newer 2009 figure of $2,066 enters. The base rate will increase from $1,500 for pay-2012 to $1,630 for pay-2013.
This modification in the formula has reduced the increases in the base rate. Had the old method of including all six years in the average been used for 2011, the base rate would have been $1,400 instead of $1,290. The base rate in 2012 would have been $1,670 instead of $1,500, and the base rate for 2013 would have been $1,780 instead of $1,630. The formula modification has reduced the base rate by 7% to 10%.
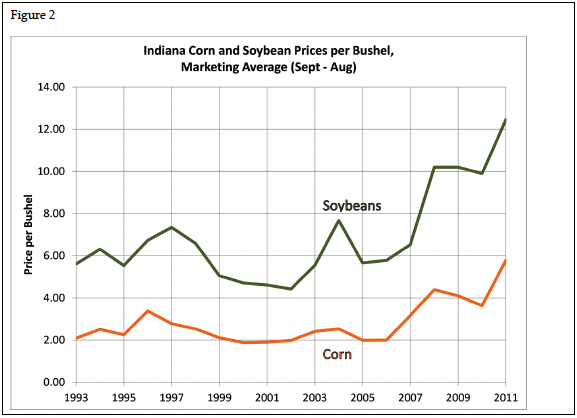
Figure 2. Indiana Corn and Soybean Prices per Bushel, Marketing Average (Sept-Aug)
The base rate increases since 2008 are partly the result of falling interest rates. The Federal Reserve has reduced the interest rates it controls in an effort to lessen the effect of the Great Recession. The base rate increases also are the result of increases in rents and operating net income. These increases result mostly from rising commodity prices. Figure 2 shows corn and soybean prices that are used in the base rate formula. Prices increased in 2003 and 2004, and again in 2007, 2008, and 2011. The 2003 prices entered the base rate formula for taxes in 2007. The 2007 prices entered the base rate formula for taxes in 2011. Table 2 shows big increases in the capitalization calculations starting in 2007, with a capitalized value of $1,927. The increase in 2011, to $3,291, was also large. Higher commodity prices are a primary reason.
The DLGF has announced the base rate for taxes in 2012 as $1,500 and the base rate for 2013 taxes as $1,630. However, because of the four-year data lag, it is possible to predict the base rate for taxes in 2014 and 2015. The 2014 base rate will include data from 2010; the 2015 base rate will include data from 2011. We know the data for 2010 and most of the data for 2011 (see Table 2). We also know the base rate formula, so base rate predictions should be accurate.
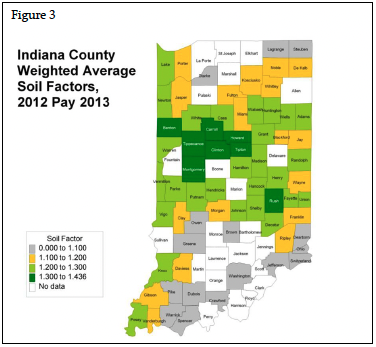
Figure 3. Indiana County Weighted Average Soil Factors, 2012 Pay 2013
Table 3 shows the predicted base rates for 2014 and 2015. For 2014, the base rate is likely to rise by 8.0% to $1,760. For 2015, the base rate is likely to rise another 15.3% to $2,030.
The Fed has pledged to hold interest rates low at least through the end of 2014. Low interest rates from 2014 would enter the base rate formula for taxes in 2018 and remain in the formula through 2023. The high prices of 2007 will remain in the base rate formula through 2016; the high prices of 2011 will still be affecting the base rate in 2020. Farm land owners should expect the base rate to remain high through the end of this decade, at least.
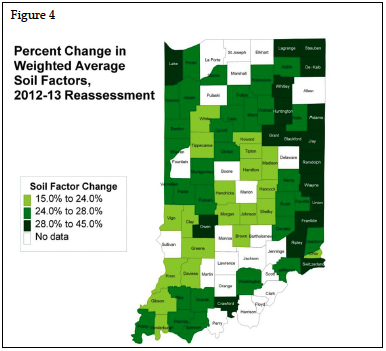
Figure 4. Percent Changes in Weighted Average Soil Factors, 2012-13 Reassessment
Soil Productivity Factors
The base rate provides the statewide average assessment per acre. But some acreage is more valuable, some is less valuable. According to the 2011 Purdue Farmland Value Survey, in June 2011 the highest valued land in Indiana was in the West Central region, with a top land value of $7,443 per acre. The lowest valued land in Indiana was in the Southeast region, with a poor land value of $2,895 per acre.
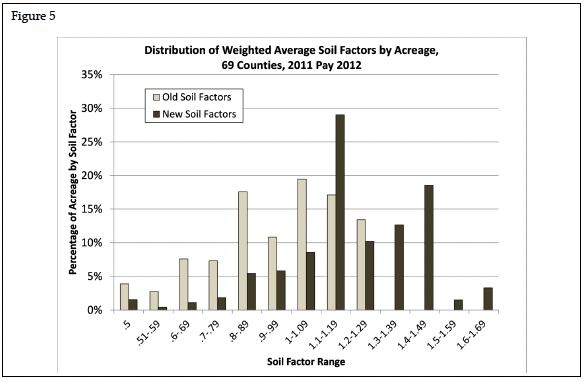
Figure 5. Distribution of Weight Average Soil Factors by Average, 69 Counties, 2011 Pay 2012
For farm land assessments to reflect property wealth, as the Supreme Court requires, farm land assessments must vary with land values across the state. The soil productivity factors provide this variation. Each acre of farm land in Indiana has been assigned a soil type, and the soil types have been assigned productivity factors. According to the DLGF’s 2011 assessment guidelines, these factors are based on properties of the soil, such as slope, moisture holding capacity, organic matter content, and several other properties that affect corn yields. The factor is multiplied by the base rate as part of the calculation of assessed value.
Indiana is undertaking a statewide reassessment, which will be completed for taxes in 2013 (pay-2013). As part of this effort, the DLGF requested new soil productivity factors from the U.S. Department of Agriculture’s Natural Resources Conservation Service. In a February 2, 2012 memo, the DLGF announced its intention to introduce these revised soil factors for pay-2013. The old factors ranged from 0.5 to 1.28. The new factors range from 0.5 to 1.66.
Data provided by the Indiana Legislative Services Agency allowed the calculation of weighted average soil factors for 69 counties. Each acre has a soil factor based on its soil type. County averages are calculated by summing the factors and dividing by the number of acres. The result is a “weighted” average because it accounts for the number of acres with each soil factor. Soil factors that apply to a large amount of acreage count more in the average. The weighted average old soil factor is 0.958, while the weighted average new soil factor is 1.203. The average soil factor increases by 25.5%.
The map in Figure 3 shows the soil type averages in four categories for the 69 counties with available data. The soil factors do appear to reflect corn yields in Indiana. Yields and soil factors are highest in the West Central region and lowest in the Southeast region.
Figure 4 shows a map of the percentage changes in the county-weighted average soil factors. The county average soil factor increases vary from 17.1% in Morgan to 40.5% in Jay. The biggest increases are mostly in the counties in the eastern third of the state.
Figure 5 shows the distribution of old and new soil factors based on acreage in 2011 pay 2012. Under the old soil factors, half of all acreage had factors under 1.0, and half had factors of 1.0 or more. Under the new soil factors, only 17% of acreage have a factor less than 1.0, 48% have factors between 1.0 and 1.3, and 36% have factors of 1.3 or more.
This increase in the soil factors is problematic. Certainly yields continue to increase, and the soil factors may reflect these increases. But the base rate already includes the average yield statewide, implicitly in the rents, explicitly in the calculation of operating income. As yields rise year after year, so does the base rate. If the soil factors also increase, the rise in yields is double-counted in assessed values. The soil factors would have to average near one to avoid this double-counting.
The DLGF’s assessment guidelines state that “The productivity factor for a soil map unit is calculated by dividing the estimated 10-year average corn yield (calculated in bushels per acre) by 100.” The old soil factors originated about 30 years ago, at a time when the average corn yield per acre was approximately 100 bushels per acre. This may explain why the old factors varied around one (see Figure 5). Average bushels per acre are now well over 100 bushels per acre, which may explain why the new factors vary around 1.2.
In March the Indiana General Assembly passed Senate bill 19, section 9 of which requires the DLGF to postpone the use of the new soil factors from pay-2013 to pay-2014. The old soil factors must be used for taxes in 2013. It is expected that the effects of the new soil factors will be reviewed by one of the legislature’s summer study committees.
Property Tax Bills
The Indiana Legislative Services Agency (LSA) provides estimates of the effect of assessment changes on tax bills by property type. The base rate is rising from $1,290 to $1,500 for taxes in 2012, a 16.3% increase. LSA estimates that agricultural business tax bills—including farm buildings and land—will rise by 11.4%. The base rate will increase another 8.7% to $1,630 for taxes in 2013. LSA estimates that the agricultural business tax bills will rise another 5.3% in 2013.
In each year the increase in tax bills is less than the increase in the base rate. This is partly because the assessments of farm buildings will increase less than the assessment of farm land. In most cases tax bills rise by less than the base rate increase because other property also will see increases in assessed values. Farm land assessments rise more, so agricultural tax bills will rise more than bills on other property types.
LSA’s estimates were made before the DLGF announced the new soil productivity factors. The new factors represent a substantial increase over the old factors, 25.5% on average. LSA has estimated that the introduction of the new soil factors in pay-2013 would increase farm land property taxes by 18.5%, in addition to the increase from the rise in the base rate.
The new soil factors would decrease the tax bills of all other property types. Higher valued farm land means agriculture would pay a larger share of the statewide property tax bill. Other taxpayers would pay a smaller share. Farm land makes up a small share of statewide assessed value, so the decreases in other taxpayers’ bills would be small. LSA estimates that average homeowner tax bills would fall 1.2% and average business real property tax bills would fall 0.7%. In addition, average property taxes on farm buildings would fall 4.6%.
The overall increase in agricultural tax bills from the rising base rate and revised soil factors would be substantial. Implementation of the new soil factors has been postponed by the General Assembly. The factors will be studied and possibly modified before they become effective. But the base rate increases will occur unless there is a change in the capitalization formula. The General Assembly made such a change for pay-2011, but there was no further modification considered in the recently concluded 2012 session. Farm land owners should plan for higher property taxes, probably for the rest of the decade.
References
Dobbins, Craig L. and Kim Cook. “Indiana Farmland Market Continues to Sizzle.” Purdue Agricultural Economic Report (August 2011) [www.agecon.purdue.edu/extension/pubs/paer/pdf/PAER8_2011.pdf]
Indiana Department of Local Government Finance. Certification of Agricultural Land Base Rate Value for Assessment Year 2012. (December 30, 2011) [www.in.gov/dlgf/files/111230_-_Certification_Letter_-_2012_Agricultural_Land_Base_Rate.pdf]
Indiana Department of Local Government Finance. Reference Materials for Valuing Agricultural Land for March 1, 2012. (December 2011) [www.in.gov/dlgf/files/Reference_Materials_for_2012_Ag_Land_Base_Rate.pdf]
Indiana Department of Local Government Finance. Soil Productivity Factor Update Memorandum. (February 2, 2012) [www.in.gov/dlgf/files/120202_Soil_Productivity_Factor_Update.pdf]
Indiana Department of Local Government Finance. “Understanding the Calculation of the Soil Productivity Index”, pp. 95-96 in chapter 2 of 2011 Real Property Assessment Guidelines. [www.in.gov/dlgf/files/2011_Chapter_2_Final.pdf]
Indiana General Assembly. Senate Enrolled Act No. 19. Second Regular Session 117th General Assembly (2012). [www.in.gov/legislative/bills/2012/SE/SE0019.1.html]
Indiana Legislative Services Agency. Property Tax Impact Report (December 2011). [www.in.gov/legislative/pdf/PropertyTax_Estimates_By_PropertyClass_20111231.pdf]
Indiana Legislative Services Agency. Soil Productivity Factors Memorandum. (February 15, 2012).
![]()
![]()
![]()
![]()
![]()
