Wind Farm Development Growing Across Indiana
June 23, 2011
PAER-2011-04
Joseph W. Longley, Graduate Student; Kevin T. McNamara, Professor; Larry DeBoer, Professor
![]()
![]()
![]()
![]()
![]()
Introduction
Indiana is home today to four utility-scale wind farms. There were none in 2006. In November 2010 there were 800 wind turbines in Indiana in Benton, White, and Randolph counties, with a total capacity of 1,339 Megawatts (MW) of energy. One MW (1,000 kilowatts) of wind energy can produce between 2.4 million and 3 million kilowatt-hours (kWh) annually to provide electricity for 240 to 300 households. Around 40% of all new-generation power added to the electric grid in the U.S. in recent years has been from wind farm projects. An additional 2,257 turbines are expected to be built in Indiana over the next few years, producing 4,065 MW of energy.
The installation and operation of new turbine projects can alter a local and the state’s economic landscape by creating new jobs, increasing land owners’ cash flows, and generating incremental tax revenue.
Wind Farm Background
A wind turbine consists of two primary components — a tower and a rotor. A tower ranges in height from 213 to 230 feet, with the rotor hub at the top. The rotor contains three pitched asymmetric-shaped blades that range in length from 130 to 160 feet. Wind circulates around the blades, causing them to revolve around the hub. A gearbox converts the blades’ speeds of about 18 to 20 rotations per minute to electricity-generating speeds of 1,000 to 1,800 rotations per minute. The energy generated by the turbine is transferred underground through a network of cables to the transmission grid and routed to the power grid.
Capacity is defined as the amount of potential energy a turbine can produce, while production is the amount of actual electricity output. The absence of wind, the shutdown of turbines, and other factors prevent the structures from operating at full capacity.
Wind energy is different from non-renewable energy sources because turbines do not use any limited resources such as oil and coal or emit any pollutants into the atmosphere. A utility-scale wind turbine can replace the emission of 5,000 tons of carbon dioxide into the atmosphere each year. Turbines operate best in conditions of an average wind speed of at least 13 miles per hour (mph).
A site with 15 mph average winds will produce nearly 54% more electricity than a location with 13 mph winds, a dramatic increase. Most wind turbines begin to create power at wind speeds of 9 mph and produce maximum power at 29 mph. At 56 mph, the turbines are turned off to prevent wind damage to the hub. While turbines may have a capacity of 2 or more MW, the electricity actually produced will be less than that, depending upon the wind.
Wind farm locations are based on the availability of land with limited visible infrastructure and its proximity to the electricity grid in addition to available average wind speed. A less extensive cable network has to be generated from the base of the turbine when it is located near the electricity grid. Land surrounding the individual turbines is not forfeited and can still be used as farmland or pastureland. A large-scale project requires that anywhere from 40 to 150 acres per MW be available. Less than 5% of the actual land area is taken up by the structure.
Proposed Project Costs
A proposed 100-turbine wind farm project to be constructed in 2011 in Indiana with each structure producing 2,000 KW (2 MW) would cost an estimated $400 million, or $2,000 per KW. A total of $302 million would be used for materials cost, and $98 million would be allocated towards construction labor. Annual operating costs for a 100-turbine farm would be $4 million, or $20 per KW. An estimated $2.1 million would be spent annually to purchase replacement parts and equipment and stock spare parts inventory. It costs $.056 per kWh to produce power using coal fired technology in certain regions of the U.S., while turbine technology in these same areas is estimated at $.068 kWh.
Economic Benefits
Economic benefits are derived from construction and operating activities, but also from fiscal policies (taxes) and royalty payments. In Indiana, turbines are subject to local property tax. Communities have the option of offering renewable energy companies abatements that reduce the taxable assessed value of business property. Counties may offer businesses a 10-year abatement of assessed value, with 100% of assessed value abated in the first year, 90% in the second year, and so forth.
Abatements have a particularly large effect on the taxable assessed value of personal property. This is because the taxable value of personal property depreciates rapidly. The large abatements in the first several years reduce taxable assessed value in the years when it is greatest. Taxable assessed value will have depreciated to 30% of its purchase value once the abatements expire at the end of 10 years.
The right to secure land for wind farms is primarily done through a leasing agreement. The owner of the wind farms may not own the land and pays a royalty for each turbine to the property owner. These payments are based upon land characteristics, project magnitude, and other characteristics. The royalty payments for recent projects have recently ranged as high as $10,000 per turbine. The average compensation in the late 1990’s was approximately $2,000 per turbine.
Direct economic effects are the activities associated with the construction industry for the installation of the turbines and the electric power generation, transmission, and distribution industry for the operation of them. This impact includes all jobs created within the two industries, employee wages, and economic output.
Indirect effects refer to the economic benefits derived by suppliers for their transactions with the primary industry. This includes manufacturers of the turbines, truckers, and their vendors.
The induced economic effects are the impacts associated with the purchases of households employed in the primary or secondary industries. The purchase of food, entertainment, automobile insurance, medical services, and other goods/services by employees associated directly or indirectly within the construction industry or electric power generation, transmission, and distribution segment make up the induced impacts. The economic activity associated with the royalty spending is spread relatively evenly over sectors: food services/drinking places, real estate establishments, and physicians, dentists, and other health practitioners.
The economic projections are generated using a system of multipliers and user-defined parameters. The JEDI Wind Model forecasts that an estimated 111 jobs would be created for a 1- to 2-year construction phase of the 100-turbine (200 MW capacity) project. Ninety-five of the positions would be labor-oriented, and 16 would be in engineering and professional services. The aggregate wages of these individuals would be approximately $6.1 million, and they would contribute $7.2 million in economic output. There would be 575 jobs attributed to the indirect impacts during the construction phase. The 575 employees would earn $28.4 million in wages and increase state gross domestic product by $81.8 million. There would be 160 jobs created due to the spending of the wages earned by employees hired for the turbine project during the construction period. These workers would earn collective wages of $6.2 million and create $19.4 million of economic output. The total impacts during the 1- to 2-year construction phase would be the creation of 846 jobs with earnings estimated at $40.6 million. The output generated during this period would be $108.4 million.
There would be 10 jobs created due to direct impacts of the operations phase on an on-going annual basis with the 100-turbine (200 MW capacity) project. The new hires would work for the wind power company and be employed as field technicians, administrative assistants, and management personnel. They would earn an estimated $580,000 in combined annual wages. Fourteen new employees would be hired earning a collective $620,000 in pay and contributing $5.2 million in economic output on a yearly basis due to the indirect effects. The spending of the wages earned by the operations workers would create 18 jobs on a continuing annual basis paying $700,000 in wages and creating $7.9 million in economic output. In summary, there would be 42 jobs created on an annual basis during the operations phase, with workers receiving $1.9 million in wages. Their collective economic output would be valued at $7.9 million each year.
The additional jobs would create a larger tax base for the state. Indiana would earn $1.4 million in incremental sales tax revenue and an additional $1.2 million in individual income tax revenue, totaling $2.6 million from the construction period. Once operations begin, the 42 workers will contribute approximately $69,698 in annual sales tax revenue, with their individual income tax estimated at $58,760 in 2011 dollars. The total attributed to operations on an annual basis is $128,457.
Conclusion
The development of a wind farm could stimulate the state’s economy by creating new jobs and increasing economic output. The technology is the world’s fastest growing energy source and does not deplete non-renewable resources. Wind energy could power as much as 20% of the United States by 2030.
Development of local wind farms creates local economic impacts. Impacts associated with the installation/development phase of farm development infuse income into the economy over a 1-2 year period. The long-term employment of field technicians to oversee, manage, and repair a wind farm during its useful life of 25 to 35 years creates a longer term impact. Payments to land owners in exchange for leasing rights also generate a stream of local income. Additionally, turbines and other capital equipment would be subject to property taxes, generating another local income stream. Communities evaluating potential for local establishment of wind farms should recognize that the investment could have positive economic benefits as they go through the process of determining how such an investment would fit into the local economy.
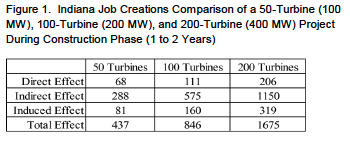
Figure 1. Indiana Job Creations Comparison of a 50-Turbine (100 MW), 100-Turbine (200 MW), and 200-Turbine (400 MW) Project During Construction Phase (1 to 2 Years)
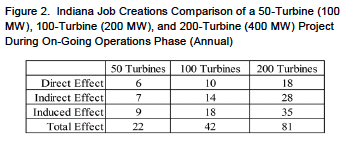
Figure 2. Indiana Job Creations Comparison of a 50-Turbine (100 MW), 100-Turbine (200 MW), and 200-Turbine (400 MW) Project During On-Going Operations Phase (Annual)
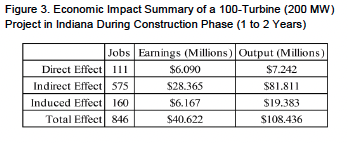
Figure 3. Economic Impact Summary of a 100-Turbine (200 MW) Project in Indiana During Construction Phase (1 to 2 Years)
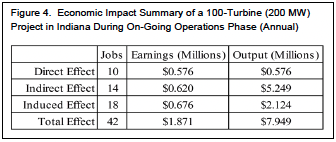
Figure 4. Economic Impact Summary of a 100-Turbine (200 MW) Project in Indiana During On-Going Operations (Annual)
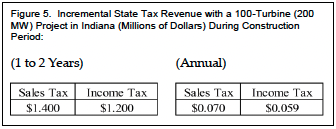
Figure 5. Incremental State Tax Revenue with a 100-Turbine (200 MW) Project in Indiana (Millions of Dollars) During Construction Period:
Sources
―Allegany Wind Farm – Frequently Asked Questions.‖ Allegany Wind Farm website, 2010. <http://www.alleganywindfarm.com/faq.htm>.
“AWEA U.S. Wind Industry Annual Report Year Ending 2009.” American Wind Energy Association, 2010. Accessed on 16 September 2010. <http://www.awea.org/reports/Annual_Market_Report_Press_Release_Teaser.pdf>.
“Comparative Costs of California Central Station Electricity Generation Technologies.‖ California Energy Commission, 2007. Accessed on 17 March 2010. <http://www.energy.ca.gov/2007publications/CEC-200-2007-011/CEC-200-2007-011-SD.PDF>.
Davis, John W. ―Whitley County Wind Farm Ordinance Blown Away.‖ Indiana’s NewsCenter – Fort Wayne – WPTA-TV, WISE-TV, CW and My Network, 18 November 2010. Accessed on 31 March 2011. < http://www.indianasnewscenter.com/news/local/No-Wind-Ordinance-Vote-For-Whitley-County-Wind-Farms-108837674.html>.
Gold, Russell. ―Wind, Sun Power Still Face Hurdles.‖ Wall Street Journal, 31 March 2011. Accessed on 31 March 2011. <http://online.wsj.com/article/SB10001424052748703883504576186961618483344.html>.
“History of Wind Energy.‖ U.S. Department of Energy – Energy Efficiency & Renewable Energy Website, 2005. Accessed on 17 March 2011. <http://www1.eere.energy.gov/windandhydro/wind_history.html>.
Indiana Handbook of Taxes, Revenues, and Appropriations. Indiana Legislative Services Agency, Office of Fiscal and Management Analysis, 2009.
“NREL: Jobs and Economic Development Impacts (JEDI) Models – About JEDI Wind Model.‖ National Renewable Energy Laboratory, 2010. Accessed on 29 March 2011.
<http://www.nrel.gov/analysis/jedi/download.html>.
![]()
![]()
![]()
![]()
![]()
