You need to Re-evaluate Crop Insurance!
April 17, 1994
PAER-1994-02
George Patrick, Professor and Donald Pershing, Extension Economist
![]()
![]()
![]()
![]()
![]()
More famers will be interested in multiple peril crop insurance (MPCI) in 1994. A new insurance plan, based on county yields, has been introduced. Major improvements have been made to the previous plan which continues to be based on an individual’s yields. This article provides a brief overview of the changes, a discussion of the plans, and an analysis of some actual farm situations.
The new alternative, the Group Risk Plan (GRP), is available to corn and soybean producers in most Indi-ana counties.* Indemnities are based on the county’s average yield per planted acre, rather than an individual producer’s yields. GRP can provide a high level of protection, based on up to 90 percent of the expected county yield. The pro-gram is designed to minimize administrative costs and facilitate farmer participation.
The Actual Production History Plan (APHP) has also undergone significant changes. Policies for 1994 and later years will include the delayed/prevented planting coverage automatically. Prior to 1994, crops actually had to be planted before insurance coverage became effective unless a special delayed/prevented planting option had been purchased. Producers with certified production records for four or more years will not use “T-yields” (transitional yields) in determining their yield for insurance purposes. Those producers with less than three years of certified records will be able to use only a percentage of the T-yield to deter-mine their insurance yield. Indemnities under APHP are based on the individual producer’s yield on the insured unit.
GRP is targeted at the above average, low risk farmers whose yields tend to move with those of the county and who are primarily concerned about widespread losses such as drought. APHP provides greater protection for a producer who may suffer a significant loss, such as hail damage, when county average yields may be only slightly affected. Producers cannot carry both GRP and APHP on the same crop in the same county. Because of these new developments in MPCI, Indiana producers should reevaluate crop insurance’s role in their overall risk management strategy. The sales closing date for both GRP and APHP is April 15 for spring planted crops.
Group Risk Plan (GRP)
GRP is based on the idea that farmers in a county are often affected by the same event, such as a wide-spread drought, early fall frost, or other catastrophic event. Producers will differ in how closely their yields track with county yields over time. The GRP premium is based on the historical risk for the county and all farmers in the county pay the same premium per acre for the same insurance coverage. If the county average yield per planted acre drops below the “trigger level,” all producers in the county with the same contract receive the same per acre indemnity payment. Insured producers receive this payment whether or not their individual yields were reduced.
Farmers may elect a coverage level with a “trigger yield” between 65 and 90 percent of the expected county yield. This expected county yield incorporates the yield trend and is likely to be higher than the long-term county average yield per planted acre. For example, the 1994 expected county corn yield for Tippecanoe County is 127 bushels per acre and the 1983-92 average is 116.6 bushels per planted acre. Thus, at the 90 percent coverage level, the trigger yield would be 114.3 bushels. Producers insuring at that level would receive indemnity payments if the county average corn yield is less than 114.3 bushels per planted acre in 1994. Figure 1 illustrates the aver-age county yield per planted acre, expected yield, and the 90 percent trigger yield for corn in Tippecanoe County for 1980 to 1993. With the 90 percent trigger yield, GRP for corn would have paid indemnities in 1980, 1983, 1988, and 1991.
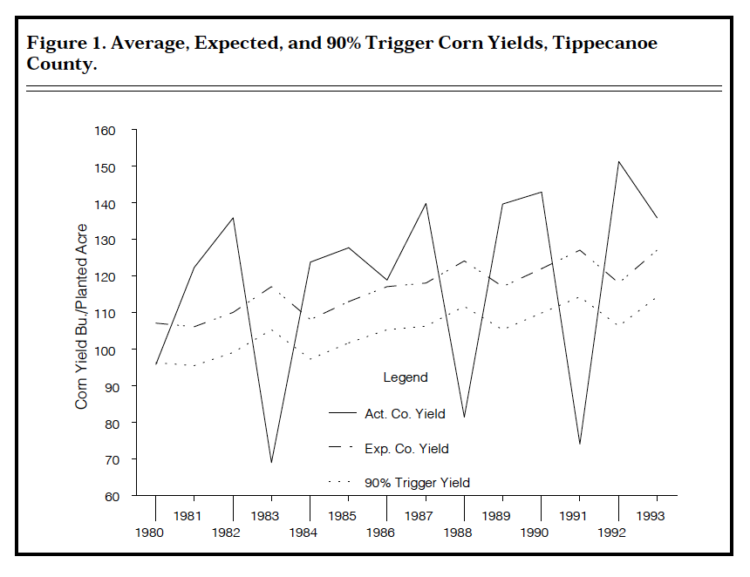
Figure 1. Average, Expected, and 90% Trigger Corn Yields, Tippecanoe County
Farmers may also elect a protection level, the dollars of insurance per acre, which is independent of their own historical yields. The mid-protection level in a county is determined by multiplying the trigger yield times the established price. The national established prices for corn and soybeans in 1994 are $2.20 and$5.75 per bushel, respectively. Thus, for Tippecanoe County the mid-protection level for corn would be 127 bushels times $2.20, or $280 per acre. Producers may purchase a higher level of protection, up to 150 percent of the mid-protection level, or $420 per acre in this case. Thus, producers with yields which are higher than the expected county yield may obtain coverage for their higher yields if they wish. On the other hand, producers seeking to protect only their out-of-pocket expenditures could elect a lower level of coverage. The minimum coverage level is 30 percent of the maximum coverage, or $126 per acre in Tippecanoe County.
The government subsidizes the premiums by the lesser of 30 percent or a maximum amount per acre which varies by county and crop. For example, the maximum per acre subsidies in Tippecanoe County are $4.19 for corn and $2.12 for soy-beans. Table 1 summarizes the unsubsidized premium rates for corn and soybeans in Tippecanoe County. The lower premium rates for soy-beans reflect the lower probability of loss.
The insurance premium is calculated by multiplying the protection level selected by the premium rate and subtracting the lesser of 30 per-cent or the maximum subsidy amount. For example, for the mid-protection level of $280 at the 90 per-cent coverage level, the unsubsidized premium would be $280 times 5.0% or $14.00 per acre. The subsidy is the lesser of 30 percent of $14.00, or$4.20, or the maximum per acre sub-sidy of $4.19. Thus, the net premium would be $9.81 per acre. Reducing the coverage level to 85 percent, a 108.0 bushel trigger yield, would reduce the premium to $7.84 per acre. Alternatively, reducing the protection level to $190 per acre, equivalent to a price of $1.50 per bushel at the 90 percent coverage level would make the premium $6.65 per acre.
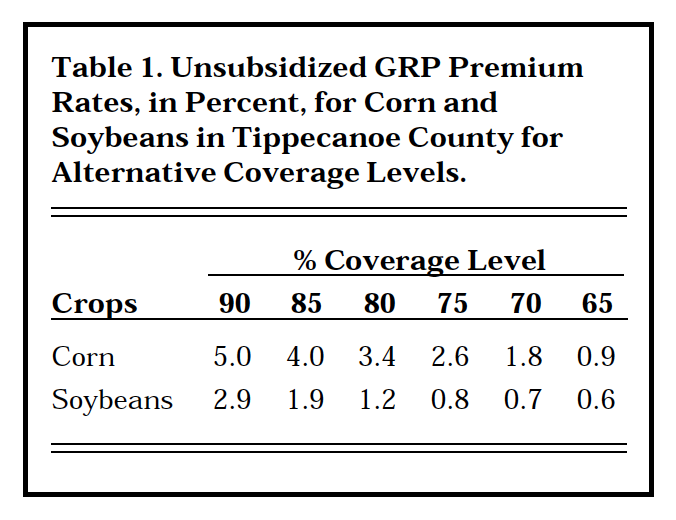
Table 1. Unsubsidized GRP Premium Rates, in Percent, for Corn and Soybeans in Tippecanoe County for Alternative Coverage Levels
Insurance indemnities are paid if the county average yield falls below the trigger yield. If there are severe losses, defined as when the preliminary county yield is less than 85 per-cent of the trigger yield, a preliminary payment is made after November 30th. The final payment is made after April when the final county yield is determined. For example, if the final county corn yield was 100 bushels per planted acre there would be a shortfall of 12.5 percent relative to the 114.3 bushel trigger yield. At the $280 protection level, this would result in an indemnity of 12.5 percent of $280 or$35.03 per acre. If the 85 percent trigger yield had been selected, there would have been a 7.4 percent shortfall and an indemnity of $20.74 per acre.
GRP provides protection for wide-spread losses but does not protect well against hail and other isolated losses. If a producer’s yields do not track with county average yields, GRP may not provide the protection desired. A farmer’s actual yields have no effect on insurance indemnities. Thus, a producer may suffer a loss and receive no indemnity. On the other hand, an insured farmer may receive an indemnity when the average county yield is below the trigger yield and the farmer has no loss.
Actual Production History Plan (APHP)
APHP is the new name for an improved model of multiple peril crop insurance. APHP guarantees a minimum average yield per acre for the insured crop for the insured unit, with the minimum determined by the deductible chosen by the farmer. If the producer’s average yield for the insurance unit falls below the level specified in the pol-icy, an indemnity is paid. Yields are adjusted for quality losses such as low test weight or an aflatoxin infestation. APHP covers unavoidable production losses caused by forces outside a producer’s control such as drought, excessive moisture, hail, wind, frost/freeze, excessive temperature, insects, diseases, and natural disasters. Many policies also cover the costs of replanting if necessary. Losses caused by poor farming practices or theft are not covered.
Producers may elect to insure at one of four coverage levels. These are 75, 65, 50, or 35 percent of the insurance yield. These coverage levels correspond to 25, 35, 50, and 65 percent deductibles, respectively. For example, if a producer had an insurance yield of 120 bushels of corn per acre, the producer’s actual average would need to fall below 90 bushels, the guarantee level, for an indemnity to be paid if 75 percent coverage level had been chosen. If the 65 percent coverage level had been elected, yields would need to drop below the guarantee level of 78 bushels per acre to receive insurance indemnities.
Farmers with four or more years of certified production records can base their insurance yield entirely on their actual yields. However, farmers without certified production records have an insurance yield which is only 65 percent of the county T-yield. For example, the T-yield for corn in Tippecanoe County is 129 bushels per acre. Thus, a farmer without any production records would have an insurance yield of only 84 bushels per acre. If a farmer has production records for one year, then 80 percent of the T-yield can be used for the other three years. For example, if a farmer had a 1993 yield of 140 bushels per acre, the insurance yield would be the average of 80 percent of 129 bushels for three years plus 140 or 112.4 bushels per acre. With records for two years, the percentage of T-yields used increases to 90 percent for the missing years. When the producer has records for three years, the entire T-yield can be used for the missing year. This change was instituted to prevent abuses of the pro-gram by farmers with below average yields. In the past, farmers without production records have been able to use the T-yield for insurance purposes.
Farmers with more than four years of production records can use the additional years to reduce the effect of a bad year on their insurance yield. There is a 15 percent
“cap” on insurance yield increases in one year and a 10 percent “cup” on insurance yield decreases in one year.
Participants in APHP continue to be required to provide their Social Security number or Employer Identification number. This allows the Federal Crop Insurance Corporation to track producers who have participated in the crop insurance program and their previous yields. The intent was to avoid abuses of the program by producers with poor performances who have been changing insurance companies in an attempt to get a fresh start with respect to yields. Recent changes in the use of T-yields reinforces this attempt to limit the “adverse selection” of insureds.
Producers in 1994 will automatically receive coverage for delayed/prevented planting, no special option will be required. If a producer is unable to plant because of weather conditions, the yield guaran-tee level will be reduced 1 percent per day delay in planting for up to 10 days after the final planting date (June 5, corn; June 20, soybeans). The reduction in yield guarantee level increases to 2 percent per day planting is delayed for the next 15 days. The maximum delayed planting yield reduction is 40 percent. A corn producer with a 90 bushel guarantee level who was entirely pre-vented from planting corn in 1994 would receive payment based on 50 percent of the 90 bushels, or 45 bushels.
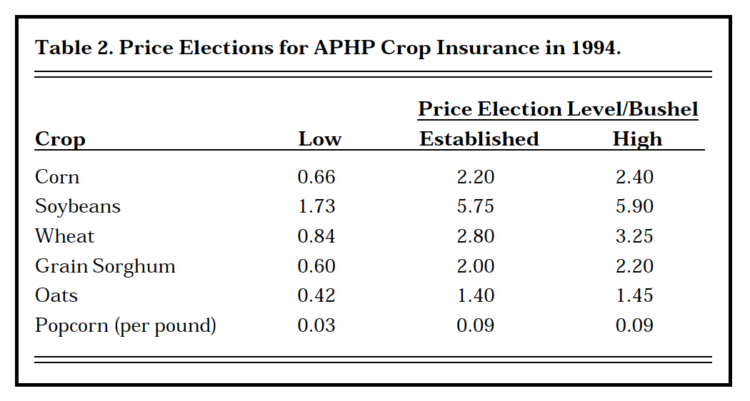
Table 2. Price Elections for APHP Crop Insurance in 1994
Producers may elect a price used for premium and indemnity calculations which can be from 30 to 100 percent of the established price. The high, or market-based, price election for some commodities is based on 80 percent of the average futures price during the last five trading days of specified periods. Under no circum-stances may the high price election be less than the established price. The 1994 price elections for the primary Indiana crops are summarized in Table 2.
Premium rates are based on yield spans and coverage levels. Higher yields pay a lower rate, while higher coverage levels (lower deductibles) pay higher rates. For example, a Tippecanoe County producer with an insurance yield of 120 bushels per acre would have a subsidized premium rate of 2.9 percent for the 65 percent coverage level and 5.4 per-cent for the 75 percent coverage level. If the farmer’s insurance yield was 140 bushels per acre, the rates would drop to 2.5 and 4.3 percent for the 65 and 75 percent coverage levels, respectively.
If a Tippecanoe County farmer had an APHP insurance yield of 127 bushels per acre, the county expected yield, the premium would be computed using a 4.8 percent rate for the 75 percent level of coverage level. The APHP yield of 127 bushels is multiplied by the 75 percent cover-age level to obtain the guarantee level of 95 bushels. The 95 bushel guarantee level is multiplied by the price election, $2.20 per bushel, to determine the per acre protection of$209. The $209 protection level times the 4.8 percent premium rate gives a $10.03 per acre premium. If the 65 percent coverage level had been chosen, the premium would be$4.90 per acre.
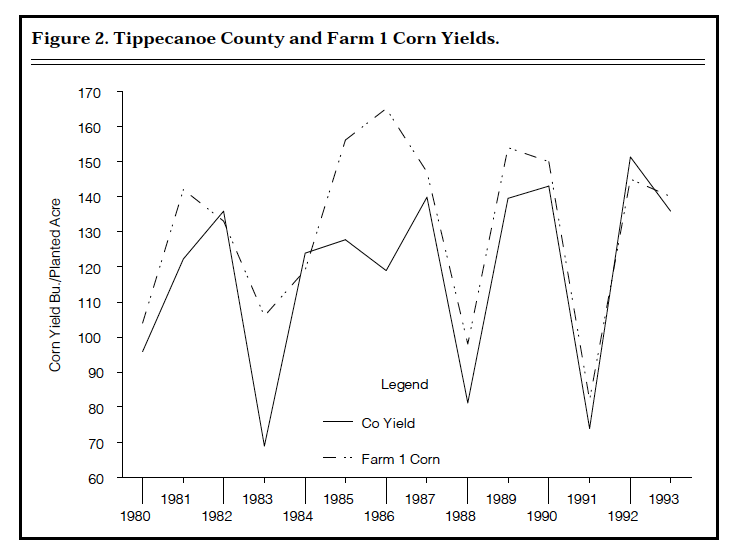
Figure 2. Tippecanoe County and Farm 1 Corn Yields
An indemnity would be paid if the individual producer’s actual aver-age yield on the insurance unit fell below the yield guarantee level. With the 95 bushel yield guarantee level, the farmer would receive $2.20 per bushel of yield shortfall. For example, if the producer’s actual 1994 yield was 80 bushels per acre, the producer would receive an indemnity of $33 per acre.
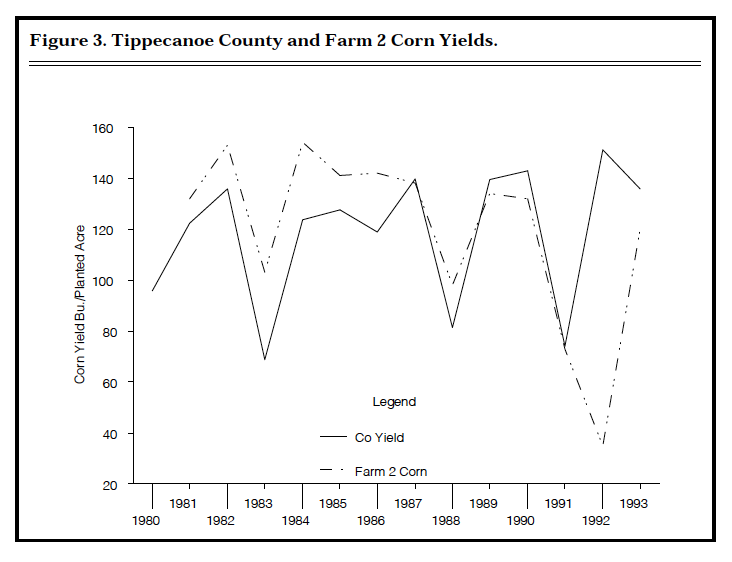
Figure 3. Tippecanoe County and Farm 2 Corn Yields
Comparing GRP and APHP
How would producers have fared under GRP and APHP? The answer will vary depending on individual circumstances but the experience of two southern Tippecanoe County farms may be helpful. The crop which is being considered is also important. This section will first con-sider corn, and then soybeans.
Corn
Figure 2 shows the actual 1980 to 1993 corn yields for Farm 1 and the county average yield per planted acre. Farm 1’s yields were generally above the county yields, they aver-aged 131.5 bushels per planted acre as compared to 116.8 for the county from 1980 to 1992. Although the ups and downs in yields do not track perfectly, Farm 1’s bad years were the same as those of the county.
To compare GRP and APHP, it was assumed that the producer would purchase the same dollars of insurance coverage per acre under both programs. The 1994 APHP corn yield would be 136 bushels per acre which, at the 75 percent coverage level and $2.20 price election, equals a $224 per acre protection level. The cost of APHP would be $9.20 per acre. The premium cost for $224 per acre of GRP insurance coverage with a 90 percent trigger yield would be$7.84 per acre. Over the 1980 to 1993 period, Farm 1 would have received APHP indemnities in 1988 and 1991, and would have received GRP indemnities in 1980, 1983, 1988, and 1991. Total APHP indemnities for 100 acres during the 1980 to 1993 period would have been $5,115 with a total premium cost of$12,880. Total GRP indemnities for 100 acres during the 1980 to 1993 period would have been $21,832 and the premiums paid would have totaled $10,976.
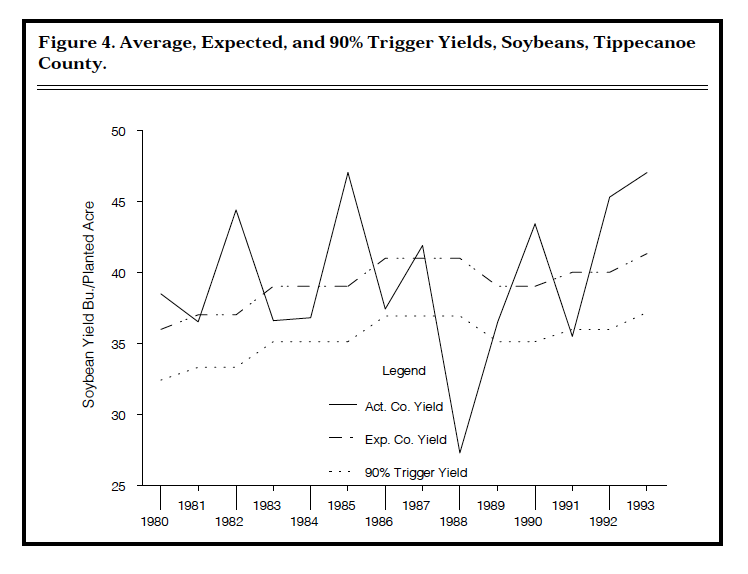
Figure 4. Average, Expected, and 90% Trigger Yields, Soybeans, Tippcanoe County
Farm 2 had the 1981 to 1993 corn yields indicated in Figure 3, as no corn was grown in 1980. Farm 2’s yields generally tracked county yields. However, when the county had its highest yield in 1992, Farm 2 was hit by a late spring frost and had its lowest yield for the entire period. With an APHP yield of 117 bushels per acre, Farm 2 would have received APHP indemnities on 100 acres of $3,493 in 1991 and $10,879 in 1992. Under an equivalent $193 per acre protection level of GRP, indemnities would have been received in 1983, 1988, and 1991. Total indemnities under APHP would have been $14,372 and premiums would have totaled $11,544. With GRP, indemnities would have totaled $18,750 and total premiums would have been $8,788. It is import-ant to note that no GRP indemnity would have been paid to Farm 2 in 1992, the year of its worst loss. A primary purpose of insurance for many people is to provide liquidity when it is needed and GRP would not have provided liquidity in 1992.
The experience of these two farms suggests that corn producers are likely to collect more frequently with GRP than with APHP. This is due primarily to the higher trigger level associated with GRP. The indemnities collected would have been greater and premium costs lower with GRP. However, as illustrated by Farm 2, very significant losses can occur for individual farms which would not be covered with GRP.
Soybeans
Figure 4 shows the actual, expected, and 90 percent trigger yields for soy-beans in Tippecanoe County for the 1980 to 1993 period. There are only two years in the 14 year period when GRP for soybeans would have paid an indemnity. The 1988 indemnity would have been sizeable but the 1991 payment would have been small. As noted above, the GRP premium rates for soybeans are lower than for corn because the historical frequency of loss has been less.
Figure 5 shows actual soybean yields for Farm 1 and Tippecanoe County over the 1980 to 1993 period. Although yields tended to go up and down together, Farm 1 had a bad year in 1989, the year following the low county yields of 1988. The 1994 APHP yield for Farm 1 is 45 bushels per acre. At the $5.75 price election and the 90 percent trigger level, this is the equivalent of $194 of insurance protection under GRP. The premiums per acre would be $6.99 for APHP and $3.94 for GRP. Over the 13 years when soybeans were grown from 1980 to 1993, a total of $9,087 in premium would have been paid under APHP for 100 acres and $575 indemnities would have been received. With GRP, $5,122 would have been paid in premiums and $5,680 received in indemnities.
Although only one farm was presented, additional analyses suggest Tippecanoe County soybean producers are less likely to receive indemnities with APHP than corn producers. Even with GRP, indemnities have been less frequent for soybean pro-duction. However, premium costs with GRP were lower than APHP.
Conclusions and Management Implications
Producers will need to evaluate GRP and APHP for their specific situations. If a producer’s yields track the ups and downs, especially the downs, of county yields, then GRP may provide good protection. Individuals with several soil types or farming in different parts of the county are likely to be in this category. However, if a producer’s yields do not track county yields, the individualized coverage of APHP may be needed. If a county has two distinct soil types, the county average yield may not reflect either area or the actual yields on individual farms very well.
Neither APHP nor GRP provide very good protection against hail or other isolated losses. If hail is a concern, farmers may wish to purchase only hail/fire protection. However, hail insurance may be combined with either APHP or GRP.
Producers differ in their ability to bear risk. Some farmers may decide not to carry crop insurance, while others cannot take that chance. Some lenders may require borrowers to carry crop insurance. Lenders may be more comfortable with APHP than GRP because of the link to the individual producer’s yields. Farmers should remember that APHP generally pays within 30 days of a loss. With GRP, in some cases, no payment will be made until May of the following year.
Only a limited number of producers, those most likely to have losses, have tended to buy crop insurance in the past. This process, called adverse selection, has resulted in APHP premium rates which, in spite of the government subsidy, may be high for the risks faced by the “good” producers. GRP does not have this problem. Furthermore, indemnities are based on county average yields and individual producers can do little to influence the outcome. The GRP rates are based on the 1962 to 1992 yields and appear “fair.” With the 30 percent subsidy on premiums, the long-term cash flow return from GRP should be positive for producers but may not be as favorable as the example farms.
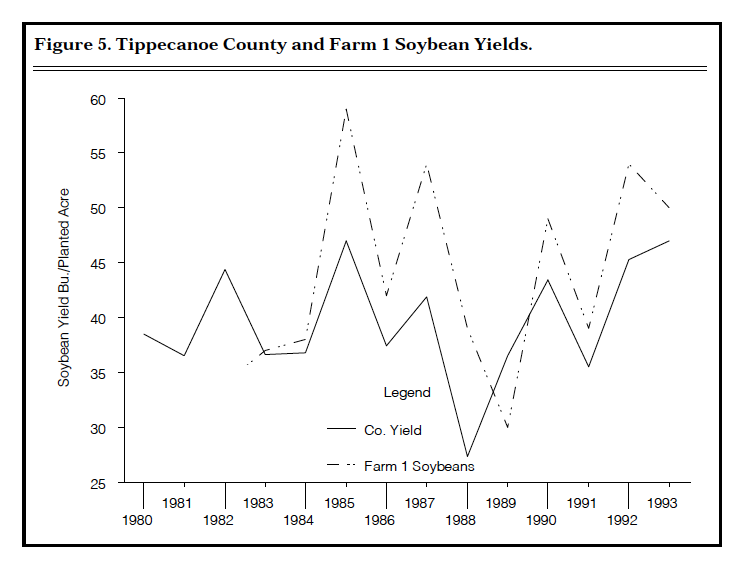
Figure 5. Tippecanoe County and Farm 1 Soybean Yields
The limited analysis of actual farms suggests that corn may be a better insurance bet than soybeans. Losses with corn tend to be more frequent and larger than with soy-beans. Corn and soybean yields do tend to move together. Although the premium rates for corn are higher than for soybeans, some producers may carry higher coverage on corn and not insure soybeans. If corn yields are down, the extra indemnity may cover possible soybean losses. If hay for livestock is a major crop, a higher coverage on corn may also help offset the additional expense of buying hay.
Crop insurance is different in 1994! The new plans may have a role in your revised risk management program. As crop insurance continues to change, reevaluate its role for you and your farm operation.
* GRP is not available for corn in Brown, Crawford, Dearborn, Floyd, Monroe, Ohio, Perry, and Switzerland counties. The soybean GRP program is not avail-able in the counties above or in Lawrence, Martin, and Orange counties.
![]()
![]()
![]()
![]()
![]()
