Ag Economy Barometer Slides Lower, Producers Concerned About War’s Impact on Input Prices
James Mintert and Michael Langemeier, Purdue Center for Commercial Agriculture
A breakdown on the Purdue/CME Group Ag Economy Barometer March results can be viewed at https://purdue.ag/barometervideo. Find the audio podcast discussion for insight on this month’s sentiment at https://purdue.ag/agcast.
Download report (pdf)
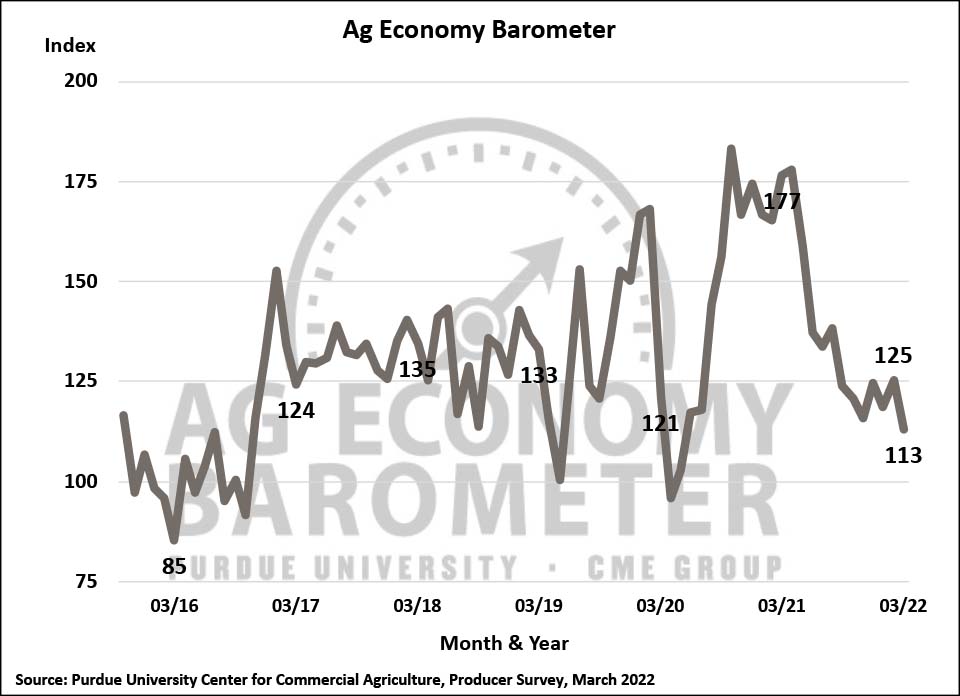
The Purdue University-CME Group Ag Economy Barometer dipped to a reading of 113 in March, the weakest farmer sentiment reading since May 2020 which was in the early days of the pandemic. The March reading was 12 points lower than a month earlier and 36% lower than in March 2021. The decline in the barometer was driven both by weaker perceptions of current conditions and expectations for the future. Compared to February, the March Index of Current Conditions declined 19 points to 113 and the Index of Future Expectations declined 9 points to 113. When compared to a year earlier, producers’ appraisal of current conditions was down 44% while their expectations for the future fell 31%. The Purdue University-CME Group Ag Economy Barometer sentiment index is calculated each month from 400 U.S. agricultural producers’ responses to a telephone survey. This month’s survey was conducted from March 14-18, 2022.


Producers continue to say that they expect their farm’s financial performance to decline in 2022 compared to 2021. The March Farm Financial Performance Index, at a reading of 87, was up slightly (4 points) compared to February but it was still 30% lower than a year earlier. When producers think about how their farm will fare financially in 2022, it’s clear they do not expect commodity price strength to offset the dramatic rise in farm production costs they are experiencing.
The biggest concern among producers for their farming operation this year continues to be “higher input costs”. Drilling down a bit further, it’s clear that disruptions to trade in ag commodities and key inputs such as fertilizer resulting from the war in Ukraine are on producers’ minds as 19% of respondents chose “availability of inputs” as their biggest concern, matching the percentage of producers who chose “lower crop and/or livestock prices”. The March survey provided the first opportunity to ask producers explicitly how they expect war in Ukraine will impact U.S. agriculture. Producers overwhelmingly said they expect input prices to be most affected (63% of respondents) followed by crop prices (33% of respondents) and livestock prices (3% of respondents).
When asked about their expectations for farm input prices in the upcoming year, 57% of producers said they expect farm input prices to rise by 20% or more and 36% said they think input prices will rise by 30% or more. Responding to a related question, just over one-fourth (27%) of producers say they’ve had difficulty purchasing crop inputs for the 2022 crop season. Responses to this question have been consistent since January, with 27 to 30% of producers indicating they faced input supply challenges. Supply chain problems continue to be wide-ranging with herbicides and fertilizer posing the most problems followed closely by farm machinery parts.

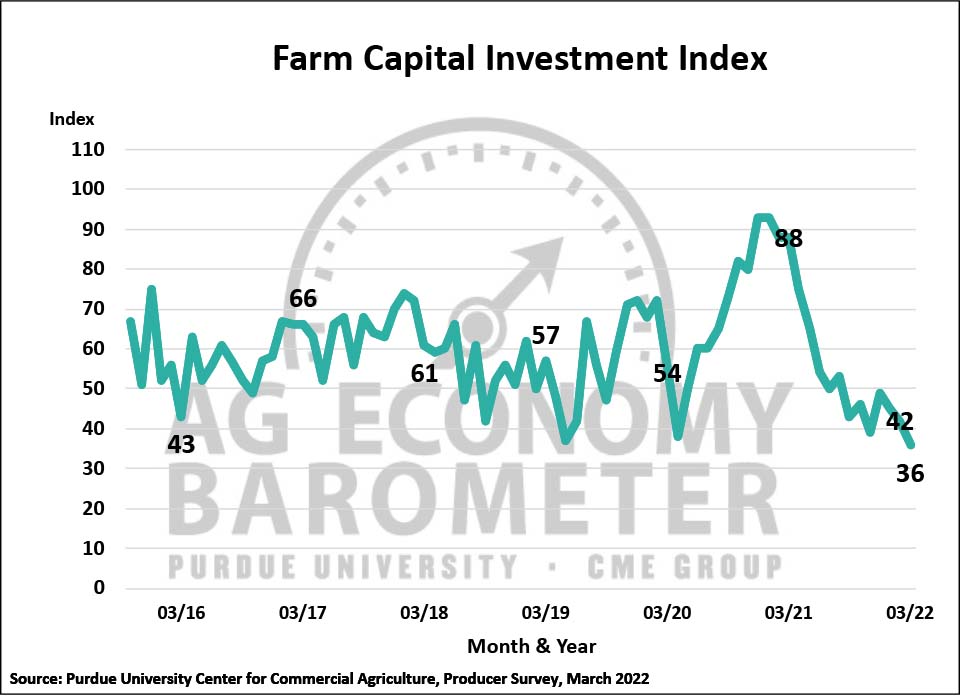
Producers do not view this as a good time to make large investments in their farming operations as the Farm Capital Investment Index in March fell yet again. The March index reading of 36 was 6 points lower than a month earlier and 59% lower than in March 2021. In a pair of follow-up questions, 62% of respondents said their plans for farm machinery purchases in the upcoming year are lower than a year earlier, which is the most negative response to that question since May 2020. When asked a similar question about farm building and grain bin construction plans, 68% of respondents chose “lower” which was the most negative response received to that question since its first inclusion in a barometer survey in May 2021. Supply chain problems continue to haunt both the farm machinery and construction sectors and are one of the reasons producers don’t view this as a good time for large investments. For example, 42% of producers this month said their machinery purchase plans were impacted by low farm machinery inventories, consistent with industry reports that major machinery manufacturers are experiencing order backlogs.


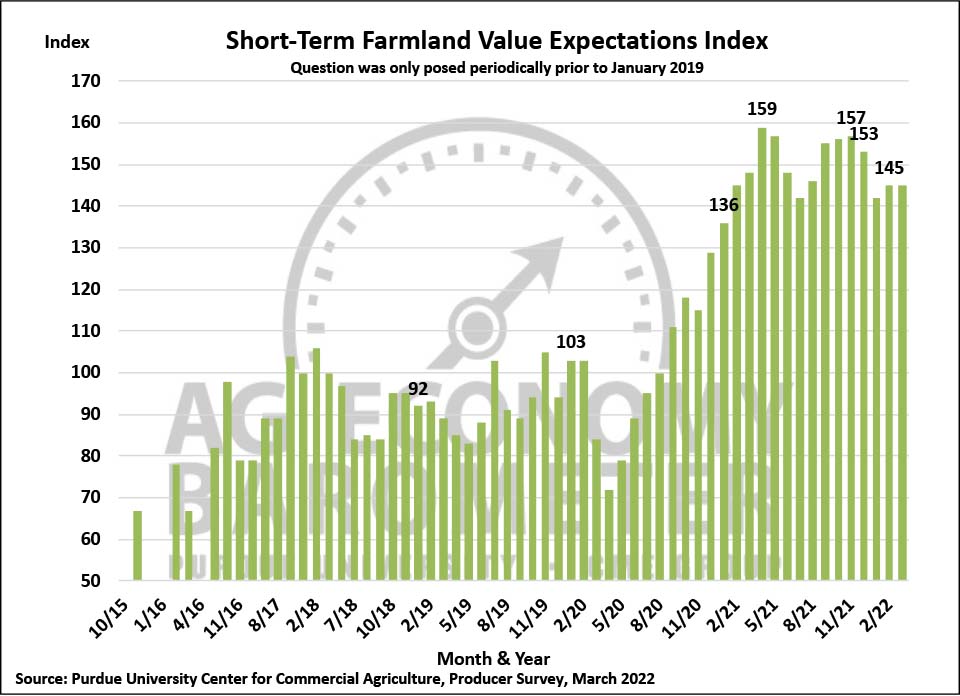
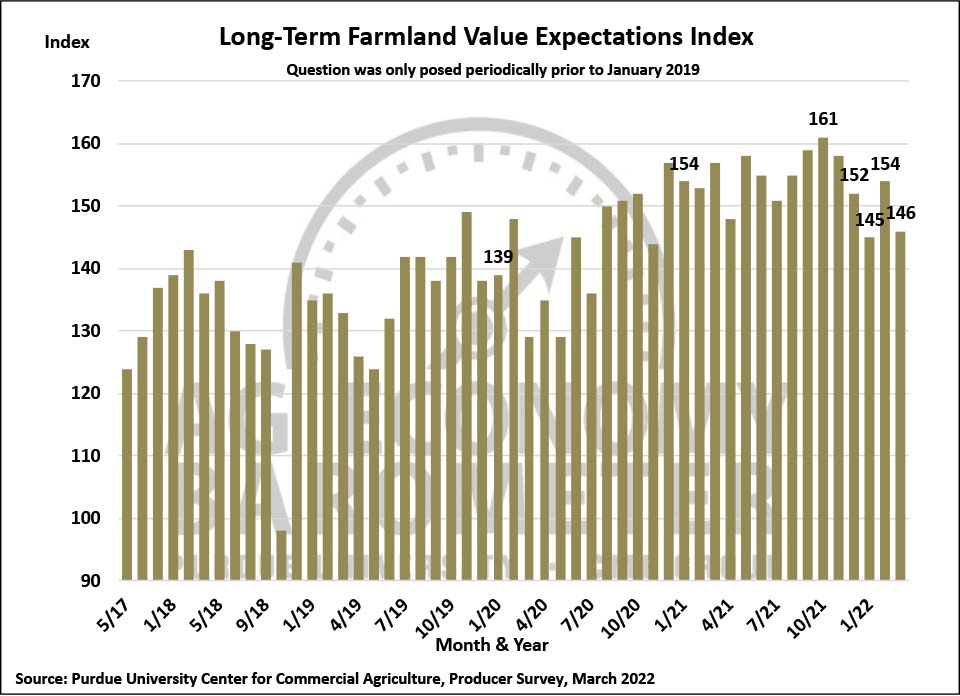
There was little change in the farmland value indices in March. The short-term index remained at 145 while the long-term index dropped back 8 points to 146, which left it one point above its January reading. When three-month moving averages of both the long and short-term indices are examined, however, it does start to look like producers are less bullish about farmland values than they were last fall. The three-month moving averages for both the long and short-term indices peaked last fall and now stand 7 to 8% below, respectively, their November 2021 level. The shift could simply reflect how rapidly farmland prices have increased recently and how difficult producers expect it to be for values to continue increasing from current levels.

Wrapping Up
Ag producers’ sentiment weakened in March as the Ag Economy Barometer fell 12 points below February’s reading, making it the weakest sentiment reading since May 2020. Concern about the impact of rising input prices and input availability on their farming operations was paramount in the minds of producers responding to the March survey. The war in Ukraine exacerbated producers’ worries about production costs with nearly two-thirds of producers expecting the biggest impact on U.S. agriculture from the war to be on input prices. Uncertainty and supply chain issues continue to hamper producers’ investment plans with over 60% of producers indicating their farm machinery purchase and construction plans for the upcoming year are lower than a year earlier. Although producers’ perspective on farmland values changed little in March compared to February, it does look like producers are less bullish about farmland values than last fall as three-month moving averages of both the long and short-term farmland value indices in March were 7 to 8 percent below, respectively, their November 2021 peak.


